Introduction
Multivariate ordination and cluster analysis were introduced to paleoecology half a century ago (Reyment Reference Reyment1963; Valentine and Peddicord Reference Valentine and Peddicord1967) and are now employed routinely. However, problems with applying multivariate methods to fossil data remain unresolved. For example, Bush and Brame (Reference Bush and Brame2010) only recently used simulation analyses to revisit the debate over whether detrended correspondence analysis (DCA; Hill and Gauch Reference Hill and Gauch1980) performs better or worse than nonmetric multidimensional scaling (NMDS; Shepard Reference Shepard1962), both methods having gained traction in paleoecology (e.g., Holland et al. Reference Holland, Miller, Meyer and Dattilo2001; Bonelli et al. Reference Bonelli, Brett, Miller and Bennington2006).
The very core of the matter is that paleontological data, and especially binary presence-absence data, are almost invariably biased in important ways. Samples are of different sizes, preservation quality varies from place to place, taxonomy is often problematic, specimens are often unidentifiable, and so on. The unequal sample-size problem is particularly obvious, which may explain why it was addressed so very early on by the development of a binary faunal similarity coefficient intended for use with fossil data (Simpson Reference Simpson1943). The main purpose of the current paper is to address this particular issue in the specific context of multivariate analysis.
It is well known that other, more popular similarity measures such as the Dice coefficient are downward-biased when sampling is partial (Chao et al. Reference Chao, Chazdon, Colwell and Shen2005). This kind of bias could distort an ordination by exaggerating apparent differences between pairs of species lists, which should amplify what is called the arch effect (Hill Reference Hill1973; Holland et al. Reference Holland, Miller, Meyer and Dattilo2001). An arch is present when the second-axis scores in an ordination are a quadratic function of the first-axis scores. To put this another way, the two ends of the primary gradient are pulled together on the second axis because the dissimilarity between samples at the endpoints has reached or at least approached the maximum possible value.
In this paper I show how to ameliorate the arch effect and disentangle preservational biases from biological signals by using a better distance measure. It is the additive complement of a newly described similarity metric (Alroy Reference Alroy2015) that is an emendation of one going back to Forbes (Reference Forbes1907). Forbes’s measure F is:
 $$F=a\,N/\left[ {(a{\plus}b)\,(a{\plus}c)} \right]$$
where a=the number found in both of the samples being compared, b and c=the numbers found only in one sample or the other, d=the number found in neither sample, and N=a+b+c+d.
Forbes’s index has two major problems that are particularly serious in a paleoecological context. First, d is a meaningless number unless the data set captures effectively all of the species that existed in the biological system being studied. Such a thing is almost never true of fossil data. Second, Forbes’s index is demonstrably upward-biased when sampling is very good. This bias is at its worst when true similarity, meaning the value a’/(a’+b’) or a’/(a’+c’) where the prime symbol indicates that there is no sampling bias, is around 50%.
The first problem is easily solved by ignoring the term d in computing N. Call this smaller sum n=a+b+c. Although this simple modification helps, it does not fully compensate for the upward bias. As has been shown (Alroy Reference Alroy2015), adding some mild, heuristic correction terms to the equation does:
 $$F=a(n{\plus}{\rm sqrt } \ n)]/\left[ {a(n{\plus}{\rm sqrt } \ n)\,{\plus}\,3/2\,b\,c)} \right]$$
This new index ranges strictly between 0 and 1, unlike equation (1) (which can exceed 1 when the number of species shared is greater than expected by chance). Specifically, it is equal to 0 whenever the two samples share no species and equal to 1 whenever they are identical or one is a subset of the other.
Meanwhile, Simpson’s solution to the unequal sample-size problem (Simpson Reference Simpson1943) is to use the ratio S=a/(a+b) if b<c and otherwise a/(a+c). In other words, his index is the number of shared species divided by the richness of the poorer sample. Simpson’s index is still sometimes used in paleontology (e.g., Tsubamoto et al. Reference Tsubamoto, Takai and Egi2004).
Finally, another metric worthy of attention is the Dice (also known as Sorenson) coefficient D=2a/(2a+b+c). Many others exist (Choi et al. Reference Choi, Cha and Tappert2010), but the Dice coefficient has robust theoretical properties (Hubálek Reference Hubálek1982) and is very widely used in ecology, so it is the focus of much discussion in this paper. All of the criticisms leveled against it apply equally well to other widely known metrics such as the Jaccard index (which is even more downward-biased), the Ochiai index, the Kulczynski index, and so on.
After showing by simulation that the adjusted Forbes index works well even when sample sizes are uneven, I then present two simple empirical cases in which a conventional ordination either collapses biogeographic signals or produces an arch, but an ordination employing F′ removes both problems. No claim is made that this approach is a panacea, but the results suggest that use of F′ by paleoecologists and others should be considered a serious option.
Simulation Analysis
Analyses of simulated data matrices are used here to illustrate the different properties of the indices, and in particular to demonstrate that the Forbes index solves the crucial paleoecological problem of uneven sampling. The matrices were created using a Monte Carlo procedure. Species richness in each of two partially overlapping species pools was set to 100. The pools had 50% overlap, meaning that 50 species were found in both, 50 were found only in the first, and 50 were found only in the second. To construct the sampling pool, relative species abundances were generated by drawing numbers at random from a normal distribution with a mean of zero and a standard deviation of 2.5, exponentiating them, and dividing them through by their sum. Two sampling levels were assumed: either 100 or 1000 specimens. Specimens were drawn randomly to create 40 samples representing the four possible combinations of sample sizes and pool identities and the similarity measures were then computed. The similarities were converted to distances by subtracting them from 1, which is necessary to make cluster analysis and ordination possible.
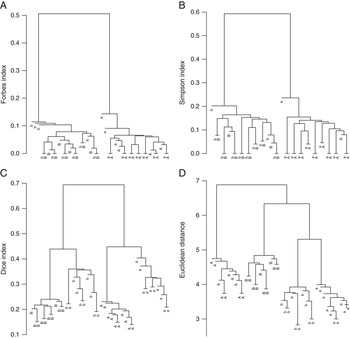
An unweighted pair-group (UPGMA) cluster analysis shows that the corrected Forbes index is almost completely unaffected by sample size (Fig. 1A). It breaks the samples down by species pool (“a” plus “A” or “b” plus “B” in the figure) and fully intermixes the large and small samples. Indeed, it resolves the hierarchy down into pairs that consistently include one large sample and one small sample. The apparent reason is that each small sample is usually more similar to some of the large ones than to most or any of the small ones, thanks to high random error in its presence-absence pattern. The cluster dendrogram also puts almost all the tips at a roughly equal distance from the root (i.e., it is nearly ultrametric) and correctly shows that differences between samples in the same class are small.
UPGMA (unweighted pair group with arithmetic mean) cluster dendrograms based on analyses of a simulated 40-sample data set using four different distance metrics. Computations were carried out using the R function hclust. “A” and “B” indicate 1000-specimen samples and “a” and “b” indicate 100-specimen samples. “A” and “a” samples are drawn from one pool and “B” and “b” samples from another. A, Distances are based on the Forbes index. B, Simpson index. C, Dice index. D, Euclidean distances.

By contrast, Simpson dissimilarities suggest that there are fairly substantial differences within the a + A and b + B clusters (Fig. 1B). The dendrogram is also not nearly as ultrametric. Worst, Dice dissimilarities and Euclidean distances are completely fooled by sampling bias: each of these metrics creates four clusters that correspond to combinations of species pools and sample sizes (Figs. 1C,D). The dendrograms are again not nearly as close to being ultrametric, and they suggest even larger differences between samples that are illusory. In a word, these methods reflect sampling just as strongly as they do the underlying biological pattern.
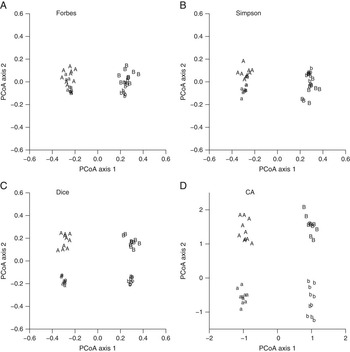
Multivariate ordination shows exactly the same thing. Principal coordinates analysis (PCoA; Gower Reference Gower1966) is the parametric equivalent of NMDS and is therefore appropriate for showing how distance measures perform without obscuring their scaling properties relative to one another. A standard correspondence analysis (CA; Hill Reference Hill1973) is also illustrated because this method has a strong reputation in ecology (Gauch Reference Gauch1982; Digby and Kempton Reference Digby and Kempton1987; Legendre and Gallagher Reference Legendre and Gallagher2001). All of the treatments recover the difference between the two species pools on the first axis. However, the PCoA plot for the corrected Forbes index (Fig. 2A) shows that it minimizes the sampling signal on the second axis. By contrast, the other methods pull apart the small and large samples and only the Simpson index comes close to removing the bias (Fig. 2B–D). These results suggest that any analysis of paleoecological data could be distorted simply because studies presenting order-of-magnitude variation in sample size are routine. Bonelli et al. (Reference Bonelli, Brett, Miller and Bennington2006) and Bush and Brame Reference Bush and Brame2010) are just two examples out of many.
Multivariate ordinations of the same simulated data set that was subjected to cluster analysis (Fig. 1). Letters correspond to groups of samples also illustrated in Fig. 1. A, Principal coordinates analysis (PCoA) with distances based on the adjusted Forbes index. B, PCoA based on the Simpson index. C, PCoA based on the Dice index. D, Correspondence analysis.

Pleistocene Faunal Analysis
The Pleistocene record of North American mammals is a good test case for methods because there are strong biogeographic signals (Graham et al. Reference Graham, Lundelius, Graham, Schroeder, Toomey, Anderson, Barnosky, Burns, Churcher, Grayson, Guthrie, Harington, Jefferson, Martin, McDonald, Morlan, Semken, Webb, Werdelin and Wilson1996) in addition to an overriding taphonomic bias: most assemblages are dominated either by extinct megafaunal species or by extant small mammals. Thus, patterns in ordination plots are easily interpretable and a best-case scenario is easy to define: the first two axes should capture geography and the samples should not segregate strongly on the basis of body mass.
Forty seven late Pleistocene species lists were downloaded from the Fossilworks data portal (http://fossilworks.org) on 10 March 2014. Almost all of the lists were compiled by myself and Mark Uhen; many derive from the North American Mammalian Paleofaunal Database (Alroy Reference Alroy1999) and others from the Paleobiology Database. The data were spatially restricted to the United States because the fossil record of Mexico and Canada is relatively poor in this interval. Specifically indeterminate records and records of marine mammals and bats were excluded, and collections with fewer than ten species were discarded in order to make sure that similarity indices could be computed with a fair degree of precision. This treatment also minimizes the effect of sample-size variation, making the analysis more conservative. Average log body-mass values were computed for each collection by matching the species lists to the comprehensive global data set of Smith et al. (Reference Smith, Lyons, Ernest, Jones, Kaufman, Dayan, Marquet, Brown and Haskell2003), which includes estimates for extinct megafauna in addition to Recent species.
Similarities were computed using the adjusted Forbes F′, Simpson S, and Dice D coefficients and subtracted from 1 to produce distances. The distance matrices were then ordinated using PCoA, which again is the metric equivalent of NMDS. Because correct scaling is an apparent characteristic of F′ (Fig. 1) (Alroy Reference Alroy2015), use of PCoA was considered to be a more relevant test of its properties than use of NMDS. As with the simulation, the data were subjected to a correspondence analysis (CA). CA was used instead of DCA because removing the arch effect in these data with such a brute-force method would make it harder to test the hypothesis that the F′ does minimize sampling biases.
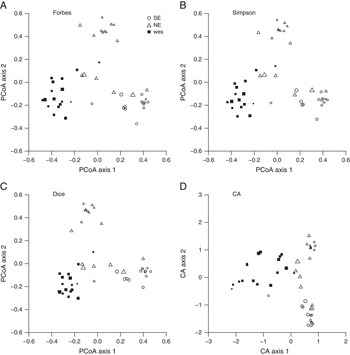
All of the PCoA ordinations clearly suggest that there are three large and well-spaced groupings of assemblages, each of which corresponds to a geographic region (Fig. 3A–C). These clusters are of samples from the southeastern United States (most of which are from Florida), the northeastern United States, and the western United States. This pattern is unsurprising. For example, Graham et al. (Reference Graham, Lundelius, Graham, Schroeder, Toomey, Anderson, Barnosky, Burns, Churcher, Grayson, Guthrie, Harington, Jefferson, Martin, McDonald, Morlan, Semken, Webb, Werdelin and Wilson1996) performed a TWINSPAN cluster analysis of similar FAUNMAP data and found an almost identical three-way primary split in the data. Simpson (Reference Simpson1964) showed that the east-west biogeographic split corresponds to a sharp drop in species richness at the boundary between the Rocky Mountains and the Great Plains. Finally, Hagmeier and Stults (Reference Hagmeier and Stults1964) proposed a North American mammalian biogeographic classification that would place most of the Florida and northeastern U.S. fossil samples within just two provinces (respectively, the Austroriparian and Illinoian). Thus, the current results and those of Graham et al. (Reference Graham, Lundelius, Graham, Schroeder, Toomey, Anderson, Barnosky, Burns, Churcher, Grayson, Guthrie, Harington, Jefferson, Martin, McDonald, Morlan, Semken, Webb, Werdelin and Wilson1996) may simply reflect the coincidence between sampling gaps and provincial boundaries.
Multivariate ordinations of Pleistocene mammal data based on four different methodologies. NE=northeastern U.S. (open triangles); SE = southeastern U.S. (open circles); west = western U.S. (solid squares). Point sizes are directly proportional to the log mean body mass of the species in a given sample. A, Principal coordinates analysis (PCoA) with distances based on the adjusted Forbes index. B, PCoA based on the Simpson index. C, PCoA based on the Dice index. D, Correspondence analysis.

Nonetheless, the ability of the methods to recover these partially artifactual patterns is of keen methodological interest. Only F′ (Fig. 3A) and the Simpson index (Fig. 3B) generate an entirely clean separation on axis 1 between samples from the east and west. By contrast, the CA ordination (Fig. 3D) tightly clusters all of the eastern U.S. samples into one end of the first axis; it also suggests relatively much greater variation amongst the western samples and obscures the gaps between the three groupings. Meanwhile, the Dice coefficient (Fig. 3C) causes samples from the northeast and west to overlap on axis 1.
All three PCoA plots pull out the northeastern U.S. samples on axis 2 (Figs. 3A–C). These assemblages happen to be dominated by small mammals, and other northeastern samples dominated by large mammals fall closer to the centers of the plots. The likely reason is not that the large mammal samples are either particularly rich or poor, but rather that large mammals tend to have large geographic ranges in the Recent and this pattern also held during the Pleistocene. Thus, large mammal-dominated assemblages are unlikely to capture regional differences. Axis 2 therefore seems to present a mixture of geographic and taphonomic signals.
Of more interest, the axis 2 pattern suggests that CA in fact does suffer from an arch effect, with the western and southeastern points making up the ends of the arch and the northeastern points forming the midpoint (Fig. 3D). Thus, it appears that using any similarity index combined with PCoA does ameliorate the arch effect in this data set.
The final difference between the methods is that D and to some extent S compress the points within each grouping. One way to quantify this difference is use the axis 1 and 2 scores to compute nearest neighbor differences for the samples. The median values are respectively 0.0510, 0.0470, and 0.0406 in the F′, S, and D plots. The F′-based values are significantly higher than the S- and D-based values according to a paired two-sample Wilcoxon test (P=0.0534, 0.0036).
This compression within the PCoA space cannot be attributed in a simple way to compression of similarity values that is demonstrated by simulations (Alroy 2015). The reason is that D should overestimate the dissimilarity of neighboring points in the ordinations, which should spread them out. A better explanation is that D is more badly fooled by uneven sample sizes (Figs. 1, 2) and therefore pushes the northeastern small mammal assemblages farther out, which in turn compresses the rest of the ordination space (given the way PCoA works). If correct, this explanation again suggests that D has bigger problems than simple compression.
Combined Pleistocene and Recent Faunal Analysis
Given that unequal sample size is the main topic of concern here, a very strong test of the Forbes coefficient would be to add large samples to the analysis. If the method is robust in the way that is suggested by the simulations (Figs. 1, 2), then large samples should fall in biologically reasonable locations. If not, then they should cluster together. Just such an analysis is made possible by the fact that virtually complete mammalian species lists for North American biomes have been presented by Brown and Nicoletto (Reference Brown and Nicoletto1991).
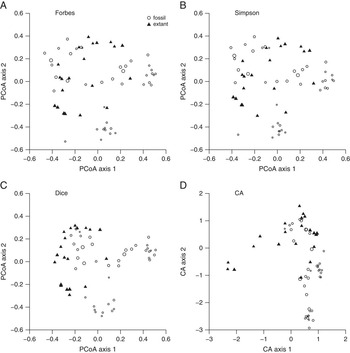
Adding the biome lists and subtracting the extinct species from the fossil lists shows that as with the simulated data (Fig. 2) the Dice coefficient and CA are entirely misled by this newly synthesized data set’s huge variation in sample size (Fig. 4). D segregates the biome lists into an arc at one edge of the plot (near the western U.S. samples: compare Figs. 3C and 4C) whereas CA produces a straightforward arch that pushes most of the fossil data points onto one arm (Fig. 4D). Note that the biome lists have a median length of 68 species whereas the fossil lists have a median of 16. Thus, the poor performance of D and CA is indeed easily explained as an artifact of sampling.
Multivariate ordinations of combined data for Recent mammals found in Pleistocene fossil assemblages (open circles) and for mammals living today in North American biomes (closed triangles). Point sizes are proportional to body mass, as in Figure 3. A, PCoA with distances based on the adjusted Forbes index. B, PCoA based on the Simpson index. C, PCoA based on the Dice index. D, Correspondence analysis.

In principle, the Pleistocene samples and the biome lists might not mix together cleanly because some fossil assemblages bring together species not found today in the same places (i.e., are “disharmonious”). However, these species form a small minority and most Pleistocene assemblages are thought to represent current biomes (Graham et al. Reference Graham, Lundelius, Graham, Schroeder, Toomey, Anderson, Barnosky, Burns, Churcher, Grayson, Guthrie, Harington, Jefferson, Martin, McDonald, Morlan, Semken, Webb, Werdelin and Wilson1996). Indeed, the positions of the biome lists in the F′ plot (Fig. 4A) do make biogeographic sense: the grasslands biome falls squarely in the middle of the plot, the eastern forest biome is next to the northeastern samples, the western biome and fossil sample points are mixed together, the taiga and tundra samples fall between the western and northeastern U.S. samples, and the Mexican biomes fall in between the western and southeastern samples at the bottom of the plot.
Patterns in the S-based ordination (Fig. 4B) are highly similar to those in the F′ plot (Fig. 4A), raising the question of whether S is just as good as F′. This question is easily dismissed by noting five things. First, the simulated cluster analyses show that S exaggerates differences between nearly identical samples (Fig. 2). Second, two-sample simulations (Alroy 2015) suggest that S is categorically downward-biased, so regardless of its performance in a cluster analysis or ordination the actual raw values are suspect. Third, F′ includes terms explicitly intended to account for sample size (eq. 2) and S does not. Fourth, S ignores the richness of the larger sample, and it seems counterintuitive to assume that this value includes no biologically useful information at all. Finally and most importantly, S is a ratio of just two numbers and is therefore subject to high binomial error.
Discussion
The choice of analytical methods in paleoecology is extremely complex, and no single recommendation could or should be taken to heart by all practitioners. Nonetheless, the difference in performance between the adjusted Forbes index and its rivals is rather pronounced in the current analysis (Figs. 1–4). For example, although the Simpson index is clearly adequate for recovering patterns in the Pleistocene data set (Figs. 3, 4) it is clearly inadequate when patterns are more challenging (Figs. 1, 2). The Forbes index’s theoretical properties also seem to be very robust (Alroy Reference Alroy2015), whereas the Simpson index rather uncomfortably throws out one of the three underlying counts used by all other metrics.
In sum, it is not really clear how the ordination and cluster analysis results could be more intuitive or seem to be less biased: use of the modified Forbes index really does seem to solve major problems with sampling. Nonetheless, some options need to be mentioned. One of them is DCA. There is good agreement among ecologists (Legendre and Gallagher Reference Legendre and Gallagher2001) that sample data should not be subjected to principal components analysis (PCA), that the family of correspondence analysis methods is more appropriate, and that DCA is an improvement on basic CA (Gauch Reference Gauch1982; Holland et al. Reference Holland, Miller, Meyer and Dattilo2001). Indeed, regardless of how the underlying data are transformed PCA in particular will routinely produce a strong arch, and it often produces an arch so severe that the endpoints fold back into the middle of the first axis (i.e., a horseshoe effect [see Legendre and Gallagher Reference Legendre and Gallagher2001]). The arch effect is certainly the main concern of theorists working in this area, and DCA does remove it.
There are, however, reasons to believe that metric multidimensional scaling (i.e., PCoA) and NMDS are even better than DCA (Bush and Brame Reference Bush and Brame2010). PCoA certainly does seem to work when it is applied to the simulated data and based on Forbes distances (Fig. 2A). However, it must be emphasized that scaling methods are only as good as the underlying similarity metrics they use. To be specific, PCoA based on the Euclidean distance replicates PCA whereas PCoA based on the chi-square distance replicates CA (Digby and Kempton Reference Digby and Kempton1987). These two metrics and all of the older binary similarity coefficients fail exactly because they compress similarity values and therefore distance values (Alroy Reference Alroy2015). Far from being ad hoc or heuristic, using F′ in combination with PCoA (Fig. 2A) is therefore entirely reasonable on theoretical grounds and preferable on practical grounds.
The arch effect does have more to do with the presence of zero similarities than with the compression of non-zero similarities by biased metrics (Gauch Reference Gauch1982). The test data sets used in this paper do produce an arch effect when a conventional method is used (Figs. 3D, 4D) and do include a good number of zero similarities, so there are reasons to believe that combining F′ with PCoA will in general often eliminate the need to take drastic measures to remove the arch effect. However, if there are still concerns about zero similarities then a reasonable option would be to alter the data by using either of the related step-across and extended similarity methods (Williamson Reference Williamson1978; De’ath Reference De’ath1999). I have not done so here strictly in order to keep the analyses simple and thereby guarantee that any differences in performance among the methods really do stem from their intrinsic properties.
Acknowledgments
The author is the recipient of an Australian Research Council Future Fellowship (project number FT0992161). M. Clapham, D. Polly, and two anonymous reviewers are thanked for helpful comments.