Introduction
Data on prevalence of obesity in populations are based on surveys in which the people questioned are asked about their body weight without it being measured directly. Numerous studies have shown that these statements show systematic bias: many respondents report a weight closer to the socially desirable weight than to their actual weight (Rowland, Reference Rowland1990; Plankey et al., Reference Plankey, Stevens, Fiegal and Rust1997; Hill & Roberts, Reference Hill and Roberts1998; Brener et al., Reference Brener, McManus, Galuska, Lowry and Wechsler2003; Stommel & Schoeborn, Reference Stommel and Schoenborn2009; Uhrig, Reference Uhrig2011). This bias increases with higher body weights (Stewart, Reference Stewart1982; Ziebland et al., Reference Ziebland, Thorogood, Fuller and Muir1996; Boström & Diederichsen, Reference Boström and Diderichsen1997; Lawlor et al., Reference Lawlor, Bedford, Taylor and Ebrahim2002; Spencer et al., Reference Spencer, Appleby, Davey and Key2002; Taylor et al., Reference Taylor, Dal Grande, Gill, Chittleborough, Wilson and Adams2006), which has enormous consequences when estimating the incidence of obesity in populations and its relationship with morbidity (Yannakoulia et al., Reference Yannakoulia, Panagiotakos, Pitsavos and Stefanadis2006; Gorber et al., Reference Gorber, Tremblay, Moher and Gorber2007).
An alternative, which uses the North American National Health and Nutrition Examination Survey, is to directly measure weight and height. However, this approach is not always feasible due to the increased costs involved. In addition, selection bias increases: more people are refusing direct measurement – ranging between one-third and half of the sample – and refusal increases among the heaviest population (Elgar & Stewart, Reference Elgar and Stewart2008; Shields et al., Reference Shields, Gorber and Tremblay2008; Park et al., Reference Park, Mitrou, Keogh, Luben, Wareham and Khaw2011; Shiely et al., Reference Shiely, Hayes, Perry and Kelleher2013; Stommel & Osier, Reference Stommel and Osier2013).
Another alternative would be to search for characteristics in the structure of the responses to health surveys that would serve as indicators of the magnitude of the social desirability bias, which would allow the evaluation of the quality of the data without increasing costs or selection bias; in addition, it would make it possible to evaluate retrospective data and make historical comparisons regarding the magnitude of the bias.
The rounding of weights to 0 or 5 in answers can be a good candidate as an indication of bias. Initially used to evaluate the quality of demographic data (Kannisto, Reference Kannisto, Jeune and Vaupel1999; Jdanov et al., Reference Jdanov, Jasilionis, Soroko, Rau and Vaupel2008), rounding (or digit preference) has been found in self-reported measures, such as height (Rowland, Reference Rowland1990; Bopp & Faeh, Reference Bopp and Faeh2008), age at menopause (Crawford et al., Reference Crawford, Johannes and Stellato2002) or duration of breastfeeding (Akin et al., Reference Akin, Bilsborrow, Guilkey and Popkin1986), in retrospective studies of fertility (Ridout & Morgan, Reference Ridout and Morgan1991) and in measurements taken by medical professionals, such as blood pressure (Hessel, Reference Hessel1986; Wen et al., Reference Wen, Kramer, Hoey, Hanley and Usher1993; Nietert et al., Reference Nietert, Wessell, Feifer and Ornstein2006).
Several studies have found an association between rounding in reported body weight and social desirability bias: rounding is more likely and of greater magnitude among those who report a weight closer to their socially desirable weight than their actual weight (Stewart, Reference Stewart1982). This is more prevalent in people who are overweight or obese: they report less than their actual weight by rounding down to the closest digit ending in 0 or 5 (Stewart, Reference Stewart1982; Rowland, Reference Rowland1990; Niedhammer et al., Reference Niedhammer, Bugel, Bonenfant, Goldberg and Leclerc2000; Shields et al., Reference Shields, Gorber and Tremblay2008). This relationship between bias and digit preference has been shown to be higher in women and when rounding to zero (Stewart, Reference Stewart1982; Rowland, Reference Rowland1990; Niedhammer et al., Reference Niedhammer, Bugel, Bonenfant, Goldberg and Leclerc2000).
The objective of this study was to estimate whether rounding of the stated weight can be used as an indicator of the magnitude of social desirability bias in this statement. To this end, the characteristics of rounding were compared with those of social desirability bias in reported body weight: if the patterns are similar, rounding could be considered as an indication of social desirability bias.
Methods
Data
Data from seven waves of the National Health Survey of Spain (ENSE) for the years 1995, 1997, 2001, 2003, 2006, 2012 and 2017 were used. The sample size varied: in 1995 and 2001, it was 6400 subjects, and in the remaining five waves, it was between 22,000 and 28,000 subjects over 18 years old. Mean age of participants increased from 43 years in 1995 to 53 in 2017, and by gender, there was a slightly greater percentage of women in every wave, according to the Spanish population structure.
All interviews were house-to-house, and data collection was done by a team of professional interviewers of the National Institute of Statistics of Spain.
Measures and instruments
The primary variable of interest was self-reported body weight, obtained by the question ‘What is your weight (in kilograms, no decimals)?’, which is standard for all waves in the survey. The response rate ranged between 93.8% and 98.6%, which is very high with respect to the majority of studies, in which it was between 57 and 80% (Boström & Diederichsen, Reference Boström and Diderichsen1997; Brener et al., Reference Brener, McManus, Galuska, Lowry and Wechsler2003; MacLellan et al., Reference MacLellan, Taylor, Van Til and Sweet2004; Elgar & Stewart, Reference Elgar and Stewart2008; Shields et al., Reference Shields, Gorber and Tremblay2008).
To estimate whether digit preference or rounding followed the same trends as social desirability bias, two operations were conducted. First, the amount of rounding was estimated as a function of body weight: given that social desirability bias occurs in the lowest weights and, more so, in the highest weights, if rounding follows the same pattern, it would also be found to a greater extent in both the lowest and highest weights. Second, whether rounding occurred when declaring a more socially desirable weight than declaring the actual weight was estimated. For this, the Weight Heaping Index (WHI) was used. This index is an adaptation for self-reported weights ending in 0 and 5 of the Indirect Heaping Index proposed by Kannisto (Reference Kannisto, Jeune and Vaupel1999) for ages.
 ${\rm{WH}}{{\rm{I}}_i} = \scale 110%{{{p_i}} \over {\exp \left( {{1 \over 5}\mathop \sum \nolimits_{x = i - 2}^{i + 2} \ln \,({p_x})} \right)}}$
where i = weight ending in 0 or 5, and p i = number of subjects with weight i. This index takes the weight ending in 0 or 5 (i) and compares its frequency with the four nearest weights (e.g. weight rounded to 80 kg, compared with 78, 79, 81 and 82 kg).
In addition, Weight Partial Heaping Indices (WPHI) were created to measure whether the rounding was up (assuming more than the actual weight was reported) or down (assuming less than the actual weight was reported). Thus, it was possible to estimate at what weights, and in which direction the bias was produced.
 $\hskip 24{\rm{WPH}}{{\rm{I}}_i}\,{\rm{up}} = \scale 120%{{{p_i}} \over {\exp \left( {{1 \over 3}\mathop \sum \nolimits_{x = i-2}^{i } \ln \,\left( {{p_x}} \right)} \right)}}$
 $${\rm{WPH}}{{\rm{I}}_i}\,{\rm{down}} = \scale 90%{{{p_i}} \over {\exp \left( {{1 \over 3}\mathop \sum \nolimits_{x = i}^{i + 2} \ln \,\left( {{p_x}} \right)} \right)}}$$
where i = weight ending in 0 or 5, and p i = number of subjects with weight i. In this case, both partial indexes only take into account three weights: the rounded one, i, and the nearest two up or down (e.g. WPHI up, i = 80 kg, compared with 78 kg and 79 kg; WPHI down, i = 80 kg, compared with 81 kg and 82 kg).
It was assumed that this index well estimated the direction of rounding because most biases are of a magnitude less than 2 kg (Stewart, Reference Stewart1982; Rowland, Reference Rowland1990; Boström & Diederichsen, Reference Boström and Diderichsen1997; Hill & Roberts Reference Hill and Roberts1998; Niedhammer et al., Reference Niedhammer, Bugel, Bonenfant, Goldberg and Leclerc2000; Lawlor et al., Reference Lawlor, Bedford, Taylor and Ebrahim2002; Spencer et al., Reference Spencer, Appleby, Davey and Key2002; Shields et al., Reference Shields, Gorber and Tremblay2008; Park et al., Reference Park, Mitrou, Keogh, Luben, Wareham and Khaw2011).
To measure the existence of rounding, the criterion of Kannisto (Reference Kannisto, Jeune and Vaupel1999) was adopted: (<1.1), no rounding; (1.1–1.2), moderate rounding; (>1.2), extensive rounding. The index has neither a minimum nor a maximum range and there was not an associated golden standard.
To check in which direction there was greater rounding, a WPHI ratio between both partial indices was calculated:
 ${\rm{WPHI}}\,{\rm{ratio}} = {{{\rm{WPH}}{{\rm{I}}_i}\,{\rm{up}}} \over {{\rm{WPH}}{{\rm{I}}_i}\,{\rm{down}}}}$
When the ratio was <1, there was a greater proportion of rounding down; when the ratio was >1, the proportion of rounding up was higher.
Analysis instruments
Two types of digit preference comparisons by gender and weight were performed for all waves of the ENSE. On the one hand, the preference of digits 0 and 5 in each tenth unit of weight was compared. On the other hand, the differences between rounding up and rounding down were compared using the rounding ratio.
Results
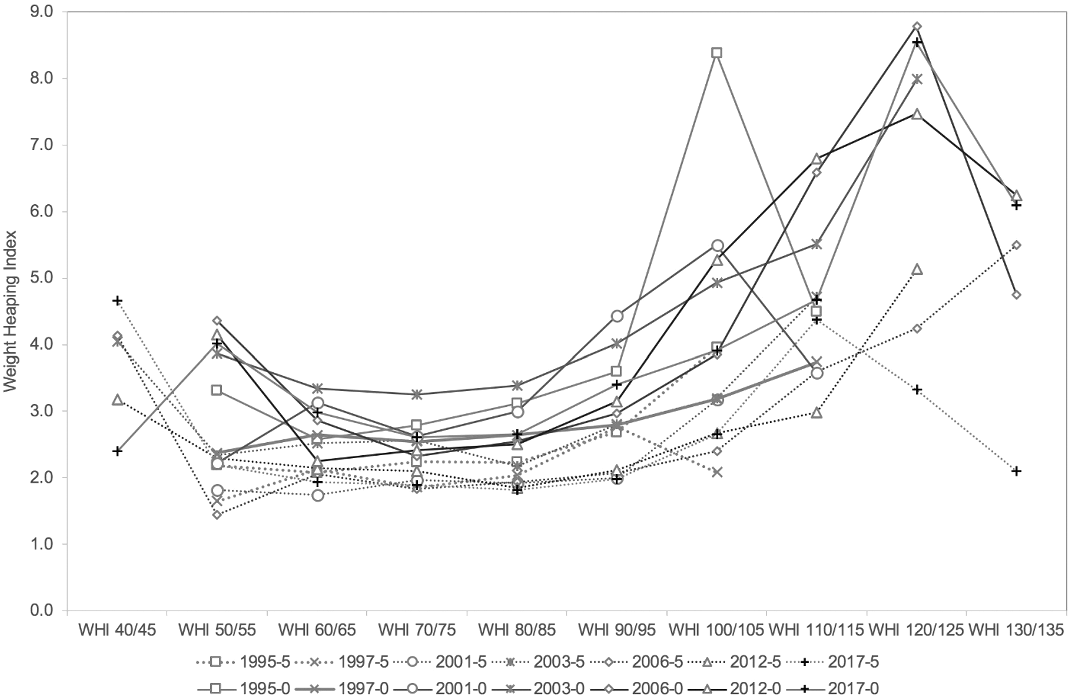
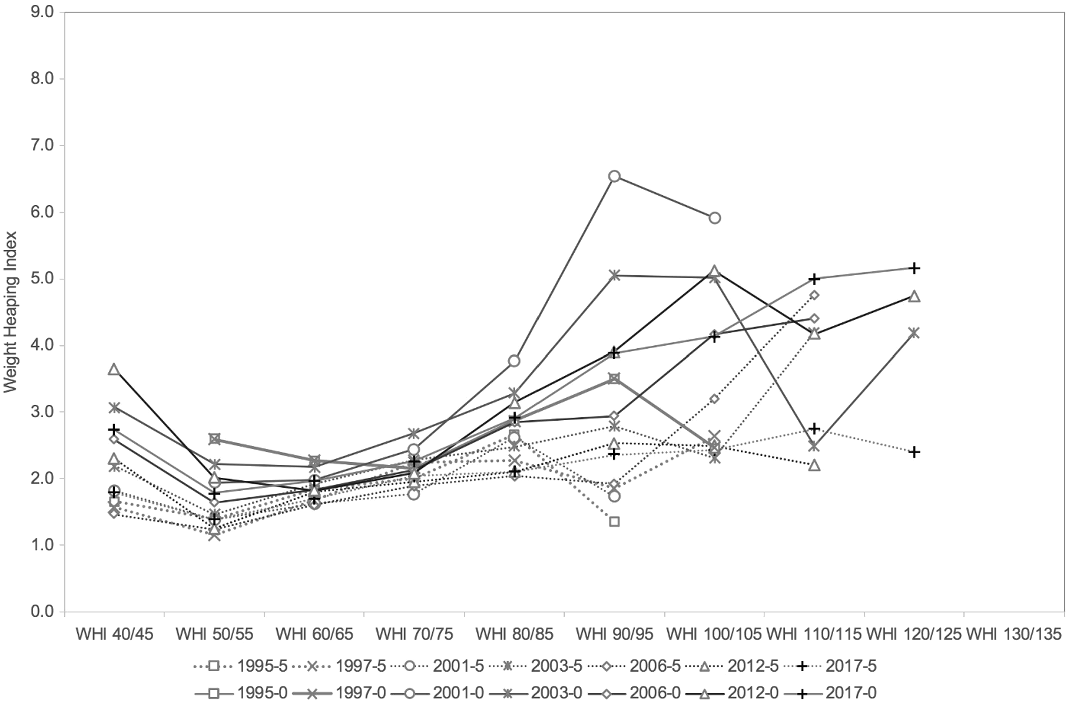
In the period 1995–2017, the mean self-reported weight increased 4.5% throughout the period (6.3% for men, 4.8% for women). Weights ending in 0 or 5 represented approximately 40% of the total in all surveys, double what it would be in the absence of rounding. In practically all the surveys, and for all weights, the WHI was higher than 1.2, indicating a noteworthy proportion of rounding (Figures 1 and 2).
Weight Heaping Index (WHI) for men, 1995–2017. Each line represents a wave of the survey. The horizontal axis represents the rounded weights at 0 or 5 (e.g. 1995-0 refers to the 1995 wave, rounding to 0, solid lines) or 5 (e.g. 1995-5 refers to the 1995 wave, rounding to 5, dotted lines). The vertical axis represents the WHI for each weight. The figure shows that the rounding – measured by the WHI – is bigger at the heaviest weights.

Weight Heaping Index (WHI) for women, 1995–2017. Each line represents a wave of the survey. The horizontal axis represents the rounded weights at 0 or 5 (e.g. 1995-0 refers to the 1995 wave, rounding to 0, solid lines) or 5 (e.g., 1995-5 refers to the 1995 wave, rounding to 5, dotted lines). The vertical axis represents the WHI for each weight. The figure shows that the rounding – measured by the WHI – is bigger in the lightest and heaviest weights.
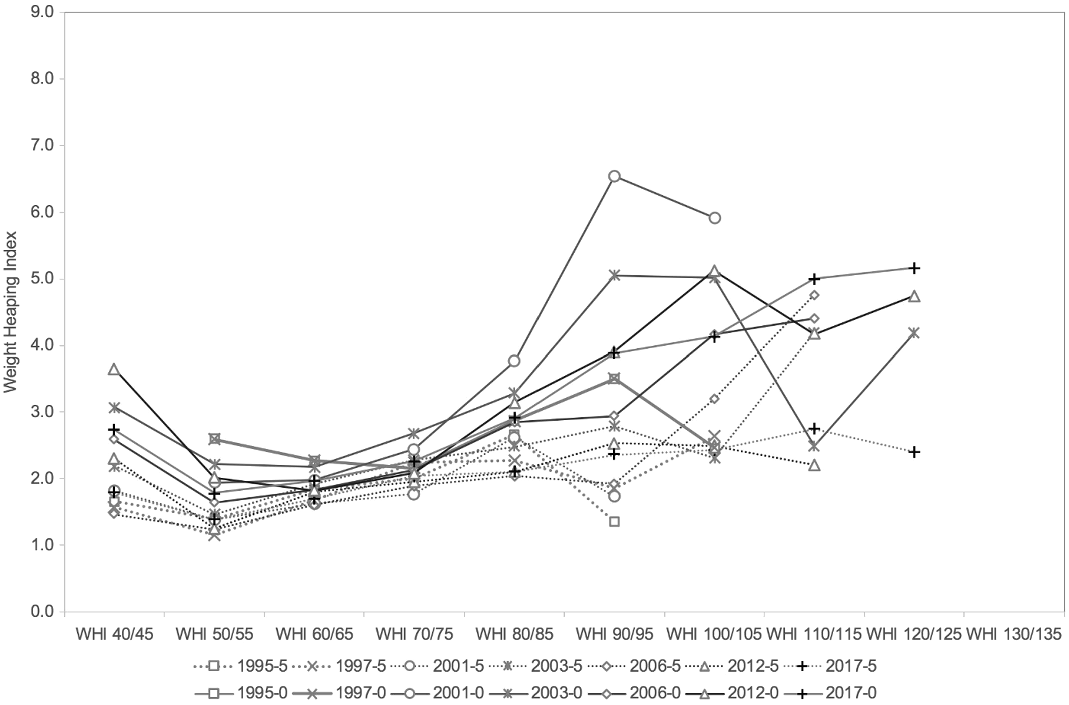
The analysis of the distribution of self-reported weights ending in 0 and 5 by the WHI showed that the digit preference systematically increased with weight, with a greater use of weights ending in zero. This trend was repeated in all surveys and for both genders, with a higher level of rounding among men (Figures 1 and 2).
For lower weights, the WHI was slightly higher than that for average weights, for both men and women. In addition, this index was clearly higher among men. For average weights, the WHI was lower. It began to increase for 70–80 kg men and 60–70 kg women, reaching maximum values for 100–135 kg men and 90–130 kg women. The heaping index almost always reached the maximum before reaching the maximum weight – in other words, although it showed a steady increase at higher weights, the pattern changed for extreme weights.
In men, rounding to zero peaked at 120 kg in almost all surveys (except in 1995 and 2001: 100 kg). Additionally, rounding to five continued to increase with body weight in almost all survey waves (except in 1997 and 2017). In women, the cases were more varied: the maximum levels of rounding occurred for weights between 90 and 130 kg, although most of the rounding was not as pronounced.
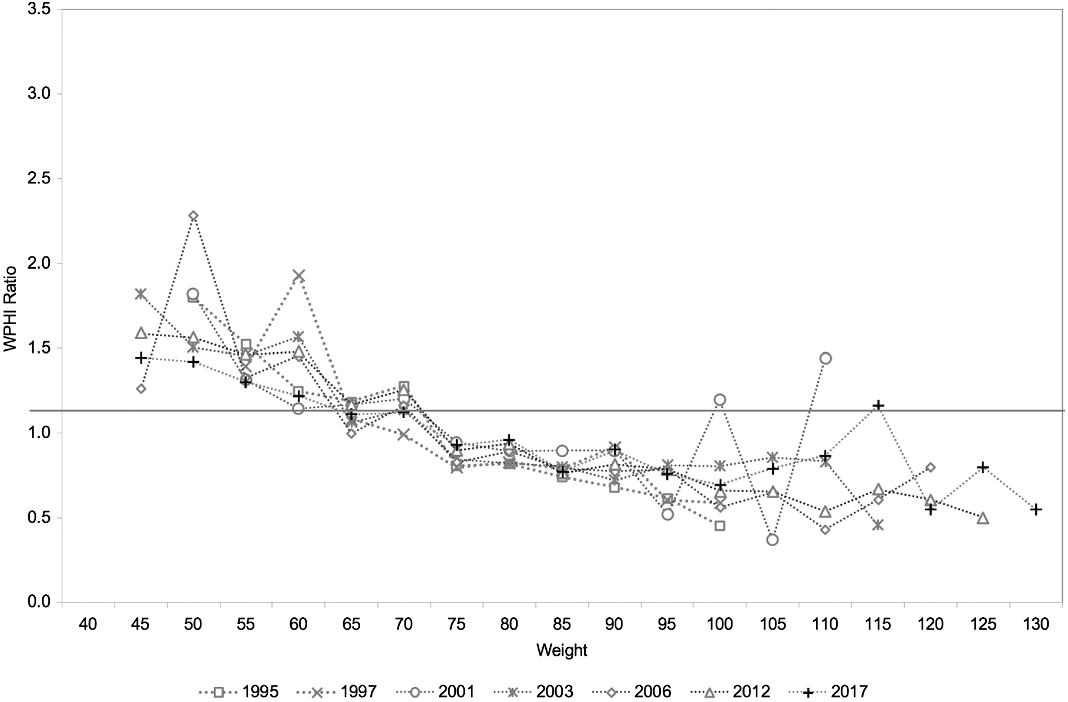
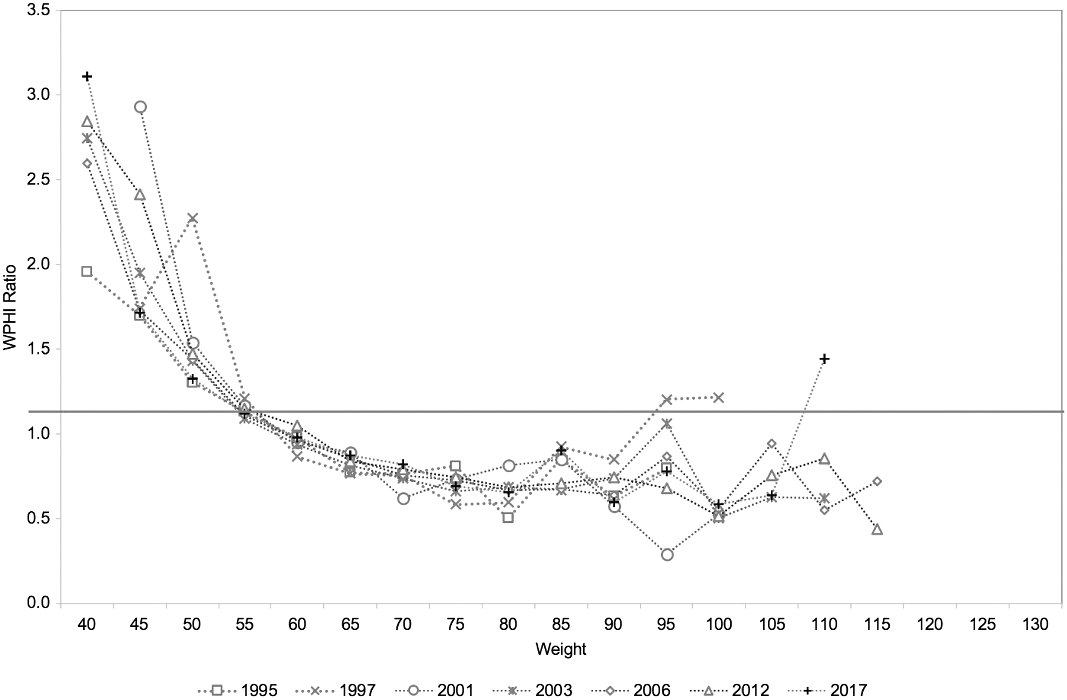
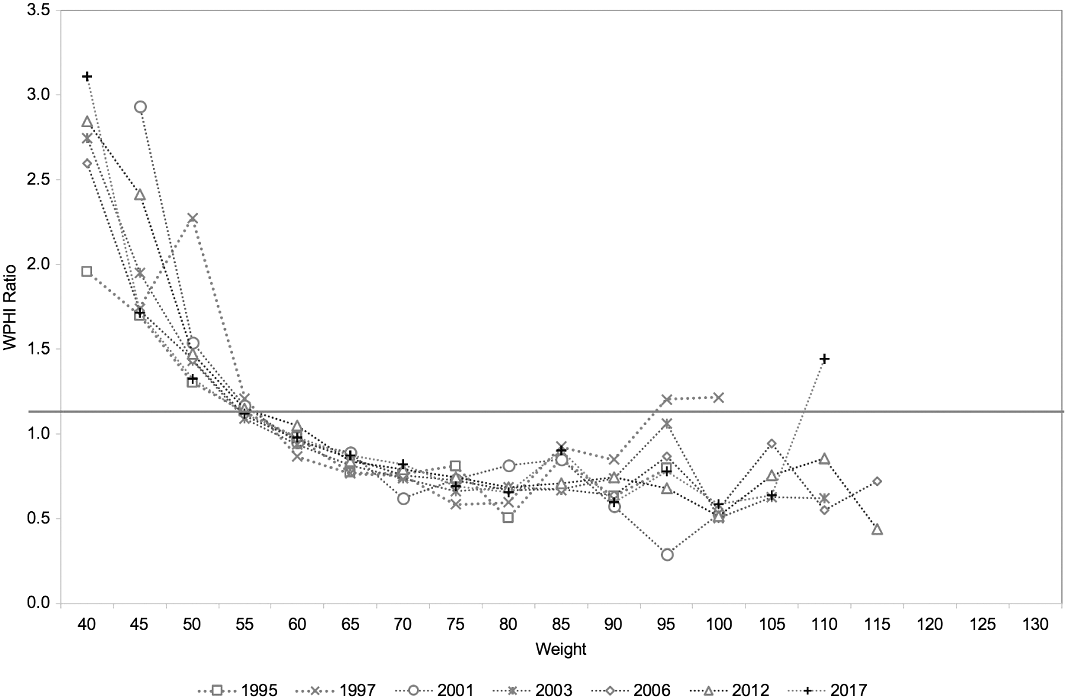
The WPHI allowed whether the digit preference was up or down to be determined. There was a greater tendency to round up for lower weights and round down for higher weights; this trend increased at the extremes of the weight distribution. The main difference between men and women was in the threshold at which rounding down predominated: at approximately 60 kg in women and 70 kg in men. Outliers appeared for the extreme weights in the distribution, probably due to a smaller sample size and, in the case of higher weights, to a greater magnitude of bias in the reported weight (Figures 3 and 4).
Weight Partial Heaping Index (WPHI) ratio (up/down) for men, 1995–2017. The horizontal axis represents the rounded weights. The vertical axis represents the WPHI Ratio: when WPHI>1, it means that, for the body weight in the horizontal axis, there is a greater proportion of people rounding up than rounding down; when WPHI<1, there is a greater proportion of people rounding down. The graphic shows that at the lightest weights there is a greater proportion of rounding up and at the heaviest weights a greater proportion of rounding down.
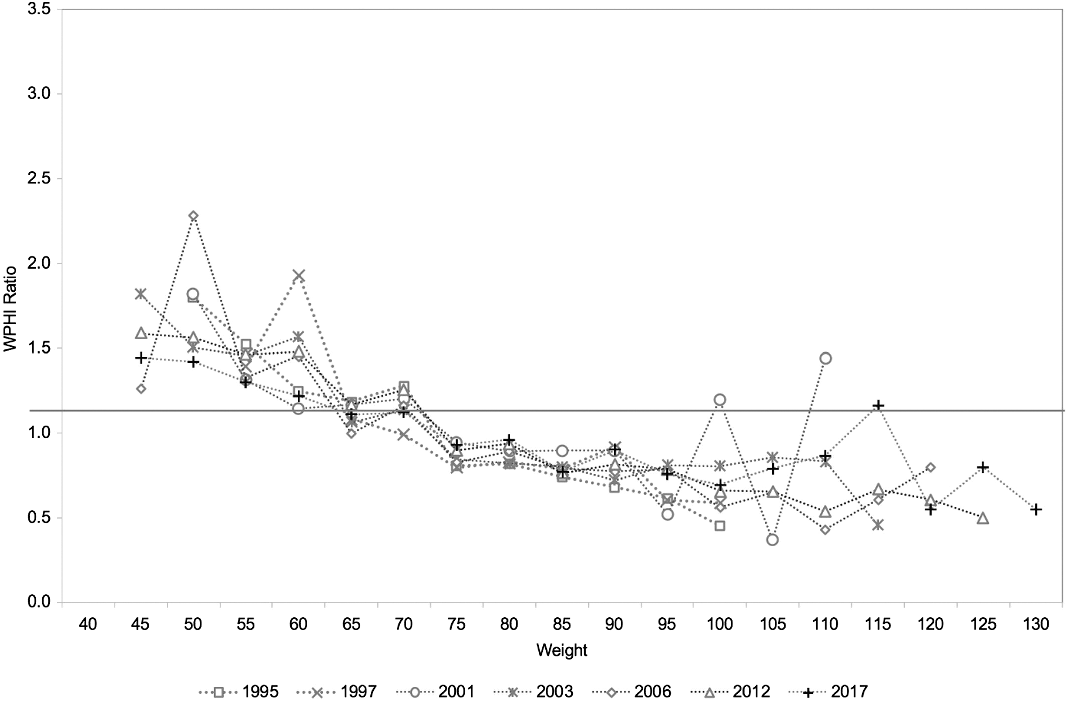
Weight Partial Heaping Index (WPHI) ratio (up/down) for women, 1995–2017. The horizontal axis represents the rounded weights. The vertical axis represents the WPHI Ratio: when WPHI>1, it means that, for the body weight in the horizontal axis, there is a greater proportion of people rounding up than rounding down; when WPHI<1, there is a greater proportion of people rounding down. The graphic shows that at the lightest weights there is a greater proportion of rounding up and at the heaviest weights a greater proportion of rounding down.
Discussion
To the authors’ knowledge, this is the first study in Spain that has analysed rounding as an indicator of bias in the reporting of body weight. The results of the analysis of self-reported weights in the ENSE from 1995 to 2017 showed a systematic preference for 0 or 5 as the final digit and more pronounced rounding among men and for those with higher weights.
Can rounding serve as an indicator of social desirability bias in the reporting of body weight? To answer this question, it is important to indicate that rounding may be due not only to social desirability bias but also to another alternative cause: the respondent does not know their exact weight and gives an approximate answer (Taylor et al., Reference Taylor, Dal Grande, Gill, Chittleborough, Wilson and Adams2006). If the latter were the predominant reason, rounding would serve as an indicator of the quality of the responses, not of social desirability bias.
To test the two hypotheses (the distribution and direction of rounding), if rounding followed patterns similar to social desirability bias in reported body weight, the hypothesis that rounding is predominantly due to social desirability bias would be supported. For distribution, various studies on biases in reported body weight have shown a coinciding pattern: in weights that are far from socially desirable, a weight closer to socially desirable is reported (Stewart, Reference Stewart1982; Rowland, Reference Rowland1990; Ziebland et al., Reference Ziebland, Thorogood, Fuller and Muir1996; Plankey et al., Reference Plankey, Stevens, Fiegal and Rust1997; Niedhammer et al., Reference Niedhammer, Bugel, Bonenfant, Goldberg and Leclerc2000; Lawlor et al., Reference Lawlor, Bedford, Taylor and Ebrahim2002; Spencer et al., Reference Spencer, Appleby, Davey and Key2002; Ezzati et al., Reference Ezzati, Martin, Skjold, van der Hoorn and Murray2006; Taylor et al., Reference Taylor, Dal Grande, Gill, Chittleborough, Wilson and Adams2006; Shields et al., Reference Shields, Gorber and Tremblay2008; Gorber & Tremblay, Reference Gorber and Tremblay2010; Park et al., Reference Park, Mitrou, Keogh, Luben, Wareham and Khaw2011). This pattern occurred for very low weights (it was rounded up, especially for men) and, to a much greater extent, for higher weights, with the bias increasing as body weight increases.
For direction, if rounding is due to social desirability bias, lower weights would be rounded up and higher weights would be rounded down. In contrast, if rounding is due to not knowing one’s own body weight – without desirability bias – one would expect to find a similar number of rounding up and down for the different body weights.
The findings indicate that digit preference is largely related to social desirability bias. First, the distribution for rounding followed the same pattern as social desirability bias. For both genders, the Weight Heaping Index was lower for average weights and higher for lower weights and, even more so, for higher weights. The only datum that would challenge this interpretation was the sharp decrease in the WHI for some extreme values. However, these swings for higher weights coincided with the fact that bias usually increases in number of kilos as body weight increases (Stewart, Reference Stewart1982; Rowland, Reference Rowland1990; Hebert et al., Reference Hebert, Clemow, Pbert, Ockene and Ockene1995; Ziebland et al., Reference Ziebland, Thorogood, Fuller and Muir1996; Böstrom & Diederichsen, Reference Boström and Diderichsen1997; Plankey et al., Reference Plankey, Stevens, Fiegal and Rust1997; Hill & Roberts, Reference Hill and Roberts1998; Spencer et al., Reference Spencer, Appleby, Davey and Key2002; Taylor et al., Reference Taylor, Dal Grande, Gill, Chittleborough, Wilson and Adams2006; Elgar & Stewart, Reference Elgar and Stewart2008; Shields et al., Reference Shields, Gorber and Tremblay2008; Uhrig, Reference Uhrig2011), which would cause these decreases: with very high weights, under-reporting could be greater than 5 and even 10 kg (Ziebland et al., Reference Ziebland, Thorogood, Fuller and Muir1996; Shields et al., Reference Shields, Gorber and Tremblay2008). This interpretation was reinforced by another datum: rounding to zero was clearly more common than rounding to five, especially for higher weights; for average weights, the differences were small or, in women, non-significant. This implies that there should be an appreciable percentage of cases in which rounding resulted in under-reporting weight by 6 kg or more.
Second, the Weight Partial Heaping Index ratio results also supported the examined hypotheses. For both men and women, the WPHI ratio approached 1 for the middle weights, while there was more rounding up for lower weights and rounding down for higher weights (see Figures 3 and 4). Some outliers also appeared for the extreme values, although lower than expected. In effect, the WPHI, when measuring the distribution in the two values closest to 0 and 5, ceases to be relevant when the biases assume a deviation higher than 2 kg – a frequent case in the higher weights (Stewart, Reference Stewart1982; Rowland, Reference Rowland1990; Hebert et al., Reference Hebert, Clemow, Pbert, Ockene and Ockene1995; Ziebland et al., Reference Ziebland, Thorogood, Fuller and Muir1996; Boström & Diederichsen, Reference Boström and Diderichsen1997; Plankey et al., Reference Plankey, Stevens, Fiegal and Rust1997; Hill & Roberts, Reference Hill and Roberts1998; Spencer et al., Reference Spencer, Appleby, Davey and Key2002; Elgar & Stewart, Reference Elgar and Stewart2008; Shields et al., Reference Shields, Gorber and Tremblay2008; Uhrig, Reference Uhrig2011).
Third, the trends were similar for men and women, except for one difference: men rounded up more than women across the weight range. This suggests that the reported weight by men included, to a greater extent than that reported by women, greater rounding due to lack of knowledge of actual weight. This would explain why male rounding was much higher than that of female rounding for average weights and would agree with the results of other studies, which indicate a greater relationship between rounding and social desirability bias in women (Stewart, Reference Stewart1982; Rowland, Reference Rowland1990; Hebert et al., Reference Hebert, Clemow, Pbert, Ockene and Ockene1995; Boström & Diederichsen, Reference Boström and Diderichsen1997; Niedhammer et al., Reference Niedhammer, Bugel, Bonenfant, Goldberg and Leclerc2000; Brener et al., Reference Brener, McManus, Galuska, Lowry and Wechsler2003; Taylor et al., Reference Taylor, Dal Grande, Gill, Chittleborough, Wilson and Adams2006; Elgar & Stewart, Reference Elgar and Stewart2008; Shields et al., Reference Shields, Gorber and Tremblay2008; Stommel & Schoeborn, Reference Stommel and Schoenborn2009; Gorber & Tremblay, Reference Gorber and Tremblay2010; Uhrig, Reference Uhrig2011), correlated to their greater concern for body weight (Sobal & Stunkard, Reference Sobal and Stunkard1989; Germov & Williams, Reference Germov and Williams1996), although other studies have not found this result (Hill & Roberts, Reference Hill and Roberts1998; Spencer et al., Reference Spencer, Appleby, Davey and Key2002; Shields et al., Reference Shields, Gorber and Tremblay2008).
The results were consistent with other research: there was a strong relationship between rounding and social desirability bias, and rounding to zero was greater than rounding to five (Stewart, Reference Stewart1982; Rowland, Reference Rowland1990; Niedhammer et al., Reference Niedhammer, Bugel, Bonenfant, Goldberg and Leclerc2000; Shields et al., Reference Shields, Gorber and Tremblay2008). The main difference was that the presented results did not show such a robust difference between men and women as did other studies in which only female rounding was related to social desirability, while men rounded both upward and downward due to not knowing their weight accurately (Rowland, Reference Rowland1990; Shields et al., Reference Shields, Gorber and Tremblay2008).
In conclusion, the two main presented results support the hypothesis of a strong relationship between rounding and social desirability bias. This relationship is consistent with other data compiled by other research: although bias affects a significant proportion of the people surveyed, most report a weight that deviates very little from the actual weight (Stewart, Reference Stewart1982; Rowland, Reference Rowland1990; Boström & Diederichsen, Reference Boström and Diderichsen1997; Spencer et al., Reference Spencer, Appleby, Davey and Key2002; Taylor et al., Reference Taylor, Dal Grande, Gill, Chittleborough, Wilson and Adams2006; Basterra-Gortarri et al., Reference Basterra-Gortari, Bes-Rastrollo, Forga, Martínez and Martinez-Gonzalez2007; Elgar & Stewart, Reference Elgar and Stewart2008; Shields et al., Reference Shields, Gorber and Tremblay2008; Park et al., Reference Park, Mitrou, Keogh, Luben, Wareham and Khaw2011; Uhrig, Reference Uhrig2011). Rounding would allow a trade-off between the two opposing principles that govern the dynamics of lying and self-delusion (Ariely, Reference Ariely2012): on the one hand, people lie (to others and to themselves) to obtain benefits or portray a better self-image; on the other hand, people tend to see themselves as honest people. Rounding would allow combining both aims: people would not be ‘truly’ distorting their weight, only ‘rounding’.
These results show that rounding could be a good indicator of social desirability bias. Now, what index should be used? The results indicate two alternatives. The first would be a Total Heaping Index for each survey, i.e. Whipple’s Index (Spoorenberg & Dutreuilh, Reference Spoorenberg and Dutreuilh2007). This type of index has the advantage of its simplicity. In contrast, it would not correctly differentiate rounding based on social desirability bias due to lack of knowledge of exact weight – which may be higher among men and for those with average weights. The second would be to take the WHI in cases of lower weights and, above all, in cases of weights higher than those deemed socially desirable. Here, due to lack of knowledge of real weight, the cases of rounding decreased, as shown by the WPHI ratio. The problem would lie in determining the ranges of body weight that would be included in the measure and that could vary geographically and temporally. In any case, this index should be combined with the rate of non-response to the question on body weight, as this is also more likely to happen with heavier people (Elgar & Stewart, Reference Elgar and Stewart2008; Shields et al., Reference Shields, Gorber and Tremblay2008).
In conclusion, the Weight Heaping Index as an indicator of social desirability bias could present three advantages over surveys that, after asking about weight, measure it directly. First, the selection bias of the surveys in which weight is directly measured would be avoided. Second, it would allow the estimation of bias in past surveys: it could be a valuable tool for comparing the temporal evolution of bias, an increasingly important topic in discussions on the evolution of obesity rates (Ezzati et al., Reference Ezzati, Martin, Skjold, van der Hoorn and Murray2006; Shields et al., Reference Shields, Gorber and Tremblay2008; Gorber & Tremblay, Reference Gorber and Tremblay2010; Hattori & Sturm, Reference Hattori and Sturm2013; Shiely et al., Reference Shiely, Hayes, Perry and Kelleher2013; Stommel & Osier, Reference Stommel and Osier2013). Finally, it would not increase the costs of conducting a survey.
This study had three limitations. First, in the absence of a direct measurement of weight, it was not possible to compare self-reported weight with direct measures. Second, although the expounded results are coherent with a correspondence between social desirability bias and rounding, there are no objective measures of this kind of bias. Future research could overcome this limitation using the methods contained in this article on data sets with both direct weighing and self-reported measures of weight. Third, the ENSE surveys had different sample sizes, which prevented the following of different cohorts and estimation of the change in bias as their sociodemographic variables changed. However, this second limitation represents a starting point for future research in which differences in digit preference are studied as a measure of bias by other variables, such as age, body mass index, diet and education level. Information by population segments could be obtained by proposing specific recommendations for the control of body weight, with its subsequent implications for nutrition and health.
Practical implications
Good information about the social distribution and evolution of obesity is very important for an efficient design of public policies against obesity. Since the social desirability bias is stronger among obese populations – defined as those whose body weight is far from the socially desirable – health surveys can give a flawed estimation of the social distribution and evolution of obesity. Information on rounding can be a very useful indicator of the magnitude of social desirability bias, thereby allowing a more accurate estimation of the distribution of obesity by age, sex and social groups. This provides more accurate information to design public policies against obesity aimed at the more affected social segments of a population.
Funding
This work was partially funded by grants number CSO2016-80908-R, from Spanish Ministry of Science, and PRY184/17, from Centro de Estudios Andaluces, Junta de Andalucía. The funders had no role in the design, analyses or writing of this article.
Conflicts of Interest
The authors have no conflicts of interest to declare.
Ethical Approval
The authors assert that all procedures contributing to this work comply with the ethical standards of the relevant national and institutional committees on human experimentation and with the Helsinki Declaration of 1975, as revised in 2008.