I. INTRODUCTION
Offshore and onshore installations are widely used to extract oil and gas requiring resistant materials to marine environments. The chloride content contained in seawater can cause pitting corrosion in offshore installations. Metal alloys extremely durable are needed especially in this type of installation. Among the materials used in the manufacture of plates and pipes are highlighted the 300 series austenitic stainless steels. Austenitic stainless steels are also widely used as components operating in high temperature ranges, such as boilers, super-heaters, chemical reactors, in flue gas desulfurization systems (FGD).Reference Kim, Oh and Chang1
Superaustenitic stainless steels, due to their increase in chromium (Cr) and molybdenum (Mo) content when compared with the 300 series austenitic stainless steels, have excellent resistance to localized corrosion. The pitting corrosion, which is one of the most harmful forms of corrosion, is very typical on metallic materials that form passive films. This results from the active–passive cell of the points where the passive layer breaks.Reference Stephen Tait2 The pitting corrosion is difficult to monitor and control, as it occurs in the interior of equipment and facilities. The loss of mass and thickness of materials subject to this form of corrosion do not characterize the wear observed.Reference Nunes3
When working with metal alloys at high temperatures, there is the precipitation of deleterious phases that can compromise the mechanical performance and their corrosion resistance.Reference Padilha and Rios4 The precipitation of sigma phase (σ) is a severe problem when using austenitic stainless steels at high temperatures. The amount of Cr and Mo improves the corrosion resistance of the metal alloys, but also causes instability in the austenitic matrix due to the formation of chromium-rich carbides and intermetallic phases that may arise in the material in processes involving high temperatures as in welding.
Therefore, the aim of this study was to evaluate and compare the pitting corrosion resistance of AL-6XN PLUS™ superaustenitic stainless steel and the 304L, 316L, and 317L austenitic stainless steels by electrochemical measurements in aqueous medium of 0.5 mol/L H2SO4 + 0.5 mol/L NaCl also evaluating the effect of heat treatments on pitting corrosion resistance.
II. EXPERIMENTAL PROCEDURE
A. Alloys
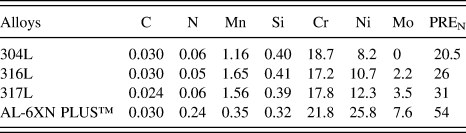
The alloys used in this study were the 304L, 316L, and 317L austenitic stainless steels and a superaustenitic stainless steel (AL-6XN PLUS™) provided by the North American company Allegheny Ludlum Corporation. Table I shows the composition of these alloys (in wt%). The chemical composition was measured in an optical emission spectrometer model Shimadzu PDA 7000 (Shimadzu Corporation, Kyoto, Japan). The values represent an average of three measurements. The pitting corrosion resistance number (PREN) is also showed in Table I. This index is a function of the elements Cr, Mo, and N according to Eq. (1) and represents the ability of the alloys to resist pitting corrosion in chloride-containing medium.5 AL-6XN PLUS™ superaustenitic alloy has the highest PREN among the others indicating its superiority to localized corrosion.
 $${\rm{PR}}{{\rm{E}}_{\rm{N}}}\, = \,\% {\rm{Cr}}\,{\rm{ + }}\,3.3\% {\rm{Mo}}\,{\rm{ + }}\,30\% {\rm{N}}\quad {\rm{.}}$$
Chemical composition of the studied alloys and PREN (wt%).

B. Heat treatments
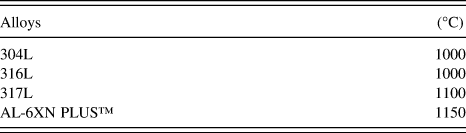
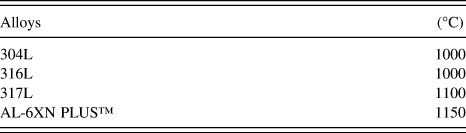
Firstly, a thermodynamic study was performed using the software Thermocalc® to predict the possible deleterious phases that could form during the heat treatments. As input it was used the chemical composition of each alloy and the temperature range was set to between 500 °C and 1200 °C. The software predicts the phases present at each studied temperature as well as their percentages. The database used for calculating the percentages of each phase was the TCFE6 database. Based on these simulations, the chosen temperature range was from 500 °C to 900 °C. This temperature range is considered as being of high temperatures for austenitic stainless steels.Reference Anburaj, Nazirudeen, Narayanan, Anandavel and Chandrasekar6Table II shows the solution annealing temperatures for all the studied alloys. The time used for the solution annealing was 30 min followed by water quenching. This first heat treatment had the goal to obtain only the matrix phase. After solution annealing, samples underwent heat treatments at 500 °C, 700 °C, and 900 °C for a period of 72 h followed by water quenching.
Solution annealing temperatures of the studied alloys according to the Thermocalc® simulation.
C. Characterization
After heat treatments, the samples were mounted in bakelite and ground with silicon carbide paper up to grade 1200. Furthermore, the samples were polished with diamond paste down to 1 µm for the acquisition of their surface micrographs. Sample sizes were on average of 5.8 mm × 5.5 mm × 3.3 mm. For the microstructural characterization of the samples the reagent used in the chemical etching was 10% oxalic acid. It also used the reagent 20% K(OH) in attempt to reveal phases such as sigma phase according to the literature.Reference Magnabosco7 A scanning electron microscope (SEM) and an optical microscope were used to obtain images of the samples surfaces after heat treatments.
D. Electrochemical corrosion tests
The corrosion resistance of the alloys was evaluated by potentiodynamic cyclic polarization technique according to the ASTM G61-86.8 A cell of three electrodes was used. The cell consisted of a silver silver chloride (Ag/AgCl/Cl−) saturated electrode as a reference electrode, a 93 mm2 platinum plate as an auxiliary electrode, and the samples used as working electrode. The work electrodes were manufactured by cutting the samples in a rectangular geometry shape of 37 mm2 and connected to a copper wire. After that, the samples were cured in an epoxy resin and then ground with silicon carbide paper up to 1200. The samples were also coated with a lacquer to reduce crevice corrosion on the epoxy/steel edges. A combination of 0.5 mol/L H2SO4 + 0.5 mol/L NaCl (pH = 0.76) in aqueous solution was used as electrolyte. With the combined action of these two substances, the effectiveness of the passive film could be evaluated. A potentiostat model Autolab (PGSTAT30 (Metrohm, Herisau, Swizterland)) connected to a microcomputer was used. The software General Purpose Electrochemical System was used for obtaining data from the cyclic polarization curves. The scanning of the polarization curves was from −0.4 V to +1.0 V for the superaustenitic steel and −0.5 V to +1.0 V for the 300 series austenitic steels. The scan rate used was 1 mV/s. After cyclic polarization tests, the samples were washed with distilled water and sprayed with alcohol for cleaning the surface. Micrographs of the samples surfaces were obtained after corrosion tests by SEM and optical microscopy for quantification of the pits. The cyclic polarization tests were performed in triplicate at room temperature (25 °C).
III. RESULTS AND DISCUSSION
A. Thermodynamic study
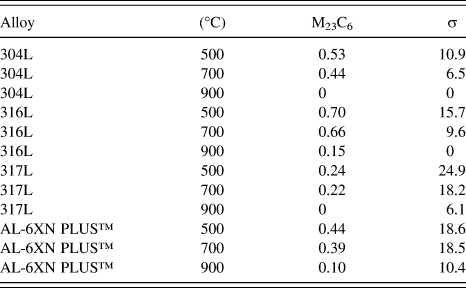
The phases of interesting to this work are listed in Table III. These phases were provided by the software Thermocalc®. Through these simulations, it was possible to predict the deleterious phases that might precipitate for the selected temperatures in the heat treatments (500 °C, 700 °C, and 900 °C). It was predicted the formation of sigma phase and carbides. The precipitation of these phases in the austenite is generally associated with depletion of the matrix with respect to the alloying elements such as Mo, Cr, Nb as well as loss of mechanical properties (ductility) and loss of corrosion resistance. Since all of the studied alloys are low carbon, the carbide content indicated in Table III is less than 1%. The sigma phase content indicated in Table III is higher for samples to the steels treated at 500 °C. It is observed that, as the temperature increases, the sigma phase content tends to decrease, once this stage tends to dissolve all of the phases at temperatures above 900 °C. The sigma phase is responsible for the loss of corrosion resistance, since it robs important alloying elements such as Cr and Mo leaving the austenitic matrix impoverished.Reference Padilha and Rios4 In some cases, equilibrium is not reached on a time scale compatible with the heat treatment applied to the alloy. Some phases predicted by the simulation in the diagram cannot form. Not all of the predicted phases will not necessary be present on the material. Under the equilibrium condition, the presence of secondary phases such as M23C6 carbide and sigma (σ) becomes possible. Due to the high content of chromium of the alloys, it is likely that the carbide predicted in the simulation can be chromium carbide.
Percentage (wt%) of two secondary phases according to the Thermocalc® simulation.

B. Phases precipitation
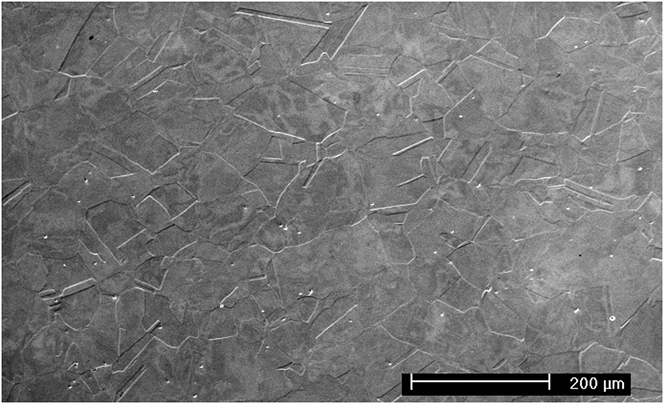
Figure 1 shows a SEM image of the microstructure of AL-6XN PLUS™ steel treated at 500 °C for 72 h. The grain boundaries and annealing twins characteristic of a FCC structure can be observed. The electrolytic etching was carried out with 10% oxalic acid reagent applying a voltage of 3 V and etching time of 50 s.
SEM micrograph of AL-6XN-PLUS™ alloy treated at 500 °C for 72 h.
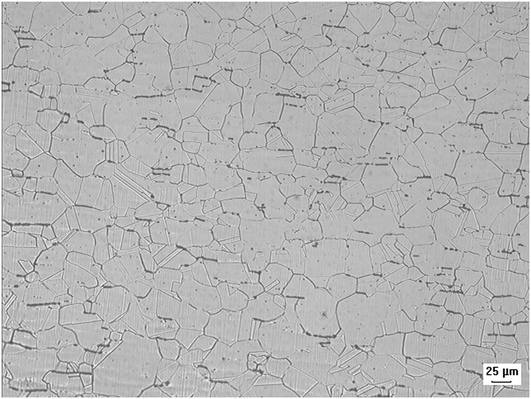
Figure 2 shows optical image of secondary phases precipitated in the 316L steels treated at 900 °C for 72 h. The phase presented on the micrograph can be delta ferrite. This phase is in an elongated form and it is precipitated on the grain boundary. Annealing twins typical of austenitic microstructure is also observed. According to the literature, it is possible that sigma phase starts precipitating in the delta ferrite island.Reference Villanueva, Junior, Plaut and Padilha9 The electrochemical etching was carried out with reagent 20%K(OH). For quantities less than 10% is not possible to identify sigma phase by x-ray diffraction.
Optical micrograph of deleterious phases in 316L alloy treated at 900 °C for 72 h.
In the literature, different hypotheses have been put forward to explain the formation of sigma phase in austenite. The decarburization of M23C6 for Fe and Cr carbides could result in sigma phase formation.Reference Wood10 According to Luce et al.,Reference Luce11 grain boundary M23C6 coalesces with aging, the carbide can break down to form sigma phase. According to Villanueva,Reference Villanueva, Junior, Plaut and Padilha9 sigma phase can precipitate in austenitic stainless steels in an eutectoid reaction (ferrite → sigma + austenite). This phase can precipitate on the grain boundaries or at the triple points of the grain boundaries. When the content of Ni and Cr is low, sigma phase can precipitate by noncooperative and continuous precipitation (traditional manner).Reference Singhal and Martin12 Delta ferrite is richer in elements that form sigma phase like Cr, Mo, and Si when comparing with austenite. This can facilitate sigma phase precipitation. According to Padilha,Reference Padilha and Rios4 the precipitation of sigma phase in austenitic stainless steels is very sluggish and take thousands of hours. The main reasons are: (i) sigma phase has very low carbon and nitrogen solubility, taking place for the precipitation of carbides and nitrides first. (ii) In austenite, the diffusion of substitutional elements is very slow. (iii) Sigma phase is incoherent in austenite and its nucleation is very difficult.
In the investigated samples it was not possible to identify if the precipitated phase was really sigma phase but there was evidence of a secondary phase precipitated at the grain boundaries and it was possible to see the influence of this phase in the corrosion tests. The phase precipitation kinetics was not the focus of this work.
C. Electrochemical corrosion tests
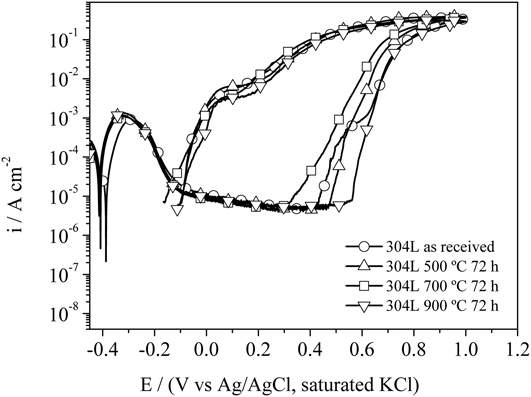
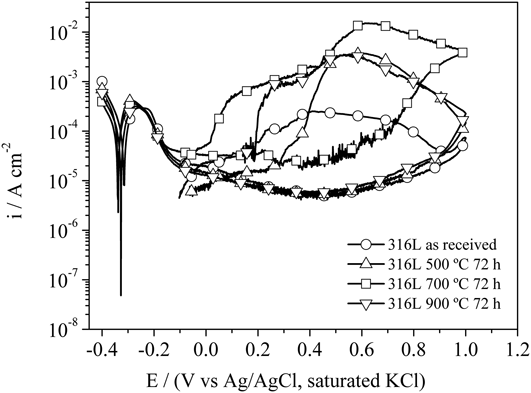
Figures 3 and 4 show the cyclic polarization curves for the 304L and 316L steels treated at several temperatures as well as in the as received condition. Samples of these steels were immersed in an electrolyte with concentration of 0.5 mol/L H2SO4 + 0.5 mol/L NaCl in aqueous solution. Hysteresis formation in all polarization curves of 304L steel was observed indicating that it was susceptible to pitting corrosion. In the passive region of the curves, the 304L steel has a similar electrochemical behavior in all heat treatments. After breaking the passive film, it was observed that the pitting potential varies with the temperature. The sample treated at 700 °C has the lowest pitting potential and the sample treated at 900 °C has the highest pitting potential. This indicates the influence of heat treatments on the pitting corrosion resistance of 304L. Although all samples of this steel suffered pitting corrosion, the sample treated at 700 °C showed greater susceptibility to this form of corrosion than the other samples. The cyclic polarization curves for the 316L steel in all heat treatment conditions, as well as in the as received condition also showed hysteresis indicating localized attack. It was observed again that the sample treated at 700 °C showed a different behavior. Its anodic current is higher than in other conditions. There was electrochemical noise in the passive region indicating a greater instability on the passive film. The polarization curves of the other samples of 316L steel showed similar behavior in the passive region, but different hysteresis areas. This difference of behavior can be attributed to deleterious phases precipitated on the materials due to the heat treatments.
Cyclic polarization curves in 0.5 mol/L H2SO4 + 0.5 mol/L NaCl of 304L alloy treated at several temperatures for 72 h and in the as received condition.
Cyclic polarization curves in 0.5 mol/L H2SO4 + 0.5 mol/L NaCl of 316L alloy treated at several temperatures for 72 h and in the as received condition.
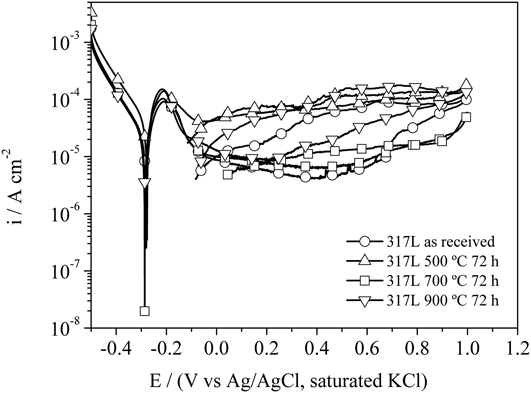
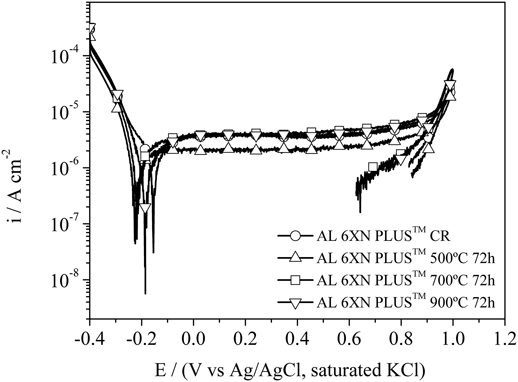
Figures 5 and 6 show the cyclic polarization curves for the 317L and AL-6XN PLUS™ steels treated at several temperatures as well as in the as received condition. All cyclic polarization curves for the 317L steel showed little hysteresis indicating a little of susceptibility to localized corrosion as observed in Fig. 5. The sample treated at 500 °C did not passivate in the considered medium. This can be observed by the magnitude of the anodic current (10−4 A/cm2). The heat treatment at 500 °C left the 317L steel more susceptible to corrosion. This sample suffered general corrosion. The other samples of 317L steel also exhibited different behavior. It can be observed that the hysteresis formed is not characteristic of pitting corrosion. Therefore, by the cyclic polarization curves, the 317L steel was resistant to pitting corrosion. Figure 6 shows the cyclic polarization curves for the AL-6XN PLUS™ superaustenitic stainless steel. Hysteresis curves were not observed in any of the polarization curves. This indicates that the superaustenitic steel was resistant to pitting corrosion. The passive region of the AL-6XN PLUS™ superaustenitic steel was very stable (almost a straight line parallel to the x-axis) indicating a good resistance to corrosion. This resistance can be attributed to high contents of alloying elements such as chromium and molybdenum. There is an increase in anodic current on the polarization curves of AL-6XN PLUS™ steel in the potential of +0.940 V. This current increase can be explained by the evolution of oxygen present in the solution. This free oxygen gives continuation to the metal oxidation process from this potential. According to Bandy and Cahoon,Reference Bandy and Cahoon13 with this type of reaction occurring, it is impossible to distinguish the current of the metal corrosion from the current that results of water dissociation reaction. This makes the tests limited for very high potential (in this case, above +1.0 V). Equation (2) describes this phenomenon.
 $$2{{\rm{H}}_2}{\rm{O}} \to {{\rm{O}}_2}\,{\rm{ + }}\,4{{\rm{H}}^ + }\, + \,4{{\rm{e}}^ - }\quad .$$
Cyclic polarization curves in 0.5 mol/L H2SO4 + 0.5 mol/L NaCl of 317L alloy treated at several temperatures for 72 h and in the as received condition.
Cyclic polarization curves in 0.5 mol/L H2SO4 + 0.5 mol/L NaCl of AL 6XN PLUS™ alloy treated at several temperatures for 72 h and in the as received condition.
The pitting critical potential was not reached in any of its curves. The reverse curves occurred when the potential reached the value of +1.0 V and showed decrease in the anodic current indicating no hysteresis formation and, therefore, no pitting formation. The decrease in anodic current density is associated with the passive film efficiency as a protective barrier against corrosion. It is observed in the graphics that all samples have almost the same electrochemical behavior. The corrosion potential and the anode current have approximately the same values. The samples of AL-6XN PLUS™ steel showed no pits on their surfaces.
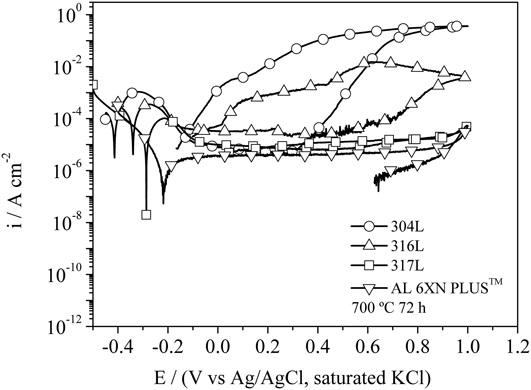
Figure 7 shows the comparison of cyclic polarization curves for the studied steels treated at 700 °C for 72 h. It is observed that the corrosion potential of the alloys increased according to the composition of the steel. The corrosion potential was higher for the superaustenitic stainless steel than for the others austenitic steels. The superaustenitic stainless steel had the greatest corrosion potential (−0.22 V) while the 304L steel had the lowest corrosion potential (−0.41 V). The superaustenitic stainless steel also showed the highest passivation potential. It is also noted that there was a decrease in hysteresis area as the contents of Mo, Cr, and Ni increases. The main element responsible for the passivation of stainless steels is chromium, but the presence of molybdenum increases the passive film resistance by creating a barrier against the chloride ions.Reference Ilevbare and Burstein14 It is known in the literature that the element Mo confers greater resistance to localized corrosion by the formation of molybidates that incorporate on the passive film improving its structure.Reference Ilevbare and Burstein14 The element Mo in the passive film can also change the electronic properties reversing the ionic selectivity in passive film structure hindering the migration of Cl− ions through the film.Reference Clayton and Lu15 Mo also reinforces the passive film by increasing its thickness.Reference Craig16 Ilevbare and BursteinReference Ilevbare and Burstein14 studied the resistance to pitting corrosion of two stainless steels, SS304GF and SS316GF in 1 M HCl solution. The SS316GF steel exhibited a greater resistance to pitting corrosion than the SS304GF steel. The authors concluded that the decisive factor for this behavioral difference was the Mo content (the SS304GF steel did not have the Mo element in its composition; the SS316GF steel had a content of 2.4 %wt Mo). Schneider et al.Reference Schneider and Kuron17 studied the susceptibility to pitting corrosion of 304L and 316L steels in a 5% NaCl at room temperature. The authors found higher resistance to pitting formation for 316L steel. The authors also claim that the presence of Mo in Fe–Cr alloys leads to film formation of insoluble salts within the pit. Some of molybdenum chloride salts have low solubility in aqueous solution while iron and chromium chlorides are soluble. The formation of stable and complex chlorides can decrease the concentration of free Cl− ions inside the pit allowing the repassivation of the steel.Reference Sugimoto and Sawada18
Comparison of the cyclic polarization curves in 0.5 mol/L H2SO4 + 0.5 mol/L NaCl for the studied alloys treated at 700 °C for 72 h.
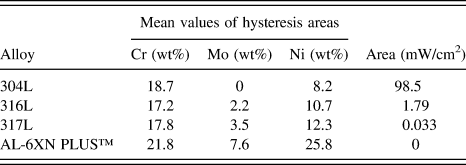
Table IV shows the relationship among the average areas of hysteresis for the samples immersed in the electrolyte of 0.5 mol/L H2SO4 + 0.5 mol/L NaCl and the contents of Cr, Mo, and Ni of each alloy. It can be seen that greater the content of these elements the alloy has, the less is the hysteresis area of the cyclic polarization curves. Table V confirms quantitatively the results of the hysteresis areas analyzed on the polarization curves. The average area of the hysteresis on the 304L steel is about 55 times greater than the average area of the hysteresis of 316L steel and 2984 times higher than that of 317L steel. The average area of the hysteresis of 316L steel is 54 times higher than that of 317L steel. 317L and AL-6XN PLUS™ steels have the highest Mo levels among the studied alloys. The increase in Mo content would increase the passive film thickness reducing the probability of chloride ions to penetrate the film. This explains why the 317L steel obtained the lower hysteresis when compared with 304L and 316L steels. The AL-6XN PLUS™ steel has both Cr and Mo in greater amounts leaving the film virtually impenetrable to the chloride ions (Cl−) in the electrolyte used. This explains the zero value (no hysteresis) in Table V. Ni addition favors the formation of oxide film in reducing environments enhancing corrosion resistance in acid media. When added in sufficient quantity, Ni stabilizes the austenite structure.
Relationship among the contents of Cr, Mo, and Ni (wt%) and the mean values of hysteresis areas for the studied alloys.
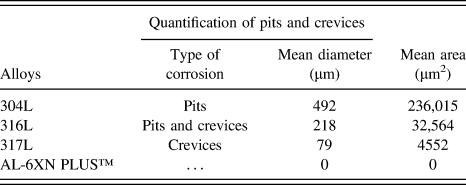
Quantification of the pits and crevices in area and diameter on the studied alloys.
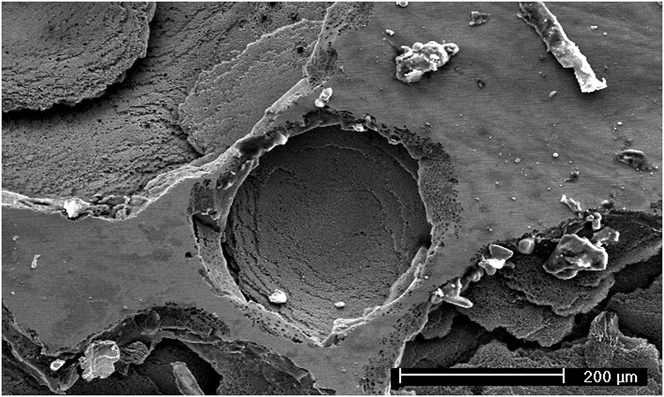
Figure 8 shows the surface of 304L steel treated at 900 °C for 72 h after cyclic polarization tests. It is possible to observe a central pit in circle format. Around this pit there are others pits that emerged and grew. As these pits grew and spread on the surface of this steel, larger pits were formed. This pit has an area of 49,883.41 µm2 and radius of 126 µm. All samples of 304L steel exhibited pits similar to the ones of Fig. 8. This result is consistent with the presence of hysteresis on the polarization curves.
SEM micrograph of pits on the surface of 304L alloy treated at 900 °C for 72 h after corrosion test.
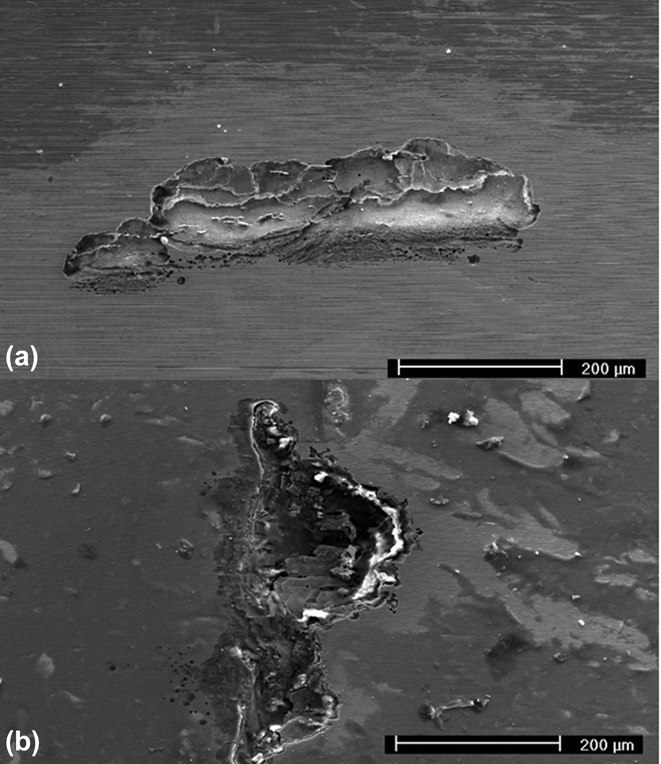
Figure 9 shows the surface of 316L steel after the cyclic polarization tests. Figure 9(a) shows the presence of crevices on the surface of 316L steel treated at 500 °C for 72 h. It is possible to observe a clearer area (protected by lacquer) and a darker region (attacked region by sulfuric acid). Figure 9(b) shows a crevice on the surface of 316L steel treated at 900 °C for 72 h after corrosion test. This crevice has an area of 50.091 µm2. This result is confirmed by the cyclic polarization curves of 316L steel that present characteristic curves of crevice corrosion. This form of localized corrosion (crevice corrosion) occurs under shielded surfaces where a stagnant solution is present. In this work, the shielded surface is represented by the lacquer used to reduce the exposed area of the alloys and also to avoid the crevice corrosion on the metal/resin interface. There are sites under the lacquer between the lacquer/metal interface that have the function of corrosion sites. These sites are sufficiently wide to permit the entry of the solution and, at the same time, sufficiently narrow to ensure that the solution remains stagnant. The propagation of crevices under the lacquer of 316L steel involves the dissolution of metal such as the pitting corrosion for the 304L steel. This occurs when there is a potential difference between the free-metal surface and regions which have geometric limitations due to the difference in concentration of chemical species between these two regions.Reference Li, Jiang, Yang, Cao and Zhang19 The anodic metal dissolution reaction within the crevices is balanced by the cathodic reaction on the surface near the crevice described by Eqs. (3) and (4), respectively.Reference Sedriks20
 $${\rm{M}}\, \to \,{{\rm{M}}^{ + n}}\,{\rm{ + }}\,n{\rm{e}}\quad {\rm{.}}$$
 $${{\rm{O}}_{\rm{2}}}\,{\rm{ + }}\,{{\rm{H}}_{\rm{2}}}{\rm{O}}\,{\rm{ + }}\,{\rm{4e}}\, \to \,{\rm{4O}}{{\rm{H}}^ - }\quad .$$
SEM micrographs of crevices on the surface of 316L steel treated at (a) 500 °C and (b) 900 °C for 72 h after corrosion test.
The increased concentration of M+ (M can be Fe, Cr, or even Mo) within the crevice results in the attraction of Cl− forming M+Cl− that is hydrolyzed by water to the hydroxide and the formation of HCl. This acid leaves the pH within the crevice to values below 2. This reaction is described in Eq. (5).Reference Sedriks20
 $${{\rm{M}}^ + }{\rm{C}}{{\rm{l}}^ - }\,{\rm{ + }}\,{{\rm{H}}_{\rm{2}}}{\rm{O}}\, \to \,{\rm{MOH}}\,{\rm{ + }}\,{{\rm{H}}^ + }{\rm{C}}{{\rm{l}}^ - }\quad .$$
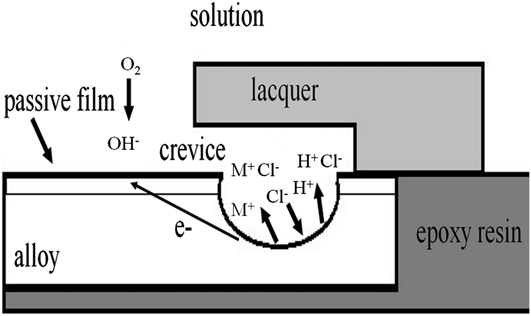
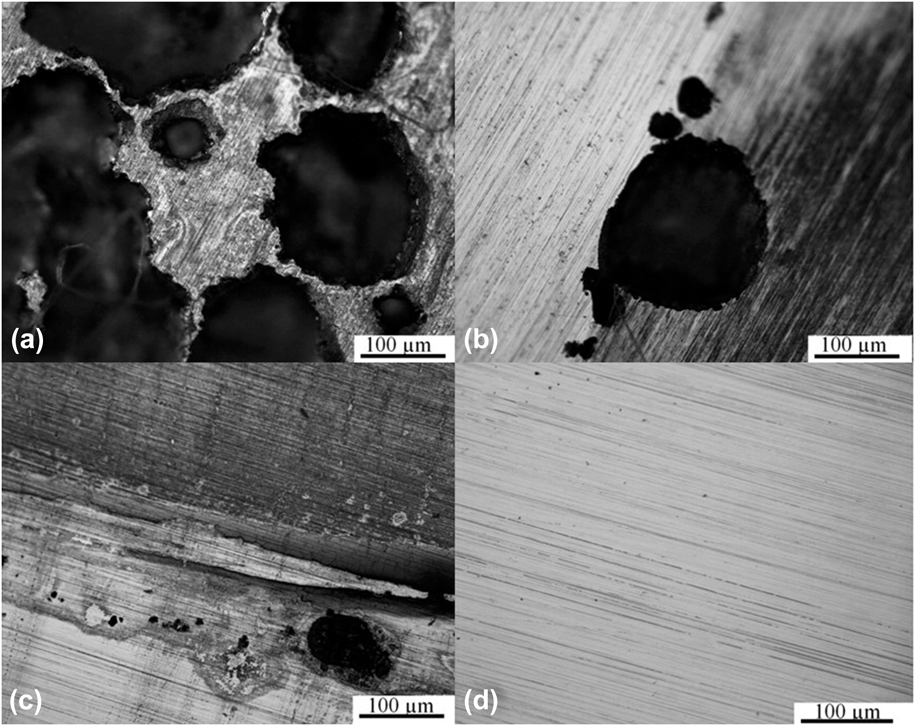
The solution present within the crevice can be regarded as concentrated hydrochloric acid containing metal chloride dissolved at concentrations near saturation.Reference Sedriks20 The initiation and propagation of crevices corresponds to the formation of discrete pits within the crevice region as depicted in Fig. 10. The schematic illustration of Fig. 10 is in accordance with the micrographs shown in Fig. 11 where one can see the formation of crevices on the metal/lacquer interface. To see the crevices, the lacquer was removed from the samples surfaces. The development of the crevice under the lacquer involves an increase in number of pits that coalescence into large corrosion areas. The increase of alloying elements such as Cr, Ni and the addition of Mo in 316L steel when compared with the 304L assures more resistance to pitting corrosion but in some cases where the solution is stagnant under shielded surfaces, this can lead to crevice corrosion mainly when the steel has the tendency to this form of corrosion. In addition to the pitting formation, the 316L steel was also susceptible to pitting corrosion. There was pitting corrosion only for the sample treated at 700 °C for 72 h. The distribution of pits on the surface of this sample was not uniform (there were few pits) prevailing the presence of crevices. This difference in behavior can be attributed to the presence of deleterious phases at 700 °C which allowed the pits formation. The other samples presented only crevices on their surfaces. Thus, the 316L steel presented better performance than the 304L steel with respect to pitting corrosion. Presence of pits on the sample surface of 317L steel was not observed. The 317L steel was also susceptible to crevice corrosion, but the crevices were much smaller than the crevices of 316L steel confirming the positive effect of alloying elements. A comparison of the alloy surfaces after the cyclic polarization test is shown in Fig. 11. These micrographs correspond to the cyclic polarization tests shown in Fig. 7. It is possible to see the pits formed on the surface of 304L alloy [Fig. 11(a)] and these big pits justify the big areas of the hysteresis found on its polarization curves. Crevices can be seen on the surface of 316L between the lacquer and the exposed metal [Fig. 11(b)]. Crevices were also found on the surface of 317L alloy between the lacquer and the exposed metal [Fig. 11(c)]. These crevices are smaller than the pits and the crevices of 304L and 316L alloys respectively. The small crevices justify the small areas found on the polarization curves of 317L alloy (see Table IV). The surface of AL-6XN PLUS™ alloy is also shown in Fig. 11(d). There was neither localized attack nor general corrosion on its surface. This result is compatible with the format of the hysteresis areas of the cyclic polarization tests. Among the 300 series austenitic stainless steels here studied, the 317L steel had the best performance when compared with the 304L and 316L steels. The AL-6XN PLUS™ steel showed the best performance when compared with the other steels. There was no formation of crevices or pits on the samples surfaces. This result confirms the cyclic polarization curves for this material showing excellent resistance on the passive film. This does not mean that there was not the presence of deleterious phases during the heat treatments, but the content of these phases was not enough to reduce the resistance to pitting corrosion in the electrolyte used.
Schematic illustration of the crevice corrosion mechanism.
Optical micrographs of pits and crevices on the surface of the studied alloys (a) 304L, (b) 316L, (c) 317L, and (d) AL-6XN PLUS™ treated at 700 °C for 72 h after corrosion test.
Table V shows the quantification of pits and crevices (area and diameter) for all of the studied alloys. The arithmetic mean of diameters and areas for pits and crevices was calculated. It was observed that the mean values for diameters, pits, and crevices areas decrease as the steel composition becomes more noble. This result agrees quantitatively with Table IV where the content of the main alloying elements is shown.
IV. CONCLUSION
The 304L steel showed the highest susceptibility to pitting corrosion among the studied alloys. The cyclic polarization curves of this steel showed the highest hysteresis as well as the largest pits. There was precipitation of deleterious phases for the heat treated samples which may have caused the increase of susceptibility to localized corrosion but this was not confirmed in this work. The 316L steel has suffered pitting and crevices corrosion. Its resistance to pitting corrosion was higher when compared with the 304L steel. Its samples showed smaller hysteresis indicating that the attack by chloride ion was not so intense. There were nearly no pits on its surface and the pits found were smaller than the pits found on the 304L steel. The crevices were distributed along the edges of the samples of 316L steel. There was the precipitation of deleterious phases on the surfaces of the heat treated samples. The 317L steel showed higher resistance to pitting corrosion, but it was susceptible to crevice corrosion. Its samples showed hysteresis smaller than those found on the samples of 304L and 316L steels. The crevices found on the surfaces of 317L steel were much smaller than those found on the samples of 316L steel. The presence of crevices on the 316L and 317L steels is related to a problem of interface with the lacquer used to reduce the anodic area and this is also a tendency of these materials to suffer crevice corrosion. There was the precipitation of deleterious phases for the heat treated samples of 304L, 316L, and 317L steels. The AL-6XN PLUS™ superaustenitic stainless steel was the most resistant alloy to pitting corrosion among the studied alloys. There were neither pits nor crevices on the surfaces of the samples for this steel. The results also demonstrated the importance of alloying elements such as Cr, Mo, and Ni that increase the resistance to pitting corrosion. The greater the content of these elements on each alloy, the greater the resistance to pitting corrosion. Superaustenitic stainless steels are a good choice for problems with localized corrosion in the oil and gas industry, since this steel used in this study achieved the best result for pitting corrosion.
ACKNOWLEDGMENTS
The authors would like to acknowledge financial support received through the Brazilian National Council for the Improvement of Higher Education (CAPES) and the American company Allegheny Ludlum Corporation, especially to Eng. David Hasek for providing the superaustenitic steel studied in this work.