Introduction
Since the publication of the first scientific paper in Philosophical Transactions in 1665, Reference Oldenburg1 scientific publications have become the primary form of scientific communication and a crucial part of scientific work. The first edition of Philosophical Transactions begins with an introduction extolling the virtues of the new publishing endeavor, stating, Reference Oldenburg2 “Whereas there is nothing more necessary for promoting the improvement of Philosophical Matters, than the communications to such, as apply their studies and endeavors that way, such things are discovered or put in practice by others; it is therefore fit to employ the Press.” Even 350 years ago, it was evident that by reading and analyzing the work of others, one is exposed to new ideas and facts, thus transcending the expertise of a single person. By writing and publishing, we communicate with our peers and contribute to the archived repository of human knowledge. Unsurprisingly, publications and their impact are often used as a fundamental measure of the scientific impact made by a person or organization.
The progress of human civilization has led to the rapid growth of the scientific sphere, with concurrent exponential growth in the number of publications. Presently, the volume of scientific publications doubles every nine years; 3 around 1.5 million articles were published in 2009. Reference Jinha4 The repositories of scientific publications such as the Web of Science contain information on 90 million items dating back to 1900. This exponential growth in published research should be contrasted to the linearly (at best) increasing capability of the individual researcher to read and process the contained information.
One of the consequences of this growing disparity between the publication volume and cognitive capabilities is the structuring of science in progressively narrower domains, roughly corresponding to fully connected segments of scientific knowledge and social networks (cliques). Within such communities, it is possible to be fully aware of active research groups and current and emergent trends. However, interactions and the exchange of ideas among such groups are limited and become progressively more difficult once they are further apart in the knowledge space. This tendency is further highlighted by the emerging tendency (in the case of experimental investigations) for the development of dedicated instrumental facilities. These have been successful in making advanced scientific tools such as x-ray and neutron scattering/scanning and electron microscopy available to a broad scientific community. They necessitate rapid learning on the part of both facility scientists and users to establish optimal experiments to address specific problems and to interpret measurement results in terms of materials-specific parameters.
Much like free monetary exchange is a part of a successful economy, exchange of ideas is an essential part of science. However, unlike currencies, this exchange is limited by human capability. It is unsurprising that so much emphasis is now placed on interdisciplinary research and publication in high-profile journals as a natural way to counteract this tendency toward formation of isolated communities.
The emergence of paper abstract collections in the Science Citation Index, which have subsequently appeared in electronic databases such as the Web of Science, Scopus, and Google Scholar, have given researchers an opportunity to explore the body of existing literature through keyword-based searches. Correspondingly, in many cases, researchers follow a strategy in which the examination of search results provides a list of relevant publications that can be further used to start the next round of searches. In some sense, this type of motion through the scientific landscape is reminiscent of the strategy of ants looking for food; hence it is often referred to as a “foraging” strategy. The availability of the centralized databases such as Scopus and Web of Science, and electronic forms of many scientific journals make this work rapid and efficient. Many of these advances were foreseen 50 years ago by J. Licklider in his book Libraries of the Future. Reference Licklider and Clapp5
Nevertheless, such an approach for exploring the scientific world is somewhat limited. A researcher can find connections between scientific areas where these connections are obvious. However, analysis of weak or latent links between fields is often difficult. If there are basins of interest in the scientific landscape, a foraging strategy will not reveal these if there are no obvious connecting pathways. While somewhat academic in description, there are multiple examples of such disconnects in many scientific fields. For example, in the field of materials, we can consider the case of the manganites. Reference Salamon and Jaime6 These were heavily researched by the chemical sciences community for the impact of their stoichiometries on electrochemical properties, Reference Jiang, Wang, Zhang, Yan and Li7–Reference Endo, Ihara, Komiyama and Yamada9 but this was poorly linked to physicists who were intrigued by colossal magnetoresistance. Reference Uehara, Mori, Chen and Cheong10,Reference Jin, Tiefel, McCormack, Fastnacht, Ramesh and Chen11
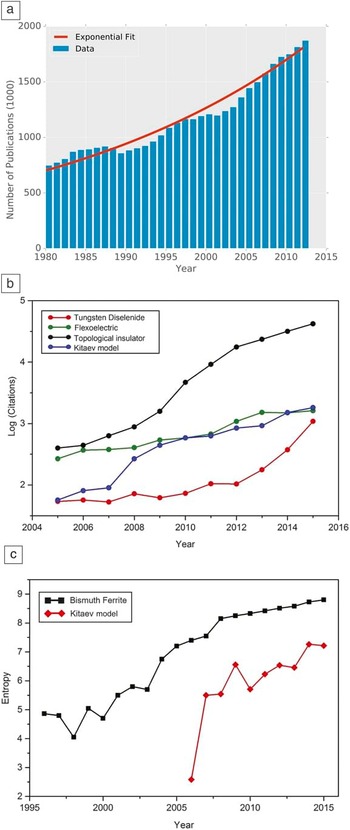
In the last decade, the large-scale emergence of technologies such as search engines (Google) and social networking (Facebook) deployed on mobile handheld platforms has fundamentally changed our lives. Similar progress has not been attained in terms of literature searches, however, which still rely on the same abstract databases and electronic publications that have not changed much since the late 1990s. Technologies that allow one to analyze the full volume of scientific literature based on semantic and citation analysis of the networks are therefore of significant interest. The volume of information is large—the number of scientific publications has been increasing exponentially, and this is also true for individual fields (see Figure 1 ). Reference Bornmann and Mutz12
The growth of research publications. (a) Number of publications per year. The red line indicates the exponential fit to the number of publications, y p. The trend is also obvious for smaller fields. Reference Bornmann and Mutz12 (b) The number of articles on topological insulators has been increasing dramatically since 2008. (c) The entropy of terms is an excellent method to determine the rate of new discoveries within a particular area. Entropy here is a measure of the degree of unpredictability of the terms found in each year’s abstracts; the number refers to the ability to predict the terms in the abstract for the current year from those in the previous years. If a field experiences a dramatic change, new terms will be used in the abstracts, resulting in a large increase in entropy. However, if a field is stagnating, the entropy will be reduced. These are shown for two topics—bismuth ferrite and the Kitaev model.

There are a growing number of computer software that are specifically designed to facilitate the study of trends and patterns in scientific literature. CiteSpace, Reference Chen13 VOSViewer, Reference van Eck and Waltman14 and the Science of Science Tool 15 are among the most widely used applications, and they are all freely available. All of these tools offer the capability to study citation networks and analyze relationships among authors and institutions, producing graphical representations of various fields, although they differ in terms of the breadth and depth of the support for visual analytic studies. CiteSpace is particularly designed and optimized for identifying and analyzing the structure and dynamics of research programs in scientific disciplines. The design of CiteSpace is built on a rich theoretical foundation that, in turn, draws insights from philosophical theories of science development, the structural hole theory, and optimal information foraging. For instance, detecting intellectual turning points in the course of the development of a scientific domain is critical and highly complex and demanding to accomplish; in CiteSpace, the complexity of the task is significantly reduced through computational and explanatory transformations in the background such that the analyst can accomplish the task much more efficiently. CiteSpace provides an alternative approach to conducting a traditional labor-intensive literature survey; it streamlines the process of characterizing the major themes of a research field and how these themes evolve over time.
Examples
We illustrate the benefits of this analysis by applying it to several fields. We have chosen fields that are familiar to three of the authors, and hence, we can compare and interpret the network analysis based on our expertise. This method can be applied to any field.
Bismuth ferrite
We begin with a field defined by a single material—BiFeO3 (BFO)—that has seen a large number of publications for approximately the past 15 years. Reference Wang, Neaton, Zheng, Nagarajan, Ogale, Liu, Viehland, Vaithyanathan, Schlom and Waghmare16–Reference Kumar, Palkar, Srinivas and Suryanarayana18 BFO is the only room-temperature single-phase multiferroic material known Reference Ramesh and Spaldin19 and has received immense interest since it was discovered that epitaxial growth of BFO films resulted in remarkable properties. Since the initial report of epitaxial heterostructures of BFO, there have been more than 5000 references to bismuth ferrite (or BiFeO3) in the Web of Science database.
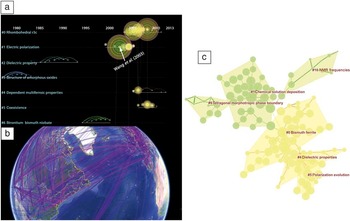
The citation analysis of all references was performed via the CiteSpace Reference Chen13,Reference Chen, Hu, Liu and Tseng20 Program, which allows networks to be displayed as a timeline, as shown in Figure 2a. Each paper is a node in this representation, and the size of the node is proportional to the number of citations. As can be seen, the number of nodes expands dramatically after the early 2000s. Furthermore, the arrows represent links (citations) to other works, while the nodes that are highlighted in purple are those that are particularly central to the citation network. The figure is broken up into several tiers, where each tier is a cluster formed in the citation network. Such an analysis is extremely instructive and this figure provides many insights pertaining to the progression of the topic, the type of synthesis, and more.
CiteSpace Reference Chen13 analysis for BiFeO3. (a) Timeline view, papers, and the clusters they reside in, as a function of year published. Each paper is represented as a node on the timeline. The citations made are evident via the arrows connecting the nodes. Each tier represents a different citation network cluster, and each cluster is labeled by a semantic analysis of the members of each cluster. The labels generated from the semantic analysis are indicated on the left. The numbers are simply cluster index number (used only for identification). (b) Geographical map showing collaborations among authors in years 2014–2015, with the color representing the year of the collaboration (blue = 2014; purple = 2015), and the thickness of the line representing the strength of the collaboration (i.e., number of joint publications). (c) Some clusters in BiFeO3 are labeled via terms that are found in their abstracts. The clusters are the same clusters as in (a), but the labels are different (CiteSpace offers different methods to calculate the term label). It should be noted the colors here do not have specific meaning. Note: NMR, nuclear magnetic resonance.

In a seminal paper in 2003, Wang et al. Reference Wang, Neaton, Zheng, Nagarajan, Ogale, Liu, Viehland, Vaithyanathan, Schlom and Waghmare16 reported the growth of BFO in an epitaxial thin film, achieving multiferroic properties at room temperature. Although papers on BFO were published before the 1990s, the field received a major jolt after the 2003 work. To the left of the timeline are the terms associated with clusters found from the semantic analysis of the keywords contained in the papers studied. Several of these terms, for example, “structure of amorphous oxides,” and “dielectric property,” preceded the thin-film (epitaxial) form, and an explosion of research after the initial report by Wang et al. is observed. These subsequent studies focused on the crystal structure, polarization, and the coexistence of electric and magnetic ordering (“multiferroic properties”). In order to determine the current state of the field (e.g., whether it is still growing or when the major discoveries were reported), it is useful to analyze the entropy of the terms identified in the papers studied. If entropy is increasing, then new terms are being used, suggesting, for example, discovery of new physics. The entropy plot in Figure 1c indicates that although entropy increased dramatically in the early 2000s for this topic, it has not been growing substantially over the past several years; this suggests that barring some major new breakthrough, researchers may have moved into other areas. This can be compared with smaller, newer fields that have higher slopes in the entropy graph, such as “Kitaev model,” plotted in red on the same graph. Therefore, investigation of these plots can be insightful for newcomers to a field in evaluating whether large advances are consistently occurring, or whether the research has ebbed due to lack of major new discoveries. Such analysis can be highly useful when determining which materials field to target, for example, when pitching new research ideas or new techniques.
Beyond observing timelines, one can also see the multinational nature of the research in this topic. Figure 2b shows the links between various institutions, and each line represents collaborations (joint papers) between authors at two institutions for the years 2014 and 2015. Darker lines indicate stronger connections (i.e., more joint publications). Such analysis can be beneficial to explore potential collaborations and to observe whether certain fields are more geographically confined (and if so, to speculate on the specific reasons why), presenting new opportunities.
Semantic analysis of the clusters allows keywords and clustering in a hierarchical space to be determined, as seen in Figure 2c. The different colors represent the different clusters found, and members of each cluster (i.e., papers) are represented by nodes. As before, larger nodes indicate papers with more citations (though the papers themselves are not labeled in the diagram for the sake of clarity). This image is simply an alternative representation of the timeline in Figure 2a, although it is more instructive from the cluster separation standpoint, and the terms used to label the clusters have been changed in this representation. (CiteSpace offers the ability to display terms in abstracts based on log-likelihood ratio, mutual information, and other metrics.) One can see a separation between those terms focused on the magnetic properties of BFO (e.g., “nuclear magnetic resonance frequencies”), and those focusing on structure and synthesis (“tetragonal morphotropic phase boundary” and “chemical solution deposition”). It is also instructive to see growth methods (such as chemical solution deposition) highlighted among the terms, suggesting that alternative forms of growth of this compound comprise a significant pursuit of the field. These types of analyses show the main research thrusts in the field and highlight some of the techniques that are used to synthesize and characterize the particular material. As such, they are highly instructive when surveying a field to determine both the extant progress, as well as the current areas of research and the tools of study.
Flexoelectricity
The phenomenon of flexoelectricity has been known for many decades Reference Tagantsev21 and describes the linear coupling between a material’s polarization and strain gradient. Flexoelectricity in solids has received renewed interest, especially from the ferroelectrics community over the past decade, as strain gradients can typically become large in thin films and nanostructures (which can now be routinely synthesized with advances in growth techniques), whereas in bulk, the observed effects tend to be extremely small and have been generally neglected. Reference Biancoli, Fancher, Jones and Damjanovic22 Interestingly, flexoelectricity has also been studied by researchers working on liquid crystals, Reference Patel and Meyer23 where the phenomenon had been known for nearly 30 years. Reference Beresnev, Blinov, Davidyan, Konov and Yablonskii24 This provides an excellent test for the CiteSpace analysis to determine if these two research areas can be separated and to identify the links (or lack thereof) between them.
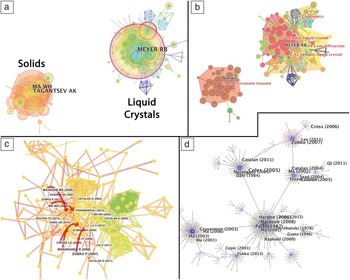
Figure 3a shows the result of the CiteSpace analysis on the author networks for papers that contain the term “flexoelectric” (in total, 773 papers from Web of Science). Two features are immediately visible in the author network analysis. First, there are clearly two clusters of authors with the right cluster associated with liquid crystals and the left cluster associated with the oxide thin films and nanostructures (“solids”). Second, the cluster on the right is larger than the cluster on the left. This is not surprising, since research into the flexoelectric effect in liquid crystals has continued for three decades, whereas research into flexoelectricity in solid ferroic oxides is only about one decade old. In other words, one field has managed to accrue more citations by virtue of existing for a longer period of time. Classifying and clustering these author networks based on the terms contained within each network is shown in Figure 3b. This is again highly instructive, as it shows that the most common term used in the author network on the left is “lead zirconate titanate” (a common ferroelectric material), whereas the network on the right is identified by “nematic liquid crystals,” which again defines the material of interest. Further terms in the network on the right include a separate cluster on lyotropics (classifying a type of material that forms a liquid-crystal phase upon addition of a solvent), as well as x-ray diffraction. Note that the same term (red text) can appear in distinct citation network clusters.
Flexoelectricity CiteSpace Reference Chen13 analysis. (a) Author networks, clearly showing two sub-networks distinguishing the two distinct components to this field. (b) Clustering analysis, showing that the distinction between the members of the two major author networks is related to the material type (one a ceramic and the other liquid crystals). Each cluster is a different color. (c) Within each network, we can look at the cited authors and the links between them. Shown here is the network titled “solids” in (a). (d) Network of cited papers from within the “solids” citation network.

Further analysis can be conducted on the individual author networks. For the network studying flexoelectric effects in solid ferroic materials, the nodes represent specific papers and their authors, which are shown in Figure 3c. This figure clearly shows that the author network is relatively closed (i.e., most authors are citing most others in the field), leading to substantial overlapping. The font size for each name is proportional to the frequency of citations in the network of that particular author.
One can also focus on the important papers within the field and determine the patterns of the network, as shown in Figure 3d. Some works lead to substantial numbers of subsequent works (as shown by the large nodes in the figure), sending the field into different directions. “Bridging” papers can also be found using this method, and are frequently review articles, such as by Zubko in 2013 Reference Zubko, Catalan and Tagantsev25 that link independent branches. Again, the font size is proportional to the frequency of citations. Therefore, the analysis allows one to determine the degree of links between distinct strands in the field and whether more cross-collaborations should be encouraged to avoid the formation of cliques.
Search for new materials
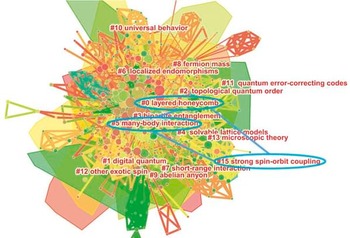
We can demonstrate that the CiteSpace analysis is not only limited to reviewing literature on existing materials, but it may also be used to search for new materials with specific properties. Figure 4 shows a cluster network analysis created for papers containing the phrase “Kitaev model.” This term stands for a highly anisotropic form of exchange interaction between (pseudo)spin-1/2 moments arrayed on a honeycomb lattice. The elementary excitations associated with this model include a Majorana fermion, which is vital in the context of a topological quantum computation. Reference Sarma, Freedman and Nayak26
Clusters in a network analysis of a relatively small literature domain (390 publications) created for the term “Kitaev model.” Clusters are labeled via terms found in their abstracts. By drawing lines that connect individual clusters, one may obtain a clue for finding specific materials in which the Kitaev model is realized or finding applications. The three circled terms can be viewed as descriptors of the lattice structure and interactions in those materials that could display Kitaev physics. Note that the colors do not have specific meaning.

Due to the relatively small size of this literature domain (less than 500 publications), a simple visual inspection of clusters becomes possible. Furthermore, by manually connecting individual clusters, we obtain clues for specific materials that display Kitaev physics. For example, our analysis shows that materials with a honeycomb lattice, a strong spin–orbit coupling and strong electron correlation may realize a Kitaev model. This agrees with recent observations of a magnetic phase in the immediate proximity to a Kitaev phase in the layered honeycomb compound of the 4d Reference Licklider and Clapp5 transition metal α-RuCl3, Reference Banerjee, Bridges, Yan, Aczel, Li, Stone, Granroth, Lumsden, Yiu, Knolle, Bhattacharjee, Kovrizhin, Moessner, Tennant, Mandrus and Nagler27 in which both spin–orbit coupling and electron correlations are relevant.
Scanning tunneling microscopy
Finally, to illustrate how such an analysis can fare for a large and established field and to examine how high-profile topics evolve, we turn to scanning tunneling microscopy (STM). Reference Binnig and Rohrer28 Work in STM has been conducted for more than three decades with thousands of active researchers working with this technique (which is by now commercially developed) on a wide variety of material systems, achieving unprecedented resolution in terms of imaging atomic positions and mapping of electronic structures via scanning tunneling spectroscopy.
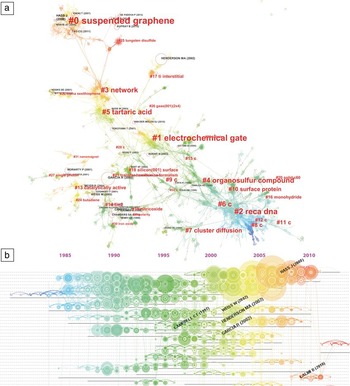
The results of CiteSpace analysis on papers containing the words “scanning tunneling microscopy” are shown in Figure 5 . This visualization depicts the evolution of the field in terms of its several major clusters at various stages. The blue colors represent earlier works, which progress through to green, yellow, and brown/red with increasing time. The overall development path of the STM domain starts in the lower-right corner of Figure 5a with papers describing STM imaging of DNA (cluster #2) and protein (cluster #10) molecules on surfaces and moves to the upper-left corner where some of the youngest clusters are formed, for example, clusters with papers on STM of two-dimensional (2D) materials such as graphene and tungsten disulfide (clusters #0 and #25, respectively. Also, the bottom-left corner of the cluster network in Figure 5a is largely associated with STM studies of surface catalytic properties, including those in iron oxide and titanium oxide. STM imaging of surface structures at the level of individual atomic and molecular configurations provides unique capability for identification of active sites in catalytic reactions.
CiteSpace Reference Chen13 analysis of scanning tunneling microscopy (STM). This is the largest connected component of a network of co-cited references on STM published between 1982 and 2016. Note: only the top 10,000 cited papers are included. (a) Several major clusters for different stages of the evolution of the STM field. The thematic areas are colored by the year of publication of the citers of each of these areas (i.e., clusters). Cluster labels are generated from the keywords found in their citers, which are used to indicate the themes of impact. Nodes with text labels are highly cited references. Nodes with red inner circles represent publications in which the number of citations they received grew exceedingly fast within a variable period of time, which can be seen as a sign of a concentration of research interest and activity. Two examples of such works are Yokoyama (2001) (middle, near “tartaric acid”) and Hass (2008) (top left). (b) Timeline view for the evolution of citations; clearly, the field has experienced downturns and upturns. Note: The levels on the timeline in (b) separate the papers into relevant clusters based on terms found within the papers; (a) identifies these clusters. Blue colors represent earlier works and progress to green, yellow, and brown/red with increasing time. Note: reca dna, recA bacterial DNA recombination protein; c, carbon.

The results are also displayed in a timeline view in Figure 5b showing the evolution of citations. A recent surge of interest in STM research on graphene and other 2D materials coincides with the successful isolation of a graphene single layer in 2004, Reference Novoselov, Geim, Morozov, Jiang, Zhang, Dubonos, Grigorieva and Firsov29,Reference Novoselov, Jiang, Schedin, Booth, Khotkevich, Morozov and Geim30 followed by the Nobel Prize for its discovery in 2010. This surge is visible in the top-left corner of Figure 5a, as well as in the timeline view in Figure 5b. STM has emerged as one of the most vital tools in studying the fundamental physical properties of graphene and other 2D materials, as it can probe an electronic ground state in the 2D limit with subnanometer precision, enabling exploration of the effects of dimensionality, coupling to substrate, and atomic-scale defects in these systems. The use of CiteSpace in this instance allows one to visualize the progress of a single technique over the years—fully viewing the range of applications for this technique and when they were first used—and further highlights how the discovery of new materials can provide impetus toward resurgence of a technique (as indicated by the large number of citations in the early 1990s, the drop off mid to late 1990s, and the resurgence in the early 2000s in the timeline view in Figure 5b).
Future directions
The analysis of citation networks and term lists, discussed here for four distinct fields of varying sizes, shows that a great deal of information pertaining to field directions, author networks, collaborations, and field popularity can be gained, going far beyond the basic analysis of the number of citations per given year. These insights can be used to determine which topics are “hot,” and help to identify potential avenues for collaborations and cross-pollination within fields that have branched substantially.
It should be noted that there are some drawbacks with this analysis and that making strong inferences from the data generally requires a domain expert. For instance, the term labeling can isolate phrases or letters that are not particularly useful; as an example, the numerous clusters for which the term is simply “c” (presumably, for carbon) in Figure 5. Additionally, certain review articles can garner many more citations than seminal works in a field, distorting the analysis that is based purely on citation networks. On a philosophical level, such analysis must always be discussed with knowledgeable domain experts, who are appreciative of the unique difficulties and specialties within a specific field. For example, those fields that are particularly difficult may show stagnation in this analysis; however, such analysis does not provide any judgment as to the worthiness of those particular directions. Nonetheless, these tools offer practicing scientists and researchers a detailed window into their own fields, as well as the capability to identify potential opportunities in related areas.
The next step in the citation analysis would be to integrate the knowledge gained into a model that can predict the growth of fields and the directions in which they will move, identify outstanding contributors and contributions, and suggest areas where linkages could be stronger. Reference Chen31 For example, when a field reduces in popularity, one may ask where those researchers are now focusing their efforts. By combining this information with that on new and upcoming fields, both researchers and research managers can obtain a more accurate representation of the current state of research and the promising areas on which to focus their attention. Furthermore, the identification and classification of distinct clusters of researchers along with geospatial information can allow for better targeting of collaborations.
In the future, we envision this type of information and links being used as an input to hypothesis testing and machine learning, as exemplified by IBM Watson-style technologies, where a question can be asked of a specific field and, based on inputs to the generated model, the system can generate a probabilistic answer on possible lateral connections, opportunities, and pathways to achieve them.
Acknowledgments
Research for R.K.V. and S.V.K. was sponsored by the Laboratory Directed Research and Development Program of Oak Ridge National Laboratory, managed by UT-Battelle, LLC, for the US Department of Energy (DOE). M.Z. acknowledges support from the Division of Materials Sciences and Engineering, BES, US DOE. Research was conducted at the Center for Nanophase Materials Sciences, which is a DOE Office of Science User Facility.

Rama K. Vasudevan is a research and development associate at the Center for Nanophase Materials Sciences and Institute for Functional Imaging of Materials at Oak Ridge National Laboratory. He received his PhD degree in materials science from the University of New South Wales, Australia, in 2013. His research focuses on utilizing scanning probe microscopy at the meso- and atomic scale, especially in ferroics and manganites, and on developing and implementing tools for deep data analysis of SPM-acquired data sets. Vasudevan can be reached by phone at 865-574-1034 or by email at rvv@ornl.gov.
Maxim Ziatdinov is a postdoctoral research associate at the Center for Nanophase Materials Sciences and Institute for Functional Imaging of Materials at Oak Ridge National Laboratory. He received his PhD degree in materials science and engineering from the Tokyo Institute of Technology in 2014. His current research focuses on scanning probe microscopy of strongly correlated materials, including high-temperature superconductors and Kitaev materials. Ziatdinov can be reached by phone at 865-241-4617 or by email at ziatdinovma@ornl.gov.

Chaomei Chen is a professor in the College of Computing & Informatics at Drexel University. He received his BSc degree in mathematics from Nankai University, China; MSc degree in computation from the University of Oxford, UK; and PhD degree in computer science from the University of Liverpool, UK. He is an editor, author, and researcher in visual analytics, information visualization, mapping scientific frontiers, and theories of scientific discoveries and creativity. Chen can be reached by phone at 215-895-6627 or by email at chaomei.chen@drexel.edu.
Sergei V. Kalinin is the Director of the Institute for Functional Imaging of Materials and distinguished research staff member at the Center for Nanophase Materials Sciences at Oak Ridge National Laboratory. He earned his PhD degree from the University of Pennsylvania in 2002. His research interests include application of big data, deep data, and smart data approaches in atomically resolved and mesoscopic imaging, as well as electromechanics and electrochemistry of nanoscale systems. Kalinin is a recipient of the Royal Microscopical Society Medal for Scanning Probe Microscopy in 2015, Presidential Early Career Award for Scientists and Engineers in 2009, Burton Medal of the Microscopy Society of America in 2010, and R&D 100 Awards in 2008 and 2010. He is a Fellow of APS and AVS. He has published approximately 450 peer-reviewed journal papers, edited three books, and holds more than 10 patents. Kalinin can be reached by phone at 865-241-0236 or by email at sergei2@ornl.gov.