Introduction
I feel very honored to be given the opportunity to present an overview of our work on the development and application of in situ observations, at the atomic level, of reactions in materials. The primary investigative technique is high-resolution transmission electron microscopy (HRTEM), complemented in many cases by parallel bulk measurement studies. The current status of this approach is addressed, especially in light of the new generation of aberration-corrected transmission electron microscopes (TEMs) with image and probe-forming resolutions well below 0.1 nm. The scope of in situ experiments is increasing with time, which can lead to an ever more fundamental understanding of materials behavior.
Background
HRTEM was largely developed for atomic resolution imaging during the 1970s (e.g., References 1 and 2) by a combination of instrumental improvements to the TEM combined with theoretical understanding. The first likely dynamic HRTEM observations, of dislocation movement in gold stimulated by the imaging electron beam, were reported by Hashimoto et al. in 1980. Reference Hashimoto, Takai, Yokota, Endo and Fukuta3 Our own recordings on the semiconductor CdTe followed shortly thereafter. Reference Sinclair, Yamashita and Ponce4,Reference Sinclair, Ponce, Yamashita, Smith, Camps, Freeman, Erasmus, Nixon, Smith and Catto5 However, we realized that temperature control by utilizing the electron beam is not adequate, and, moreover, other electron-specimen interactions cannot be precluded by this approach. Accordingly, Parker demonstrated in 1986 that commercially available heating holders had both the necessary mechanical and temperature stability to allow high-resolution imaging, with minimal specimen drift at controlled elevated temperatures, Reference Sinclair and Parker6 and that video-rate recording to follow the behavior over extended periods of time was possible.
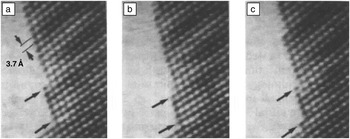
There were several major concerns at that time, principally whether the observations by in situ HRTEM on thin samples were representative of the bulk material. Accordingly, we concentrated our efforts on studying reactions at material interfaces in cross-section, whereby alternative bulk measurements (e.g., differential scanning calorimetry, x-ray diffraction) could be made in parallel. This approach benefitted immensely from our sample preparation of cross-section specimens, as clearly described by Bravman. Reference Bravman and Sinclair7 It was even not clear then that the epoxy involved in the preparation could withstand the higher temperatures, but this turned out not to be an issue. Parker showed that the rate of solid phase epitaxial regrowth of amorphized silicon showed the same kinetic behavior as that determined by high voltage electron microscopy and by Rutherford backscattering spectroscopy on the exact same samples. Reference Parker8,Reference Sinclair, Parker and Kim9 This and other examples of this type of work are reported in Reference 10, most notably Schwartzman’s observations of the atomic migration of atoms on CdTe surfaces at 500°C (e.g., Figure 1 ), which we had predicted earlier Reference Sinclair, Yamashita and Ponce4 to occur at elevated temperatures.
(a) Individual consecutive video frames (unprocessed) showing the disappearance (b) and reappearance (c) of individual atomic columns at {111} plane ledges during the dissociation of CdTe at a nominal temperature of 500°C. The time interval between the frames is one-thirtieth of a second. Reference Sinclair, Yamashita, Parker, Kim, Holloway and Schwartzman10 The partial removal of a (111) plane can be seen in the upper part of (c).

At this stage, we set up a series of guidelines to check the in situ HRTEM observations with the changes in bulk samples (e.g., beam off versus beam on, thin foil [e.g., 20 nm] versus thick foil [e.g., 200 nm]). The most sensitive among these is to measure the activation energy of a material reaction and to compare it with the bulk measurements, recognizing that a surface-dominated activation energy would be noticeably lower. Ko gives the most complete report of these procedures. Reference Ko and Sinclair11 Of course checking the data with those of other techniques is just standard good practice in science. In our experience, if artifacts arise, they are normally rather clear (e.g., Reference 9). However now, in the era of nanotechnology, it is just as important to document the actual behavior of nanomaterials so that nanoscale and bulk reactions are both worthy of study.
Solid-state amorphization
One of the most intriguing discoveries in the 1980s concerned the creation of amorphous phases by the interaction of two metals at multilayer interfaces. Reference Schwarz and Johnson12 Our work in this period was focused on semiconductor-metal interfaces, especially for metal contacts in integrated circuits. Therefore, it should not have been surprising that Ti-Si multilayers also showed a solid-state amorphization reaction, Reference Holloway and Sinclair13 and, that during the initial stages of silicidation, an amorphous barrier is first created at the crystalline silicon-titanium interface, resulting in high Schottky barrier height. Reference Ogawa, Yoshida, Kouzaki and Sinclair14 Holloway not only showed that this reaction could be followed by in situ HRTEM Reference Holloway and Sinclair15 but that it was common among many silicide-forming metal-silicon systems. Reference Holloway, Sinclair and Nathan16 Many prior studies of metal-semiconductor surfaces and interfaces had not reported this behavior, which lends support to the strength of direct HRTEM interface studies. Ko11 went on to demonstrate equivalent behavior at GaAs-Pt interfaces by in situ studies.
This type of reaction comes about by a lower free energy of the mixed amorphous phase over the two physically separated elements, as explained by Schwartz and Johnson. Reference Schwarz and Johnson12 Accordingly, it was intriguing to discover a similar behavior for Cu-Ta interfaces, which should show no such intermixing, Reference Kwon, Lee and Sinclair17 and in situ HRTEM demonstrated that the amorphous interface is a precursor to the transformation of the metastable beta-Ta phase, created by deposition, into the stable BCC form. Reference Lee, Kwon, Ryu and Sinclair18 As tantalum is a common diffusion barrier for copper metallization in integrated circuits, the interfacial reaction is, in this case, beneficial for adhesion of the two metals.
Metal-induced (mediated) crystallization
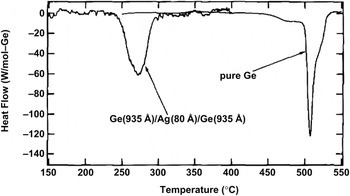
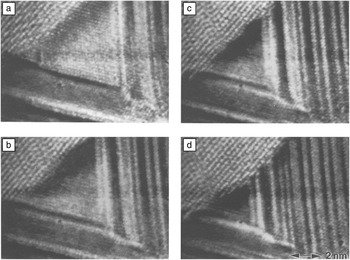
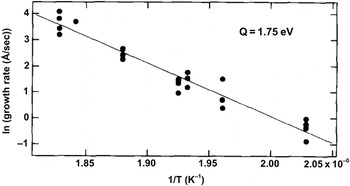
It was also interesting to contrast the reactions at silicide-forming interfaces with those where no interaction is expected, namely in simple eutectic systems such as Al-Si and Ag-Si. In situ HRTEM confirmed that no metastable, amorphous, liquid, or intermixed phases were created at the interface but rather that the initially amorphous semiconductor phase (e.g., a-Si, a-Ge) could be crystallized at abnormally low temperatures (e.g., Reference 19), as also demonstrated by differential scanning calorimetry ( Figure 2 ). Moreover, the in situ HRTEM definitively showed that this took place by diffusion of the semiconductor element into the metal, followed by supersaturation and precipitation of the semiconductor in its crystalline form. Reference Konno and Sinclair20,Reference Konno and Sinclair21 Kinetic measurements of the rate of crystal growth (e.g., Figure 3 ) showed the activation energy to be consistent with diffusion of the semiconductor element in the metal lattice ( Figure 4 ). Again, a survey of several such systems showed that this is a more general phenomenon, Reference Konno and Sinclair22–Reference Konno and Sinclair24 and even applies to the metal-induced graphitization of amorphous carbon. Reference Konno and Sinclair25 Likewise, a relatively rapid survey of several metal-carbon systems (e.g., Ni, Fe, Cr, Ti) is afforded by the in situ HRTEM approach, Reference Sinclair, Itoh and Chin26 with Itoh showing the role of either the pure metal (Co, Ni) or a metastable carbide phase (Fe, Cr) in mediating the graphitization process.
Differential scanning calorimetry profiles of a Ge/Ag/Ge trilayer film and a pure amorphous Ge thin film, heated at 10°C/min in an Ar atmosphere. Single exothermic peaks are observed in both cases, with that for the metal containing film occurring at a much lower temperature. Reference Konno and Sinclair21

High-resolution transmission electron microscopy video images of the reaction front in the Ge/Ag/Ge trilayer during in situ annealing at 250°C (time intervals (a–d) are 8 s each). The growth of the Ge crystal from the upper left takes place without moving the Ag lattice or the Ag stacking faults (dark lines) and can only arise from substitutional diffusion of Ge atoms in Ag, with Ag atoms counter-diffusing in the opposite direction. Reference Konno and Sinclair21

Arrhenius plot of the growth rate of the c-Ge phase in the Ge/Ag diffusion couple. Reference Konno and Sinclair21 The growth rates at each temperature were obtained from transmission electron microscope bright-field video recordings. The slope of the least-squares fit yields an activation energy of 1.75 ± 0.1 eV. It can be appreciated that a desired growth rate for in situ high-resolution transmission electron microscopy recordings can be established by precise specimen temperature control.

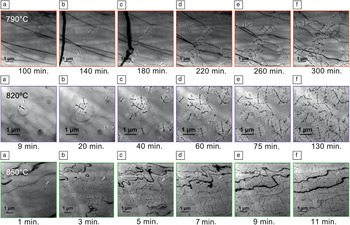
It should also be mentioned that the direct crystallization of amorphous materials can be effectively studied by in situ HRTEM. While we only were able to record one nucleation event in amorphous silicon thin films, in situ HRTEM showed the presence of many pre-existing crystal embryos and the stop-and-go nature of the crystal-amorphous interface migration. Reference Sinclair, Morgiel, Kirtikar, Wu and Chiang27 A more detailed study of crystallization in a potential high-k dielectric tantalum oxide, useful for integrated circuits, allowed a classical Avrami (Kolmogorov–Johnson–Mehl–Avrami) analysis of the in situ observations, with the added advantage of the ability to separate the nucleation events from the growth phase since all stages in the reaction are continuously recorded in the in situ experiment Reference Min, Sinclair, Park, Kim and Chung28 (e.g., Figure 5 ).
A montage of in situ transmission electron microscopy bright-field images of tantalum oxide taken at various times at nominal temperatures of 790°C (upper row), 820°C (middle row), and 850°C (lower row). Reference Min, Sinclair, Park, Kim and Chung28 Individual crystals can be identified by the appearance of crystalline bend contours within them (e.g., the thin dark lines are especially clear in the middle row). The amorphous oxide remains only partially crystallized at 790°C after five hours, but is completely crystallized in less than 10 minutes at 850°C. This is extremely important information for the process engineer.

Advanced integrated circuit materials
The traditional integrated circuit materials—silicon, silicon oxide, polysilicon, and aluminum—are being replaced by higher performing counterparts. We have applied in situ TEM studies to assess the behavior of the latter at elevated temperatures where many processing steps take place.
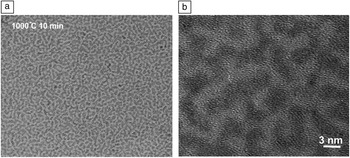
For new high-k gate oxide materials, the crystallization process is of most interest because the crystalline phase and its grain boundaries are likely to have different properties from those of the amorphous phase (the traditional amorphous SiO2 does not crystallize during the fabrication process). Following the work on tantalum oxide described previously, Reference Min, Sinclair, Park, Kim and Chung28 we have applied in situ HRTEM to HfO2 and Hf-Si-O mixtures. Reference Visokay, Chambers, Rotondaro, Shanware and Colombo29 Kang and Min showed that the former crystallizes at relatively low temperatures, while the mixed oxides remain amorphous up to 950°C, which was the limit of our heating holder. However, upon heating to 1000°C in a vacuum furnace, oxides in the mid-composition range of the HfO2-SiO2 system showed an interesting phase separation rather than crystallization of the hafnium silicate HfSiO4. The crystalline monoclinic HfO2 phase was interspersed on the nanoscale with amorphous SiO2 with a microstructure ( Figure 6 ) remarkably similar to that predicted by Cahn for spinodal decomposition of an isotropic amorphous material. Reference Cahn30 The addition of nitrogen during the deposition stabilizes the amorphous phase to higher temperatures. However, as pointed out by many authors, including Turnbull, Reference Seward, Uhlmann and Turnbull31 an isolated micrograph does not conclusively demonstrate a reaction mechanism: continuous in situ studies clearly overcome this deficiency.
(a) Lower magnification and (b) higher magnification high-resolution transmission electron microscopy images of a 40% HfO2 60% SiO2 amorphous oxide annealed ex situ at 1000°C, showing phase separation into crystalline HfO2 regions (darker) interspersed in amorphous SiO2 (lighter). In situ annealing up to 950°C did not yield any crystallization or phase separation behavior. The microstructure is remarkably similar to that predicted by Cahn Reference Cahn30 for spinodal decomposition in an isotropic solid.

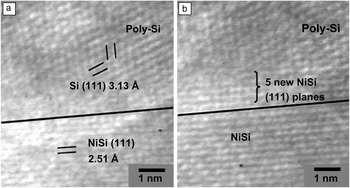
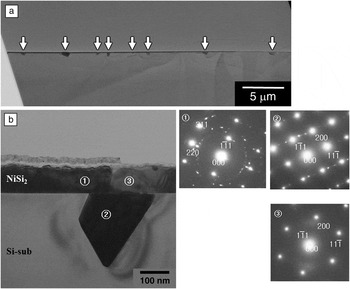
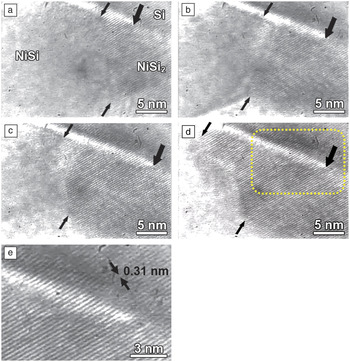
In the assessment of NiSi as a possible gate metal, we also studied its formation in situ by reaction of appropriate thicknesses of nickel/silicon thin films, made by Chambers, Visokay, and Colombo. Reference Yu, Lu, Mehrad, Bu, Shanware, Ramin, Pas, Visokay, Vitale, Yang, Jiang, Hall, Montgomery, Obeng, Bowen, Hong, Tran, Chapman, Bushman, Machala, Blatchford, Kraft, Colombo, Johnson and McKee34 In situ HRTEM directly showed that the mechanism of the reaction involves nickel diffusion through the silicide phase to react at the silicon interface, Reference Sinclair32 as the newly created silicide appears at the silicon interface of the diffusion couple ( Figure 7 ). Tu et al. Reference Nava, Weiss, Ahn, Smith and Tu33 deduced this earlier, but it had not been seen directly at atomic resolution before. However, Kim and Min made one of the most remarkable in situ observations when investigating the stability of a NiSi thin film across a thin 1.8 nm SiO2 gate oxide layer on a single crystal silicon wafer. At 950°C, breaks in the oxide layer resulted in conversion of the NiSi into the stable disilicide phase in contact with Si, resulting in NiSi2 spikes into the silicon (e.g., Figure 8 ). The conversion of NiSi into NiSi2 by the diffusion of Si across these breaks in the oxide, seen in situ ( Figure 9 ), immediately showed the mechanism of the reaction and the problem of using thin gate oxides in a thermodynamically unstable configuration. These results represent an extension of the boundaries within which in situ HRTEM is being applied, as the specimen is bright red hot inside the microscope, and the temperature is well above the ferromagnetic Curie temperature of the magnetic pole pieces of the TEM.
Individual video frames (a–b) taken one minute apart from an in situ high-resolution transmission electron microscope recording of the reaction between nickel and silicon thin films. The almost horizontal dark line in the middle of the images represents the original position of the product NiSi/silicon interface. The addition of five new NiSi (111) planes could be followed in the continuous recording, and their creation at the silicon interface demonstrates directly that nickel diffusion through the silicide represents the atomic mechanism for the reaction. Reference Sinclair32

Cross-sectional views of a formerly NiSi thin film on a (100) silicon substrate with a 1.8-nm-thick intervening SiO2 gate oxide, annealed in situ at 950°C. Selected area diffraction patterns from areas 1, 2, and 3 on the bright field image (b) and high-resolution transmission electron microscopy analysis show that both the metal film and the spikes into the substrate (arrows in (a)) are now the stable NiSi2 phase.

Individual video frames one second apart (a–d) from an in situ recording of the transformation of NiSi into NiSi2 by diffusion of Si from the substrate across a break in the SiO2 layer. The (111) planes of the product fluorite structure NiSi2 film can be seen to be epitaxial with the substrate Si (111) planes in the higher magnification view (e). The same position in the recordings is indicated with a thick arrow and is the position where the gate oxide becomes discontinuous. The location of the NiSi/NiSi2 interface is seen moving rapidly across the field of view in the continuous playback from lower right to upper left and is indicated by the smaller arrows.

Future outlook
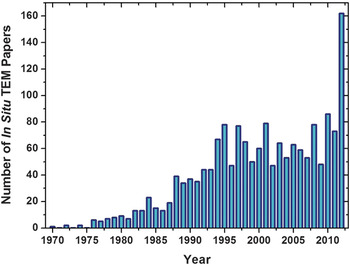
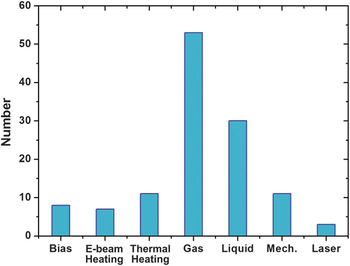
In situ HRTEM clearly benefits immensely from the advances in TEM performance provided particularly by lens aberration correction, although none of the above examples required this new capability. Reference Sinclair, Chin, Koh and Solorzano35 However, the field is developing much more rapidly with the increasing diversity of in situ experimentation. In preparing for this lecture, we carried out a quick computer survey, not exhaustive by any means, of the numbers of in situ TEM publications using the keywords “in situ” and “TEM.” Figure 10 shows the results: There were relatively few in situ TEM publications when our work was initiated in the 1980s, there was a noticeable increase in the 1990s, most likely associated with the proliferation of medium voltage TEMs (i.e., in the range of 200–400 kV), a steady rise since then, and a remarkable jump in the most recent year. An analysis of the papers presented at the 2012 Microscopy and Microanalysis Conference in Phoenix, AZ and at the European Microscopy Congress in Manchester, UK, revealed the reason by placing them into their approximate categories ( Figure 11 ): There is both a wide range of in situ experiments, from heating and cooling to mechanical deformation and electrical testing, but the biggest new contribution is in the control of the specimen environment, be it liquid or gas. This is not an isolated data point, but it represents a real trend in the broadening of the field.
Number of publications identified using the keywords “in situ” and “TEM,” showing a steady increase over the last 20 years and a marked increase in 2012.

Breakdown by various subcategories of in situ papers presented at the 2012 Microscopy and Microanalysis Conference (USA) and the 2012 European Microscopy Conference (UK). These subcategories are in situ electrical biasing, electron beam heating, thermal heating, gaseous environment, liquid environment, mechanical loading, and laser stimulation.

For the interested reader, some representative examples include the study of supported metal particle catalysts in gases, Reference Boyes and Gai36 the behavior of ceria catalyst particles under gaseous redox reaction, Reference Crozier, Wang and Sharma37 the direct observation of carbon nanotube formation at atomic resolution Reference Helveg, Lopez-Cartes, Sehested, Hansen, Clausen, Rostrup-Nielsen, Abild-Pedersen and Nørskov38 in a CH4:H2 gas mixture, the electrodeposition of copper from a liquid solution (0.2 M CuSO4 + 0.05 M H2SO4), Reference Williamson, Tromp, Vereecken, Hull and Ross39 the lithiation and delithiation of silicon nanoparticles, Reference McDowell, Ryu, Lee, Wang, Nix and Cui40 and the oxidation of carbon nanotubes in pure oxygen. Reference Koh, Gidcumb, Zhou and Sinclair41 While far from being a complete listing, this illustrates the type of work being carried out and contemplated for the future. The trend is promoted by the greater availability of commercial environmental TEMs with aberration correction and by the design and introduction of specialty specimen holders, which are capable of fairly sophisticated local testing (e.g., mechanical or electrical probing) in addition to environmental control beyond simple heating and cooling.
From the point of view of the TEM instrument itself, the vast majority of experiments are still being carried out in “TEM mode” (i.e., using a broad illuminating beam recording the changes simultaneously over a representative area on the sample). With the much faster scanning rates afforded by probe aberration corrected STEMs, I expect high-angle annular dark field in situ experiments to become more prominent, especially for thermally activated processes, whereby the reaction rate can be adjusted to match the recording rate simply by precise specimen temperature control. Likewise, with atomic resolution chemical mapping achievable both in electron energy loss and x-ray energy dispersive spectroscopic modes, local changes in chemical composition can be monitored as reactions occur or as the material is being processed in situ. Faster recording devices that are becoming available commercially Reference Contarato, Denes, Doering, Joseph and Krieger42 will increase the rate/speed at which changes can be followed, albeit at the expense of a huge rise in data accumulation, and dynamic experiments at nano-second rates by laser pulsing the electron source are also expected to play an increasing role in the breadth of in situ TEM experiments. Reference Kim, LaGrange, Reed, Taheri, Armstrong, King, Browning and Campbell43 All of these approaches are assisted by the ever improving performance of commercial TEMs, as illustrated by image and electron probe aberration correction, but by no means are in situ experiments confined to the most advanced instruments. The excitement of observing new or unexpected phenomena can be experienced at any level of magnification: HRTEM is only required for atomic scale observations.
Concluding remarks
By following and recording material reactions at the atomic level, in situ high-resolution transmission electron microscopy clearly provides unique direct information not available by any other technique. When the experiment is carefully set up, a broad data set can be accumulated, which might otherwise take months of work by conventional high-resolution examination of a series of samples. Our research has focused on thermally activated reactions in which exact temperature control is a key feature. However, with the design of new special specimen holders combined with the continuing improvement of the transmission electron microscope (for instance through aberration correction), the breadth of possibilities is only limited by the imagination and creativity of the observer. It can be expected that much fundamental knowledge on material behavior will be generated, both for bulk and nanoscale materials, at increasing levels of resolution both spatially and temporally.
Acknowledgments
The author would like to thank the Materials Research Society and his nominators for the honor of presenting the Turnbull lecture. The work described has been carried out by a series of graduate research students and some postdoctoral researchers in his group, and none of this would have been possible without their individual and collective hard work, perseverance, and ingenuity. A selection of in situ work has been cited herein, but many others made notable contributions, both directly and indirectly. The author would also like to thank Sang Chul Lee for considerable assistance in assembling this article.

Robert (“Bob”) Sinclair is a professor and chair of the Department of Materials Science and Engineering at Stanford University. He received his degrees in materials science from Cambridge University and came to the United States in 1973 as a postdoctoral researcher at the University of California, Berkeley. He joined the faculty at Stanford in 1977, where he has been ever since. He has had several visiting positions internationally, including Grenoble, Cambridge, and Matsushita Industrial Semiconductor Research Center in Osaka. His research has involved application of high-resolution electron microscopy to study various processes in materials, and this culminated in the Distinguished Scientist Award (Physical Sciences) of the Microscopy Society of America in 2009. Sinclair has been director of the Stanford Nanocharacterization Laboratory, a university-wide user facility, since its inception in 2002 until the end of 2012, and was chair of a National Research Council committee to study “Midsize Facilities: The Infrastructure for Materials Research,” which was published in 2006. Sinclair can be reached by email at bobsinc@stanford.edu.