Introduction
Nowadays, the penetration of pharmaceuticals such as antibiotic agents into the environment and ecosystems, in both highly industrialized and developing countries, is one of the major environmental and public health issues that both industrials and public authorities need to face up to [Reference Kummerer1, Reference Kummerer2]. Sulfonamides such as sulfathiazole (STZ) are an important family of antibiotics that are still commonly used in human and veterinary medicine [Reference Sukul and Spitteler3, Reference Baran, Sochacka and Wardas4, Reference Baran, Adamek, Ziemiańska and Sobczak5].
For instance, STZ is particularly used in livestock production and may potentially be released into the environment. As a result, water, soil and food can be contaminated by antibiotic resistant microorganisms and cause a serious public health issue [Reference Holtslander6]. Therefore, there is a great interest today to develop efficient and cost-effective techniques and materials to remove such pollutants from water and environment. Among the developed techniques, photocatalysis is recognized as the most attractive and promising one mainly thanks to the fact that the photocatalytic process is renewable energy-based. Photocatalytic degradation of organic pollutants can actually use sunlight as an irradiating source. The interaction between the photocatalyst and the incident light typically triggers accelerated photochemical reactions, which results in the formation of electron–hole pairs (h+, e−). This charge moves to the surface of the photocatalyst and reacts with H2O and O2. These reactions induce the production of highly reactive oxygen species (ROS), such as OH radicals (•OH) and superoxide radicals (•O2−), on the surface of the photocatalyst [Reference Hoffmann, Martin, Choi and Bahnemann7]. Due to their strong and non-selective oxidizing properties, ROS can damage almost all types of organic molecules [Reference Hoffmann, Martin, Choi and Bahnemann7, Reference Jiang, Ma, Zhao, Chen, Cui, Yu and He8]. Zinc oxide (ZnO) and titanium dioxide (TiO2) semiconductors have been intensively studied over the last two decades and thus are the most popular photocatalysts [Reference Hoffmann, Martin, Choi and Bahnemann7, Reference Jiang, Ma, Zhao, Chen, Cui, Yu and He8, Reference Wang, Peng, Li, Zhao and Fu9, Reference Zhang, Wang, Xiao, Liu, Xu and Du10, Reference Li, Zhu, Wang, Min, Fang, Huang and Wu11, Reference Xu, Shi, Xu, Yang, Bai, Song and Chen12, Reference Shen, Zhao, Qian, Peng and Fu13, Reference Wang, Liu, Huang, Wu and Shan14, Reference Qian, Zhao, Shen, Zhang, Peng and Fu15, Reference Challagulla and Roy16, Reference Li, Tao, Li, Liu and Zhang17, Reference Li, Han, Wang, Zheng, Wan and Ni18, Reference Atla, Chen, Chen, Shih, Lin, Chung and Chang19, Reference Zhang, Wang, Liu and Li20]. ZnO has been particularly studied for the removal of contaminants from air and water [Reference Jassby, Budarz and Wiesner21, Reference Hong, Tian, Jiang, Wu, Zhang, Tian and Fu22] and for microbial disinfection [Reference Barnes, Molina, Xu, Dobson and Thompson23, Reference Rekha, Nirmala, Nair and Anukaliani24].
However, ZnO is still far from being efficient in photocatalysis since only about 5% of the solar light can be used by ZnO during the photocatalysis process, while visible light (∼48%) and near infrared (NIR) light (∼44%) cannot be efficiently absorbed and used by the semiconductor [Reference Jiang, Ma, Zhao, Chen, Cui, Yu and He8]. This is because pure ZnO is a wide band gap material (E g = 3.37 eV at room temperature) and can only be activated by ultraviolet (UV) light (i.e., wavelength around 385 nm or lower) so that the e−/h+ charge formation/separation can occur. Moreover, the recombination rate of photogenerated electrons and holes within ZnO is too high, which results in low diffusion of charge carriers from the bulk to the surface of ZnO and thus reduces the photocatalytic efficiency of the pure ZnO semiconductor [Reference Chouchene, Ben Chaabane, Balan, Girot, Mozet, Medjahdi and Schneider25].
In order to address these issues, two approaches have been proposed in the literature. One consists in doping the ZnO by introducing metals (Al, Mn, Cu, Co, etc.), non-metal (C, S, N, etc.) or rare earth elements (Sm, La, Gd, Ce, etc.) into the ZnO crystal lattice [Reference Dong, Feng, Fan, Pi, Hu, Han, Liu, Sun and Sun26, Reference Ullah and Dutta27, Reference Gouvêa, Wypych, Moraes, Durán and Peralta-Zamora28, Reference Ahmad, Ahmed, Zhang, Khalid, Xu, Ullah and Hong29, Reference Liu, Li, Yu and Xiang30, Reference Barick, Singh, Aslam and Bahadur31, Reference Achouri, Corbel, Balan, Mozet, Girot, Medjahdi, Ben Said, Ghrabi and Schneider32, Reference Yayapao, Thongtem, Phuruangrat and Thongtem33, Reference Yang, Liu, Fu, Ma, Ma, Dong, Zhang and Zhang34]. The doping of ZnO introduces deep level impurities in ZnO band gap and thus displaces its absorption to the visible range. Furthermore, it produces traps for photogenerated charge carriers, which results in decreasing the recombination rate of electron–holes and improves charge diffusion from the bulk to the surface of the photocatalyst particle. Doping strategy was also applied to enhance the visible light photocatalytic activity of TiO2 semiconductor [Reference Wada, Yokomizo, Yogi, Katayama, Tanaka, Kojima and Ozutsumi35, Reference Li, Zhao, Shindume, Huang and Peng36, Reference Yan, Chen, Zou and Wang37].
The other approach proposes the coupling of ZnO with other semiconductors such as Fe2O3, CdS, TiO2, Ag2S, Bi2S3, PbS, etc., also called sensitizers. The sensitizers are generally selected from the narrow energy band gap materials and designed to help the photogenerated charge of the sensitizer to be easily injected into the ZnO conduction band [Reference Bora38, Reference Vogel, Hoyer and Weller39, Reference Achouri, Corbel, Aboulaich, Balan, Ghrabi, BenSaid and Schneider40, Reference Li, Jiang, Zhang, Zhang and Pan41, Reference Khanchandani, Kundu, Patra and Ganguli42]. This results in longer charge separation and improved photocatalytic activity. Recently, light converting phosphors have also been proposed as sensitizers for ZnO. Both down-converting phosphors (DCP), which absorb light of high energy photons to emit light of lower energy photons, and up-converting phosphors (UCP), which absorb light of low energy to emit light of higher energy photons, have attracted significant attention for photocatalysis [Reference Liu, Chu, Li, Niu, Li, Li, Pan and Sun43].
In practice, UCP materials absorb visible light or NIR and then emit UV or visible light that can be easily absorbed by the semiconductor to produce more electron–hole pairs, which helps the photocatalyst to provide more actives surface sites for ROS. For example, it was found that Er3+ doped YAlO3/ZnO composite with 6 wt% of YAlO3:Er3+ exhibits higher photocatalytic degradation rate (86%) of acid red B at 60 min under solar light irradiation when compared to pure ZnO (69%) [Reference Wang, Xie, Zhang, Li, Chen, Zhang, Xu and Zhang44]. It was also demonstrated that DCP, such as Y2O2S:Eu3+, NaSrBO3:Tb3+, and Lu3(Al,Si)5(O,N)12:Ce3+, can effectively enhance the visible light photocatalytic activity of the wide band gap ZnO semiconductor for the photocatalytic degradation of dyes [Reference Khanchandani, Kundu, Patra and Ganguli42, Reference Chu, Liu, Liu, Lei, Li, Wu, Li, Li and Pan45, Reference Liu, Pan, Li, Yu, Sun and Sun46, Reference Liu, Wang, Li, Li, Pan, Zhang, Min, Sun and Sun47]. The enhancement of the visible light photocatalytic activity of ZnO/DCP was ascribed to the self-degradation of the dye by excessive exposure to light, on the one hand, and to the enhancement of electron–hole charge separation, on the other hand [Reference Liu, Chu, Li, Niu, Li, Li, Pan and Sun43].
Although the contribution of the self-degradation of the dye into the photocatalytic process was already demonstrated in the literature [Reference Liu, Chu, Li, Niu, Li, Li, Pan and Sun43], the role of DCP in the enhancement of electron–hole pair separation/migration within ZnO semiconductor is not well established so far. Indeed, organic dyes are systematically used as a pollutant model in most reported studies. The first successful association of DCP nanoparticles (NPs) with ZnO NCs to enhance the photocatalytic removal of other kinds of pollutants, like antibiotics, has been demonstrated in our recent report [Reference Zammouri, Aboulaich, Capoen, Bouazaoui, Sarakha, Stitou and Mahiou48]. We indeed reported that Ce-doped Lu3Al5O12 NPs/ZnO nanostructure (LuAG:Ce/ZnO NS) with 1:1 weight ratio showed much higher photocatalytic degradation rate compared to pure ZnO NCs [Reference Zammouri, Aboulaich, Capoen, Bouazaoui, Sarakha, Stitou and Mahiou48]. However, the effects of DCP/ZnO weight ratio and phosphor particle size on the photocatalytic efficiency of the composite have never been studied. The effect of such parameters on the photocatalytic performances of ZnO semiconductor, under UV-vis and visible light, needs however to be studied to better discern how each parameter can change the photocatalytic efficiency of the composite. Furthermore, this approach should be extended to other kinds of DCP NPs.
In the present study, we first report a successful synthesis of highly homogenous YAG:Ce/ZnO core/shell NPs (YAG:Ce/ZnO CSN) starting from YAG:Ce NPs and zinc acetate in ethanol solvent. The characterization of the physicochemical properties of the as-prepared NPs has been provided and discussed. Then, the photocatalytic efficiency of the materials for the removal of STZ was evaluated under both UV-vis and visible light. The results have been systematically compared to the pure ZnO NCs. The effects of YAG:Ce particle size and ZnO/YAG:Ce weight ratio on the structural, morphological and photocatalytic properties of the photocatalyst have also been investigated. Finally, the recyclability of YAG:Ce/ZnO CSN based photocatalyst was also evaluated through a multiple photo-decomposition cycles of STZ.
Results and discussion
Preparation of Ce-doped YAG NPs (YAG:Ce NPs)
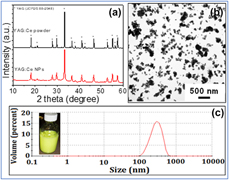
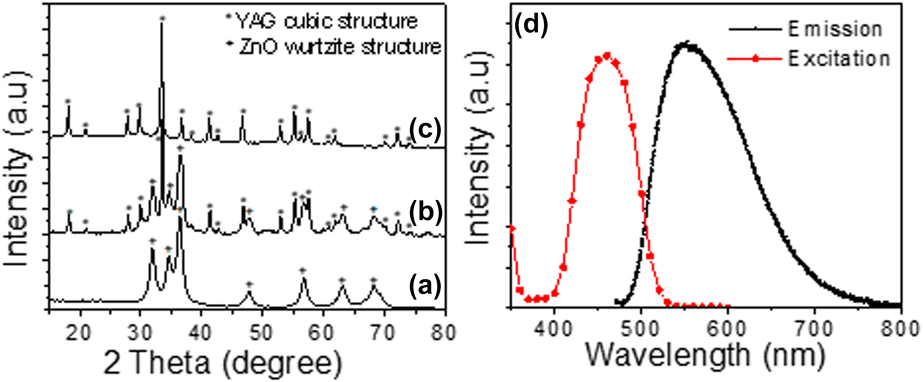
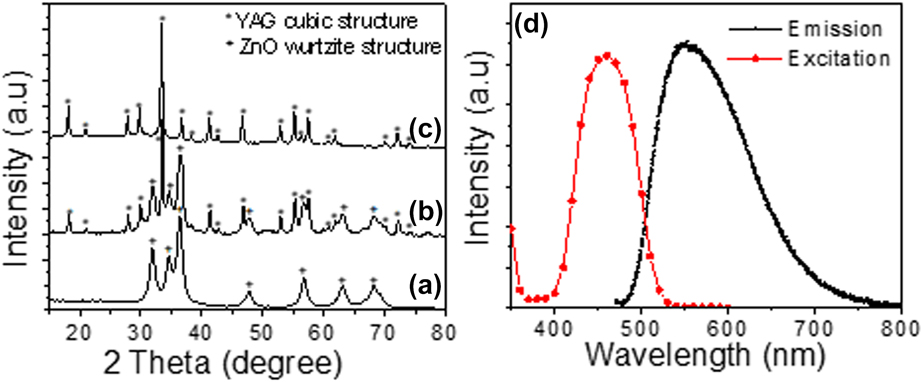
The YAG:Ce NPs have been made via a top–down approach starting from commercialized YAG:Ce phosphor microparticles (D50 = 14 µm) using the high-energy ball milling technology. This technology was found to yield highly stable and homogenous YAG:Ce NPs with narrow particle size distribution as shown in Fig. 1(c). The observation of the as-prepared YAG:Ce NPs by transmission electron microscope (TEM) [Fig. 1(b)] showed the formation of well-dispersed NPs with low degree of agglomeration. Moreover, the average particle diameter measured from TEM image was about 100 nm while the average particle size measured by dynamic light scattering (DLS) was two times larger (about 230 nm) since the DLS particle size corresponds to the hydrodynamic diameter which includes the size of both particle core and solvation layer surrounding the particle. The crystallinity of the as-prepared YAG:Ce NPs was demonstrated by XRD as shown in Fig. 1(a). All diffraction peaks correspond to the pure Y3Al5O12 phase (JCPDS file 88-2048) indicating that the high-energy ball milling does not modify the original structure of YAG. In addition, no contamination with zirconia was observed. It is worth-noting that the diffraction lines of YAG:Ce NPs are broader when compared to those of initial YAG:Ce microparticles, which is consistent with the formation of YAG:Ce NPs as shown by TEM [Fig. 1(b)]. The crystallite size of YAG:Ce NPs was estimated from the full-width at half maximum (FWHM) of the XRD lines using the Debye–Scherrer’s equation [Reference Cullity and Stock53] and found to be around 100 nm, which is in agreement with the TEM results. Figure 2(d) shows photoluminescence excitation (PLE) and emission spectra of the as-prepared YAG:Ce NPs. The photoluminescence (PL) emission spectrum of the phosphor NPs consists of a broad band in the green–yellow range with a maximum located around 550 nm. The emission is ascribed to the electron transitions from the lowest crystal-field splitting component of the 5d level to the ground state of Ce3+. PLE spectrum showed a large excitation bands centered at about 455 nm, which is characteristic of YAG:Ce phosphor [Reference Blasse and Grabmaier54].
(a) XRD patterns of commercialized YAG:Ce powder and YAG:Ce NPs, (b) TEM image, and (c) particles size distribution measured by DLS of YAG:Ce NPs. Inset of (c) is a photograph of the as-prepared YAG:Ce NPs suspension.

XRD pattern of (a) ZnO NCs, (b) YAG:Ce/ZnO 1/1 CSN, and (c) YAG:Ce NPs. (d) Excitation and emission spectra of YAG:Ce NPs. Emission spectrum is recorded upon 460 nm excitation.
Synthesis of YAG:Ce/ZnO CSN
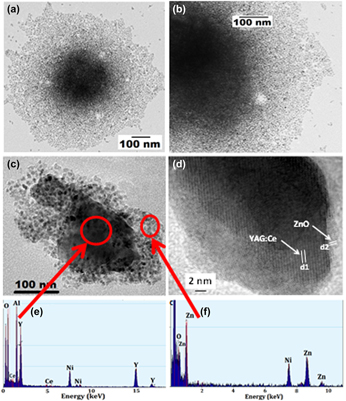
Figures 2(a)–2(c) show the XRD pattern of as-prepared ZnO NCs, YAG:Ce/ZnO 1/1 CSN, and YAG:Ce NPs, respectively. The experimental procedure for ZnO NCs synthesis was described in details in our previous reports [Reference Aboulaich, Tilmaciu, Merlin, Mercier, Guilloteau, Medjahdi and Schneider55]. All the samples, including ZnO NCs, have been calcined at 500 °C/2 h before characterization and application in photocatalysis study. It can be seen from the XRD patterns that all the samples are well crystallized. The broadening of the ZnO diffraction lines is ascribed to the small ZnO crystallite size that was found to be about 15 nm using Debye–Scherrer formula. This value is consistent with the particle size measured from TEM images [Fig. S3(a), Supplementary material] and indicates that the ZnO NCs are monocrystalline. All the diffraction peaks showed by ZnO NCs correspond to the hexagonal wurtzite structure (JCPDS Card No. 80-0075). The XRD pattern of YAG:Ce/ZnO 1/1 CSN shows the coexistence of YAG:Ce NPs and ZnO NCs within the material. In order to confirm the formation of core/shell structure and investigate the particle size, structure as well as chemical composition of the heterostructure, YAG:Ce/ZnO 1/1 CSN are observed by TEM and high resolution transmission electron microscope (HRTEM) coupled with energy-dispersive X-ray spectroscopy (EDS) measurements. A representative TEM image of a single YAG:Ce/ZnO NP before 500 °C treatment is given in Figs. 3(a) and 3(b).
(a) TEM and (b) high magnification TEM image of YAG:Ce/ZnO 1/1 CSN before calcination at 500 °C. (c) TEM and (d) HRTEM images of a single YAG:Ce/ZnO 1/1 CSN and (e, f) the corresponding EDS spectra.

The TEM images [Figs. 3(a) and 3(b)] clearly reveal the formation of a core/shell NP with a dark core and bright shell. The EDS spectra [Figs. 3(e) and 3(f)] of the as-prepared YAG:Ce/ZnO CSN show that the dark core is highly enriched with YAG:Ce elements while the bright shell area is dominated by Zn and O elements. We should note that the Ni peaks in the EDS spectra are due to the Ni-grids used for TEM observation. In addition, a representative HRTEM image taken on YAG:Ce/ZnO 1/1 CSN sample [Fig. 3(d)] shows the distance between the adjacent lattice fringes within the core and shell to be 4.99 Å (d1) and 2.47 Å (d2), respectively. These values are consistent with the spacing of (211) planes in the YAG cubic structure and (101) planes in the ZnO hexagonal wurtzite structure, respectively. These results thus confirm the formation of YAG:Ce/ZnO core/shell NPs.
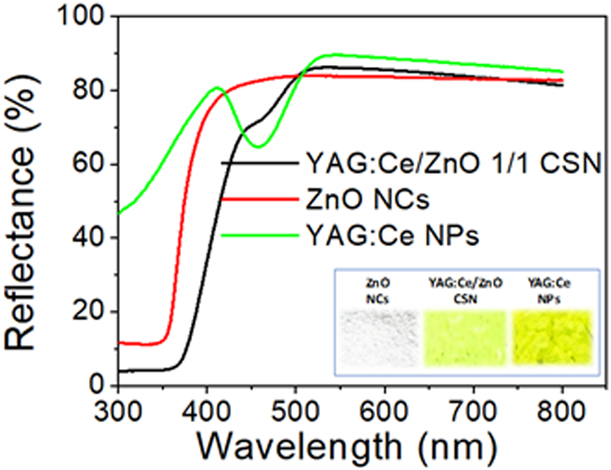
Diffuse reflectance UV-vis spectra of pure ZnO NCs, YAG:Ce NPs and YAG:Ce/ZnO CSN samples are presented in Fig. 4. The photographs of the corresponding nanopowders are also provided in the inset of Fig. 4. It can be seen from diffuse reflectance spectra that ZnO NCs have no absorption in the visible light due to its wide band gap while YAG:Ce/ZnO CSN have extended optical absorption in the 400–550 nm visible range when compared to the pure ZnO NCs. This extended optical absorption of ZnO NCs to the visible light, when coupled with YAG:Ce NPs, may suggest that YAG:Ce NPs could enhance the visible light photocatalytic activity of ZnO NCs since more photons can now be absorbed by the photocatalyst and used for producing more ROS during the photocatalysis process.
Diffuse reflectance UV-vis spectra of ZnO NCs, YAG:Ce NPs, and YAG:Ce NPs/ZnO CSN. Inset shows a photograph of the corresponding nanopowders.

Moreover, FTIR spectra (Fig. S4, Supplementary material) showed that the characteristic FTIR peaks of YAG:Ce NPs (784, 719, and 686 cm−1) [Reference Aboulaich, Deschamps, Deloncle, Potdevin, Devouard, Chadeyron and Mahiou56] are shifted to higher wavenumbers in YAG:Ce/ZnO CSN, which could indicate that the first ZnO NCs layer is closely linked to the surface of YAG:Ce NPs through a covalent bonds. This heterojunction is highly beneficial and could potentially help photons to be transferred from the nano-phosphor to ZnO NCs, which could allow for more photogenerated e−/h+ carrier and thus improve the photocatalytic activity of the semiconductor.
Based on these results, the growth mechanism of ZnO shell over YAG:Ce core NPs can be illustrated by the schema of Fig. S5 (Supplementary material). The formation of the first ZnO NCs layer would start with the adsorption of zinc acetate precursors on the surface of YAG:Ce NPs. The hydrolysis/condensation of zinc acetate on the surface of YAG:Ce particles will result in the formation of strongly linked ZnO clusters to the surface of YAG:Ce NPs. A strong M-O-Zn (M = Al, Y) bonds can actually be made between the surface groups of YAG:Ce NPs and ZnO NCs, which will result in the formation of Zn–O domains at the periphery of YAG:Ce NPs. In our case, the growth of ZnO NC is controlled by oleic acid, which is also used to stabilize the ZnO particles against aggregation. When ZnO NCs achieve a certain critical diameter (i.e., 10 nm), the growth of ZnO NCs stops and a new zinc acetate adsorption/hydrolysis–condensation cycle restarts on the surface of the first ZnO layer, which leads to the formation of a second ZnO NCs layer, and so on. The growth of ZnO NCs shell will stop when no more zinc acetate and TMAH solutions will be injected into the reactor.
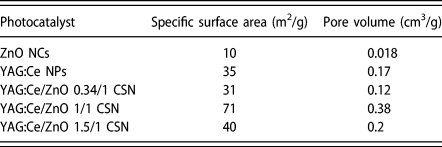
Since the specific surface area of photocatalysts plays an important role in affecting the photocatalytic reactions, we also measured the Brunauer–Emmett–Teller (BET) specific surface area and pore volume of the as-prepared ZnO NCs and YAG:Ce/ZnO CSN of different YAG:Ce/ZnO weight ratios. The results are given in Table I. The table shows that the specific surface area of pure ZnO NCs is relatively low (10 m2/g). Results also interestingly show that the specific surface area increases by increasing YAG:Ce NPs loading until the YAG:Ce/ZnO weight ratio reaches 1/1. However, when the weight ratio exceeded 1/1, the specific surface area decreases again and drops from 71 m2/g (for 1/1 weight ratio) to only 40 m2/g in YAG:Ce/ZnO CSN with 1.5/1 weight ratio.
Specific surface area and pore volume of ZnO NCs, YAG:Ce NPs and YAG:Ce/ZnO CSN with different weight ratios.

The low surface area of pure ZnO NCs can be ascribed to the high degree of ZnO particles aggregation after 500 °C calcination, which may result from the small particle size and the high density of Zn–OH surface groups. This is supported by the TEM images taken on pure ZnO NCs after 500 °C calcination, which showed the formation of big and dense particles of few hundreds of nm [Fig. S3(b), supplementary material online]. The higher surface area of YAG:Ce/ZnO CSN is likely due to the fact that the growth of ZnO NCs on the surface of YAG:Ce NPs makes the ZnO particles homogenously dispersed within the composite, which prevents the ZnO NCs from aggregation and results in much less aggregates and higher surface area. In addition, it was found that YAG:Ce/ZnO CSN have a type IV isotherm (Fig. S6, Supplementary material) with H2 hysteresis loop according to the IUPAC classification [Reference Brunauer, Emmett and Teller51], which is characteristic of mesoporous materials. Since ZnO NCs and YAG:Ce NPs are nonporous materials, the mesopores are probably due to the formation of interparticles cavities after drying/agglomeration of the corresponding particles and the formation of nanopowder. This isotherm type does not exhibit any limiting adsorption at high P/P 0 and is commonly reported in the literature where aggregates of NPs with irregular shape and morphology are made [Reference Sing, Everett, Haul, Moscou, Pierotti, Rouquerol and Siemieniewska57, Reference Hitkari, Singh and Pandey58, Reference Do, Giang, Do, Pham and Ho59].
Based on the specific surface area measurement results, YAG:Ce/ZnO 1/1 CSN are supposed to yield the highest photocatalytic activity. To verify this, the photocatalytic efficiency of YAG:Ce/ZnO CSN with different weight ratios was evaluated through the photocatalytic degradation of STZ under UV-vis and visible light. The results are presented in the next section.
Photocatalytic activity study
Effect of YAG:Ce NPs/ZnO weight ratio
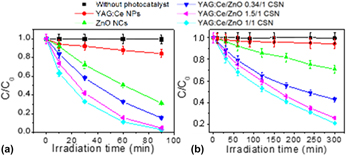
The effect of YAG:Ce/ZnO weight ratio on the photocatalytic degradation of STZ under UV-vis and visible light was first investigated. The Fig. 5 provides the photodegradation curves of STZ without and with the presence of pure YAG:Ce NPs, pure ZnO NCs, and YAG:Ce/ZnO CSN of 0.34/1, 1/1, and 1.5/1 weight ratios, respectively. The C/C 0 ratio was used to represent the degradation rate, where C and C 0 are the STZ concentrations at times t and 0, respectively.
Evolution of STZ conversion (C/C 0) versus irradiation time under (a) UV-vis and (b) visible light. An error bar of 5% is included.

C 0 was 1 × 10⁻⁴ M while C was calculated by integrating the area under the high-performance liquid chromatography (HPLC) signal at about 6.7 min which corresponds to the retention time of STZ molecule. The HPLC chromatogram obtained from the aqueous solution of STZ containing YAG:Ce/ZnO 1/1 CSN, at different irradiation times, is provided in Fig. S7 (Supplementary material).
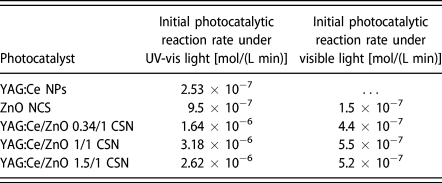
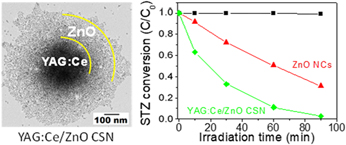
First of all, in the absence of photocatalyst, results show that even though STZ is irradiated with UV-vis or visible light over a long period of time, the molecule does not reveal any sign of degradation. Results also showed that the degradation of STZ is very slow when only pure YAG:Ce NPs are present in the medium. However, the results show that STZ undergoes a rapid degradation in the presence of ZnO NCs and YAG:Ce/ZnO CSN. Interestingly, it was found that the photocatalytic decomposition of the molecule was even higher, under both UV-vis and visible light, in the presence of YAG:Ce/ZnO CSN when compared to pure ZnO NCs whatever the YAG:Ce/ZnO weight ratio. For instance, under UV-vis irradiation, the decomposition of STZ in the presence of YAG:Ce/ZnO 1/1 CSN was found to be about 98% at 90 min light exposure while the degradation remained limited to 70% with pure ZnO NCs. Under visible light exposure, about 80% of STZ were decomposed within 5 h while only 30% degradation was achieved with ZnO NCs at the same irradiation time. Table II also shows that the initial photocatalytic reaction rate of STZ in the presence of YAG:Ce/ZnO 1/1 CSN is at least 3 times higher when compared to ZnO NCs whether UV-vis or visible light is used. This result confirms once again the role of YAG:Ce NPs in enhancing the photocatalytic efficiency of ZnO semiconductor under both UV-vis and visible light.
Initial photocatalytic reaction rate (ν) of the degradation of STZ in UV-vis and visible light using the as-prepared photocatalysts. ν was calculated from the slope of the best-fit line through the plotted C (concentration of STZ) versus irradiation time.

By the way, the ln (C 0/C t) plots (Fig. S8, Supplementary material) show a linear relationship with the irradiation time, which suggests that the photodegradation of STZ occurs via a pseudo-first-order kinetic reaction ln (C 0/C t) = −kt, where k is the photodegradation rate constant (min−1), and C 0 and C t are the concentrations of STZ at times 0 and t, respectively. The rate constants k calculated from the slope of the ln (C 0/C t) versus time lines, for the photodegradation of STZ under UV-Vis light, were found to be 0.01286, 0.02056, 0.03859, and 0.03408 min−1 for ZnO NCs, YAG:Ce/ZnO 0.34/1, YAG:Ce/ZnO 1/1, and YAG:Ce/ZnO 1.5/1 CSN, respectively.
Results also show that YAG:Ce NPs loading has a significant impact on the initial photocatalytic degradation rate of STZ that was higher with 1/1 weight ratio. This result clearly indicates that the photocatalytic degradation of STZ can be enhanced by optimizing the shell thickness of ZnO around YAG:Ce NPs. The result is also consistent with the specific surface area measurements that showed higher specific surface area with 1/1 weight ratio (71 m2/g). High surface area can actually promote the STZ adsorption on the surface of the photocatalyst and lead to faster decomposition of the molecule by a direct reaction with the photo-induced holes at the surface of the photocatalyst [Reference Liu, Chu, Li, Niu, Li, Li, Pan and Sun43].
However, although the initial photocatalytic degradation rate with YAG:Ce/ZnO 1/1 CSN was higher, it can be seen from Fig. 5 that its final STZ degradation rate was very close to that of YAG:Ce/ZnO 1.5/1 CSN. Since the specific surface area discrepancy between these two photocatalysts is high, this could mean that the specific surface area might not be the only reason that can fully explain the enhancement of the photocatalytic activity under UV-vis and visible light with YAG:Ce/ZnO CSN. Based on these results, we believe that the growth of ZnO NCs at the surface of YAG:Ce NPs and the creation of high quality phosphor/ZnO NCs heterojunction play a critical role in reducing the recombination of photogenerated e−/h+, which improves the photocatalytic activity of ZnO semiconductor. This statement is supported by the PL spectra recorded on ZnO NCs and YAG:Ce/ZnO 1/1 CSN (Fig. S9, Supplementary material). The emission spectra were recorded at 365 nm excitation. PL spectrum of ZnO NCs shows two broad bands centered at 424 nm and 550 nm. The visible light emissions are commonly observed in the literature with ZnO NCs and generally attributed to different intrinsic defects such as oxygen vacancies (VO), zinc vacancies (VZn), zinc interstitials (Zni), etc. The emission at 424 nm is likely due to the electron transition from shallow donor level formed by Zni to the top of valence band [Reference Fan, Lian, Zhao and Liu60, Reference Reddy, Reddy, Krishna, Nagabhushana and Gopal61]. Results show that the intensity of the blue emission at 424 nm significantly decreases in YAG:Ce/ZnO CSN that exhibit a new broad PL band at 560 nm, attributed to YAG:Ce NPs. This result suggests that the recombination rate of electrons and holes within ZnO NCs decreases, which results in low PL intensity. The result is then consistent with the photocatalytic activity enhancement of ZnO/YAG:Ce CSN compared to pure ZnO NCs.
By the way, it was found that hydroxyl radicals play a crucial role during the Fenton-based photocatalytic degradation of STZ [Reference Velásquez, Santander, Contreras, Yáñez, Zaror, Salazar, Pérez-Moya and Mansilla62] and could be at the origin of the photodecomposition of the molecule by our photocatalyst. The role of YAG:Ce NPs in enhancing the formation of hydroxyl radicals will be further investigated using disodium terephthalate (DST) assay.
DST assay and recyclability study
The formation of hydroxyl radicals (•OH) by pure ZnO NCs and YAG:Ce/ZnO CSN, under visible light irradiation, was demonstrated using a •OH radical-specific fluorimetric assay. This assay consists of the reaction of •OH radicals with DST to form the fluorescent 2-hydroxyterephthalate anion (2-OH-DST), which emits at 428 nm [Reference Bohne, Faulhaber, Giese, Hafner, Hofmann, Ihmels, Kohler, Pera, Schneider and Sheepwash49, Reference Ipe, Lehning and Niemeyer50], according to the following reactional scheme:
 $${{\rm{H}}_{\rm{2}}}{\rm{O}} + h\nu \;\mathrel{\mathop{\kern0pt\longrightarrow}\limits_{{\rm{photocatalyst}}}^{ - {{\rm{H}}^ + }}} {\;^ \bullet }{\rm{OH}}\quad ,$$
 $$2{}^ \bullet {\rm{OH}} + {\rm{DST}} \to 2{\rm{ ‐ OH ‐ DST}}\quad .$$
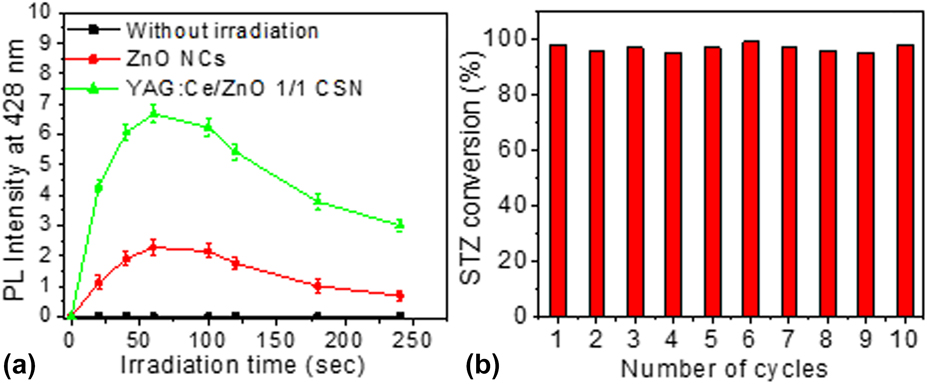
Figure 6(a) shows the change in the relative fluorescence intensity at 428 nm of DST aqueous solutions containing ZnO NCs and YAG:Ce/ZnO 1/1 CSN as a function of irradiation time. Results suggest a very fast production of •OH radicals in the medium since the fluorescence intensity at 428 nm rapidly increases as soon as the DST/photocatalyst solution is irradiated. Results also show that 2-OH-DST was not formed in control experiment performed without irradiation, which confirms that the formation of 2-OH-DST is photo-induced. Figure 6(a) also interestingly shows that YAG:Ce/ZnO 1/1 CSN photocatalyst induces enhanced production of •OH radicals, by a factor of 3, when compared to pure ZnO NCs. This is in good correlation with the photocatalytic reaction rate observed during the photocatalytic degradation of STZ which was 3 times higher with YAG:Ce/ZnO 1/1 CSN compared to pure ZnO NCs. These results confirm the key role of •OH radicals in the photocatalytic decomposition process of STZ, which likely starts with the attack of •OH radicals to benzene ring, with the formation of 4-hydroxy-N-(1,3-thiazol)-benzenesulfonamide, followed by the scission of S–N bond as described in our previous report [Reference Zammouri, Aboulaich, Capoen, Bouazaoui, Sarakha, Stitou and Mahiou48]. Although the •OH radicals have been identified as the main oxidative species of STZ in our previous report [Reference Zammouri, Aboulaich, Capoen, Bouazaoui, Sarakha, Stitou and Mahiou48], the role of superoxide oxygen radicals (such as  ${\rm{O}}_2^{ \bullet - }$) in the photocatalytic decomposition of STZ deserves to be carefully studied and included in the future reports.
(a) PL intensity at 428 nm of DST aqueous solution containing ZnO NCs and YAG:Ce/ZnO CSN versus irradiation time and (b) photocatalytic recyclability study with YAG:Ce/ZnO 1/1 CSN. Experiments were performed under UV-visible light irradiation. An error bar of 5% is included.

Moreover, the potential of reusing YAG:Ce/ZnO CSN in photocatalysis was assessed by performing consecutive STZ conversion cycles with the same YAG:Ce/ZnO CSN batch. The photocatalyst was only washed with water in order to remove the by-products of STZ conversion and traces of STZ left from the previous STZ conversion trial. The result of these experiments is shown in Fig. 6(b). Results show that YAG:Ce/ZnO CSN were able to maintain the same STZ conversion (about 98% at 90 min irradiation) for up to 10 STZ conversion cycles, which suggests a stable production of •OH radicals after each STZ decomposition/washing cycle. The high photodegradation efficiency observed throughout the recyclability study indicates that the YAG:Ce/ZnO CSN photocatalyst displays a high stability (no change in surface properties and reactivity) and robustness and can potentially be reused in antibiotics removal from aqueous media without compromising its initial photocatalytic efficiency.
Effect of YAG:Ce particle size
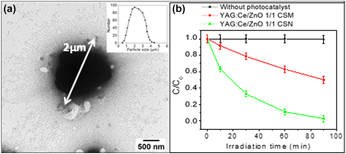
In order to study the effect of YAG:Ce particle size on the photocatalytic efficiency of YAG:Ce/ZnO core/shell structure, we also grow ZnO NCs on the surface of YAG:Ce microparticles (YAG:Ce MPs, D50 = 2 µm) to synthesize YAG:Ce/ZnO core/shell microparticles (YAG:Ce/ZnO CSM). The particle size distribution of YAG:Ce MPs is shown in the inset of Fig. 7(a). The synthetic protocol of YAG:Ce/ZnO CSM was similar to that we used for YAG:Ce/ZnO CSN synthesis (see section “Experimental section”). However, only YAG:Ce/ZnO 1/1 CSM has been synthetized for this comparative study. This sample was then compared with YAG:Ce/ZnO 1/1 CSN in terms of photocatalytic activity.
(a) A representative TEM image of YAG:Ce/ZnO 1/1 CSM. Inset of (a) shows particle size distribution of YAG:Ce MPs. (b) Evolution of STZ conversion (C/C 0) versus irradiation time under UV-vis light in the presence of YAG:Ce/ZnO 1/1 CSM and YAG:Ce/ZnO 1/1 CSN (b). An error bar of 5% is included.

A representative TEM image of YAG:Ce/ZnO 1/1 CSM confirms the successful growth of ZnO NCs on the surface of YAG:Ce MPs as shown in Fig. 7(a) indicating that our synthetic method is suitable for growing ZnO NCs on the surface of YAG:Ce phosphor particles or other oxide-based phosphors regardless of the phosphor particle size. Therefore, the ZnO growth method we developed in the present study can potentially be used to design a new and other promising phosphor/ZnO core/shell NP for high performance visible light photocatalysis.
The specific surface area of the YAG:Ce/ZnO 1/1 CSM was also measured and found to be much lower compared to its corresponding YAG:Ce/ZnO 1/1 CSN (71 versus 30 m2/g) as shown in Table SI (Supplementary material). The result is consistent with the large particle size of YAG:Ce MPs. In addition, the low specific surface area of YAG:Ce/ZnO 1/1 CSM could also be interpreted using percolation concept [Reference He and Ekere63, Reference Wang, Sawicki, Emani, Liu and Shaw64]. Based on the percolation theory, ZnO NCs are not expected to form a high ZnO packing density around YAG:Ce NPs due to the large particle size difference between YAG:Ce MPs (i.e., ∼2000 nm) and ZnO NCs (i.e., ∼10 nm).
The photocatalysis efficiency of YAG:Ce/ZnO 1/1 CSM in the photodegradation of STZ was evaluated. Results show that YAG:Ce/ZnO 1/1 CSM photocatalyst has much lower photocatalytic degradation efficiency compared to YAG:Ce/ZnO 1/1 CSN. As can be seen from Fig. 7(b), the YAG:Ce/ZnO 1/1 CSN was able to remove almost 100% of STZ at 90 min, while only about 50% degradation was achieved with YAG:Ce/ZnO 1/1 CSM at the same irradiation time. This result is in agreement with the specific surface area measurements and indicates that the particle size of the phosphor plays a crucial rule in affecting the photocatalytic performance of YAG:Ce/ZnO core/shell photocatalyst.
Conclusions
In summary, YAG:Ce/ZnO CSN and YAG:Ce/ZnO CSM have been successfully prepared by hydrolysis/condensation of Zn(OAc)2 in the presence of YAG:Ce NPs (100 nm diameter) and YAG:Ce MPs (2 µm diameter), respectively. Our synthetic method was found to yield a multilayer of ZnO NCs around the phosphor particles in a core-/shell-like structure, where the first ZnO layer is strongly attached to the surface of the phosphor through a covalent bond. The photocatalytic activity of the as-prepared nanostructured photocatalyst has been investigated through the photocatalytic decomposition of STZ under UV-vis and visible light. The present manuscript extended the breadth of our previous study [Reference Zammouri, Aboulaich, Capoen, Bouazaoui, Sarakha, Stitou and Mahiou48] in four important ways: (i) the core was changed from LuAG:Ce to YAG:Ce, (ii) the weight ratio of phosphor/ZnO core/shell was varied, (iii) the core size was varied, and (iv) the recyclability of the CSN photocatalyst for photocatalytic degradation of STZ was demonstrated over at least 10 photodegradation cycles. It was found that YAG:Ce/ZnO CSN exhibited much higher photocatalytic degradation of STZ when compared to pure ZnO NCs under both UV-vis and visible light, whatever the YAG:Ce/ZnO weight ratio. Results also showed that the YAG:Ce/ZnO weight ratio has a significant impact on the photocatalytic efficiency of the nanostructure. YAG:Ce/ZnO CSN with 1/1 weight ratio exhibited the highest photocatalytic decomposition rate which reached almost 100% and 80% under UV-vis and visible light, respectively, while the photocatalytic degradation in the presence of pure ZnO NCs was limited to 70% and 50% under UV-vis and visible light, respectively. These results were consistent with the higher specific surface area and enhanced production of •OH radicals with YAG:Ce/ZnO 1/1 CSN compared to pure ZnO NCs. It was also found that the particle size of YAG:Ce core has a significant effect on the photocatalytic decomposition rate of STZ, which was at least two times higher with 100 nm YAG:Ce NPs compared to the 2-µm YAG:Ce particles. The recyclability of the as-prepared photocatalysts was also clearly demonstrated. These results substantiate the high potential of YAG:Ce/ZnO CSN to be applied, as solar light driven photocatalyst, in water treatment area to remove almost all kinds of organic pollutants, especially antibiotics, when these contaminants are present in the environment or waste water.
Experimental
Materials
STZ (98%, CAS number 72-14-0), anhydrous zinc acetate (Zn(OAc)2, 99.9%), tetramethyl ammonium hydroxide pentahydrate [TMAH, >97%], oleic acid (>97%, CAS number 112-80-1), and anhydrous ethanol were purchased from Sigma-Aldrich (Saint-Quentin Fallavier, France) and used as received. Disodium terephthalate (DST, 99+%, CAS number 10028-70-3) was purchased from Alfa Easer (Heysham, U.K.) and used as received without additional purification. Ce-doped YAG (YAG:Ce) microparticles with an average particle size (D50) of 2 µm and 14 µm were purchased from Phosphor Technology (Stevenage, U.K.) and Chimei (Tainan City, Taiwan), respectively. All the aqueous solutions used for photocatalysis experiments were prepared using Milli-Q water (18.2 MΩ cm, Millipore).
Preparation of Ce-doped Y3Al5O12 NPs (YAG:Ce NPs)
YAG:Ce NPs were prepared via a top–down approach starting from commercialized micro-sized YAG:Ce phosphor with D50 = 14 µm (Chimei Company, Taiwan) using the high-energy ball mill (Emax, Retsch, Haan, Germany) as described in our previous report [Reference Zammouri, Aboulaich, Capoen, Bouazaoui, Sarakha, Stitou and Mahiou48]. The as-prepared YAG:Ce NPs in ethanol solvent exhibited high colloidal stability (no particles settling) over a few weeks at room temperature.
Preparation of YAG:Ce/ZnO CSN
We developed a particular experimental procedure in order to homogenously grow ZnO NCs on the surface of YAG:Ce NPs and yield highly homogenous ZnO NCs shell around YAG:Ce NPs. This procedure consists in adding progressively Zn(OAc)2 and TMAH solutions by a rapid injection (under vigorous stirring) to YAG:Ce NPs suspension as illustrated in Fig. S1 (Supplementary material). This procedure was also described in our previous report [Reference Zammouri, Aboulaich, Capoen, Bouazaoui, Sarakha, Stitou and Mahiou48]. In a typical experiment, the Zn(OAc)2 stock solution was prepared by dissolving 345 mg (1.88 mmol) of anhydrous Zn(OAc)2 in 35 mL of anhydrous ethanol and then mixed with 110 µL of oleic acid. TMAH solution was prepared by dissolving 563 mg (3.11 mmol) of tetramethyl ammonium hydroxide pentahydrate in 10 mL of anhydrous ethanol. YAG:Ce NPs suspension was prepared by dispersing 30 mg of YAG:Ce NPs powder in anhydrous ethanol at 1 mg/mL concentration. The YAG:Ce/ZnO weight ratio was controlled from 0/1 to 1.5/1 by adjusting the number of Zn(OAc)2 and TMAH injections. For example, for a theoretical YAG:Ce/ZnO weight ratio of 1/1, 1 mL of Zn(OAc)2 stock solution was first injected into 30 mL of YAG:Ce NPs suspension under vigorous stirring at 100 °C. After 1-min stirring, 1 mL of TMAH solution was injected into the mixture and the solution was allowed to react for 1 min again so that the hydrolysis/condensation of Zn(OAc)2 precursor can occur on the surface of YAG:Ce NPs. This process was repeated 6 times in that case in order to achieve the YAG:Ce/ZnO 1/1 weight ratio. After being collected by centrifugation, the yellow precipitate was then dried in air at 80 °C and finally heated in oven at 500 °C for 2 h.
DST assay
DST reacts with •OH radicals and turns into fluorescent 2-hydroxyterephthalate (2-OH-DST), which emits a blue light at 428 nm under UV excitation [Reference Bohne, Faulhaber, Giese, Hafner, Hofmann, Ihmels, Kohler, Pera, Schneider and Sheepwash49, Reference Ipe, Lehning and Niemeyer50]. This reaction was used to estimate the efficiency of pure ZnO NCs and YAG:Ce/ZnO CSN in producing hydroxyl radicals (•OH). In a typical experiment, 40 mg of photocatalyst were dispersed in 20 mL of DST aqueous solution (2 × 10⁻⁵ M). In order to properly disperse the photocatalyst in DST solution, the mixture was then stirred in the dark for about 20 min. The solution was finally irradiated with the Xe lamp (P = 1000 W) for about 4 min and samples have been collected at different irradiation times for measurement. The PL spectra (at 350 nm excitation) were recorded on each sample in order to monitor the formation of the fluorescent 2-OH-DST versus time.
Photocatalytic activity
The photocatalytic activity was studied through the photodegradation of STZ in aqueous solution (10−4 M). In a typical experiment, 20 mg of photocatalyst were mixed with 10 mL of STZ aqueous solution to reach a photocatalyst concentration of 2 g/L. The mixture was then ultrasonicated for 10 min and then stirred during 30 min in the dark in order to reach the adsorption equilibrium. We should mention that the DST assay showed that no hydroxyl radicals are formed during the sample preparation step. The photocatalyst/STZ dispersion was then transferred into the photocatalytic glass reactor and finally exposed to the Xe lamp (250–1000 nm, 1000 W). The photocatalytic activity was studied in two separate stages. First, both UV (350–400 nm) and visible light (400–800 nm) from the Xe lamp were used for sample irradiation. In that case, wavelengths from 250 to 350 nm were filtered using a 350-nm filter while NIR light (wavelengths longer than 800 nm) was filtered by water. Second, the photocatalytic activity in the visible range was dissociated from the UV-related one using a 400-nm filter. In that case, only the emission wavelengths in the 400–800 nm range were used during the sample irradiation. Fig. S2 (Supplementary material) shows the transmittance curve and the light output of the Xe lamp with 350 and 400 nm glass filters. The light intensity at the surface of STZ solution under UV-vis and visible irradiation was estimated to be 1.5 × 10¹⁸ photons/(cm2 s) and 5.7 × 10¹⁷ photons/(cm2 s), respectively. The photocatalyst/STZ mixture was continuously stirred during the light irradiation. We successfully followed the disappearance of STZ versus time using the HPLC. Waters 540 HPLC chromatograph system equipped with a Waters 996 photodiode array detector was used. The experiments were performed using UV detection at 250 nm and 300 nm. The flow rate was fixed at 1.0 mL/min and the injected volume was 50 μL. The elution was accomplished with acidified water (0.1% acetic acid) and methanol (40:60 v/v ratio). The photocatalyst/STZ solutions collected at different irradiation times were centrifuged and only the supernatant was taken for HPLC analysis. All the photocatalysis related experiments were repeated 3 times at least with an error of less than 5%.
Characterization
The structure of the as-prepared photocatalysts was analyzed using a Philips X-Pert Pro diffractometer (Philips Company, Amsterdam, Netherlands) operating with the Cu Kα radiation (λ = 1.5406 Å). FTIR spectra were recorded using an ATR accessory installed on a Nicolet FT-IR spectrometer (Thermo Scientific Company, Waltham, Massachusetts). The particle size and morphology were investigated by means of a Hitachi H-7650 TEM (Hitashi, Tokyo, Japan) operating at 80 kV and equipped with a Hamamatsu AMT HR CCD camera placed in a side position. HRTEM observations were carried out using a FEI Tecnai G2 20 instrument (FEI Company, Hillsboro, Oregon) operating at 200 kV. HRTEM was coupled with EDS measurements for chemical identification. TEM and HRTEM analyses were performed by depositing a drop of the photocatalyst ethanol dispersion onto a carbon film supported nickel grid. The porosity of the synthesized photocatalyst was measured using N2 adsorption–desorption method. After an outgassing process of 12 h at 90 °C under secondary vacuum, N2 sorption isotherms were recorded at 77.35 K using a Micromeritics ASAP 2020 automatic apparatus (Micromeritics Company, Norcross, Georgia). The BET method was used to determine the specific surface area [Reference Brunauer, Emmett and Teller51]. The pore volume was obtained from the desorption isotherm using the Barrett–Joyner–Halenda (BJH) model [Reference Barrett, Joyner and Halenda52]. Particle size measurement was carried out using DLS method. Particle size distribution was obtained using Zetasizer Nano ZS, Malvern, U.K. instrument. Diffuse reflectance UV-vis spectra of the samples were measured using a Shimadzu UV-2101PC spectrophotometer (Shimadzu, Kyoto, Japan). BaSO4 is used as a standard for baseline measurements and spectra are recorded in the 200–800 nm spectral range.
Supplementary material
To view supplementary material for this article, please visit https://doi.org/10.1557/jmr.2019.25.
Acknowledgments
Authors thank Christelle Blavignac (CICS, Université d’Auvergne) for TEM observations.