Introduction
Obsessive–compulsive disorder (OCD) is characterized by obsessions – intrusive thoughts, images, and urges that cause distress, and by compulsions – repetitive actions performed to reduce obsessional distress (American Psychiatric Association, 2013). Among American adults, OCD has 12-month and lifetime prevalence rates of 1.2% and 2.3%, respectively (Ruscio et al. Reference Ruscio, Stein, Chiu and Kessler2010).
Many people with OCD become depressed. Epidemiological (Ruscio et al. Reference Ruscio, Stein, Chiu and Kessler2010) and naturalistic clinical studies (Pinto et al. Reference Pinto, Mancebo, Eisen, Pagano and Rasmussen2006) report lifetime rates of major depression in patients with OCD as high as 40% and 67.2%, respectively. Another survey of patients with OCD revealed rates of lifetime depression in 73.4% and 81.2% of early- and late-onset cases, respectively (Millet et al. Reference Millet, Kochman, Gallarda, Krebs, Demonfaucon, Barrot, Bourdel, Olié, Loo and Hantouche2004). Moreover, OCD usually precedes the emergence of depressive mood disorders (e.g. Welner et al. Reference Welner, Reich, Robins, Fishman and Van Doren1976; Ricciardi & McNally, Reference Ricciardi and McNally1995), especially in patients with early-onset OCD (Millet et al. Reference Millet, Kochman, Gallarda, Krebs, Demonfaucon, Barrot, Bourdel, Olié, Loo and Hantouche2004).
Co-morbid depression in people with OCD has important clinical implications. Severe depression can impede habituation to stimuli provocative of obsessions (Foa, Reference Foa1979), thereby undermining otherwise efficacious behavior therapy for OCD (e.g. Foa et al. Reference Foa, Liebowitz, Kozak, Davies, Campeas, Franklin, Huppert, Kjernisted, Rowan, Schmidt, Simpson and Tu2005). Certain symptoms of depression, including insomnia, fatigue and diminished motivation, may interfere with reduction in obsessional distress (e.g. Abramowitz et al. Reference Abramowitz, Franklin, Street, Kozak and Foa2000), and addressing co-morbid depression symptoms may detract from the time needed to treat the primary OCD symptoms (e.g. Storch et al. Reference Storch, Merlo, Larson, Geffken, Lehmkuhl, Jacob, Murphy and Goodman2008). Moreover, patients with OCD and depression are at elevated risk for attempting suicide (Torres et al. Reference Torres, Ramos-Cerqueira, Ferrão, Fontenelle, Conceição do Rosário and Miguel2011). In one study, 27% of patients with OCD had a history of attempted suicide (Kamath et al. Reference Kamath, Reddy and Kandavel2007); depression and hopelessness were major correlates of attempts.
As Ruscio et al. (Reference Ruscio, Stein, Chiu and Kessler2010) wrote, further research ‘is needed to specify the causal mechanisms’ (p. 61) producing high rates of co-morbid disorders, including depression, in people with OCD. Tackling this issue, Zandberg et al. (Reference Zandberg, Zang, McLean, Yeh, Simpson and Foa2015) conducted lagged multilevel mediational analyses to test whether improvement in OCD symptoms mediated improvement in depressive symptoms or vice versa in 40 patients with primary OCD who had undergone behavior therapy while taking a serotonin reuptake inhibitor. They found that reduction in OCD symptoms accounted for 65% of the reduction in depressive symptoms, whereas improvement in depressive symptoms only partially mediated subsequent improvement in OCD symptoms, accounting for only 20% of the variance.
The aim of our study was to apply network analytic methods to characterize the functional relationships among symptoms of OCD and depression in patients with primary OCD. In contrast to both the traditional latent categorical (e.g. Guze, Reference Guze1992) and latent dimensional (e.g. Helzer et al. Reference Helzer, Kraemer, Krueger, Wittchen, Sirovatka and Regier2008) models of mental disorder, the network perspective does not view symptoms as reflective of an underlying disease entity (Borsboom, Reference Borsboom2008; Borsboom & Cramer, Reference Borsboom and Cramer2013). Rather, it construes symptoms as constitutive of disorder. An episode of disorder emerges as a consequence of causal interactions among symptoms themselves. Co-morbidity arises as a natural consequence of intertwined symptom networks (Cramer et al. Reference Cramer, Waldorp, van der Maas and Borsboom2010). That is, symptoms characteristic of one disorder may cluster together (e.g. distress associated with obsessions may directly trigger compulsions), whereas symptoms characteristic of a co-morbid disorder may likewise cluster together (e.g. guilt triggering suicidal ideation). Yet despite their syndromic distinctiveness, both disorders may share certain features (e.g. sad mood) – bridge symptoms – that link the two clusters into a single network of interacting symptoms.
To accomplish this aim, we analysed symptoms of OCD and depression in 408 adult patients with a primary diagnosis of OCD upon their admission to a cognitive–behavioral treatment center for the disorder. We computed two networks that illustrate statistical links (edges) between pairs of symptoms (nodes). First, we applied the graphical LASSO (least absolute shrinkage and selection operator; Friedman et al. Reference Friedman, Hastie and Tibshirani2008) algorithm to obtain a (regularized) partial correlation network whose edges depict the magnitude of direct association between pairs of symptoms after adjusting for the influence of all other symptoms in the network. In contrast to association networks that represent zero-order correlations between symptom pairs (e.g. Fig. 2, McNally et al. Reference McNally, Robinaugh, Wu, Wang, Deserno and Borsboom2015), the network produced by the graphical LASSO depicts direct associations between pairs of symptoms, thereby excluding any spurious associations attributable to the influence of other symptoms. However, one limitation is that the network is undirected; one cannot tell whether a partial correlation between symptom X and symptom Y signifies that symptom X predicts the activation of symptom Y (or vice versa) or whether the direction of prediction (and possibly influence) occurs both ways.
Second, using a Bayesian network approach, we estimated a directed acyclic graph (DAG) that best fits our data. In contrast to the edges in association and partial correlation networks, those in a DAG have an arrowhead at the tip of each edge, signifying the direction of prediction and possibly causal influence.
In summary, the purpose of network analysis is to characterize relationships among symptoms as a plausible causal system. Our methods constitute two ways of estimating a model that parsimoniously, but accurately, approximate the symptom structure. Implementing different algorithms, each method has its strengths and weaknesses; neither is ‘better’ than the other. For example, although our DAG excludes the possibility of feedback loops (cycles) among symptoms, it does represent the direction of prediction and potential causality as its edges are directed. Agnostic regarding edge direction, the graphical LASSO permits bidirectional edges between symptoms. Suffice it to say, both the LASSO (Tibshirani, Reference Tibshirani2011) and the DAG (Scutari & Denis, Reference Scutari and Denis2015) are well established in network science and statistics.
Method
Subjects
We used archival admission data from 408 patients treated between 30 July 2012 and 22 June 2015 in the residential and intensive out-patient units of the Obsessive–Compulsive Disorder Center at Rogers Memorial Hospital based in Oconomowoc, Wisconsin. Upon enrolling in the program, patients received a primary diagnosis of OCD and they provided written informed consent to have their de-identified data used for research (see Supplementary material). In addition, 102 had a co-morbid diagnosis of major depressive disorder, 48 had a co-morbid diagnosis of depression ( not otherwise specified), and three had a diagnosis of dysthymia. A licensed psychiatrist conducted the clinical diagnostic interviews. Patients ranged from 18 to 69 years of age (mean = 31.1, s.d. = 12.2 years). There were 193 men (47.3%) and 215 women (52.7%). The racial/ethnic breakdown was Caucasian (n = 381), African-American (n = 7), Asian (n = 14) and other (n = 6).
Measures
Yale–Brown Obsessive Compulsive Scale – self-report (Y-BOCS-SR; Steketee et al. Reference Steketee, Frost and Bogart1996)
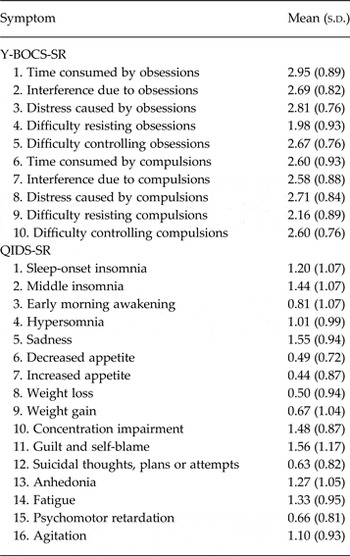
We used Steketee et al.’s (Reference Steketee, Frost and Bogart1996) self-report version of the Y-BOCS (Goodman et al. Reference Goodman, Price, Rasmussen, Mazure, Fleischman, Hill, Heninger and Charney1989), a 10-item instrument evaluating the severity of obsessions and compulsions during the previous week. Total scores range from 0 to 40, and a score of 16 (or higher) signifies clinically significant symptom severity. Five items pertain to obsessions, and five pertain to compulsions; each is rated on a five-point Likert scale ranging from 0 (no symptoms) to 4 (extreme). Like the Y-BOCS interview (Goodman et al. Reference Goodman, Price, Rasmussen, Mazure, Fleischman, Hill, Heninger and Charney1989), the self-report version has very satisfactory psychometric properties (Steketee et al. Reference Steketee, Frost and Bogart1996). Patients completed it upon their admission to the treatment program. Their mean Y-BOCS-SR score was 25.76 (s.d. = 5.39; range 16–40). The means and standard deviations for each Y-BOCS-SR symptom appear in Table 1.
Symptoms on the Y-BOCS-SR and QIDS-SR a

Y-BOCS-SR, Yale–Brown Obsessive Compulsive Scale – self-report version (Steketee et al. Reference Steketee, Frost and Bogart1996); QIDS-SR, Quick Inventory of Depressive Symptomatology – self-report version (Rush et al. Reference Rush, Trivedi, Ibrahim, Carmody, Arnow, Klein, Markowitz, Ninan, Kornstein, Manber, Thase, Kocsis and Keller2003); s.d., standard deviation.
a The Y-BOCS-SR is a five-point scale ranging from 0 to 4, and the QIDS-SR is a four-point scale ranging from 0 to 3.
To fit labels inside nodes, we used the following abbreviations for the Y-BOCS-SR symptoms. The abbreviation appears in italics, the full item appears in parentheses. The symptoms were: (1) obtime (time consumed by obsessions); (2) obinterfer (interference due to obsessions); (3) obdistress (distress caused by obsessions); (4) obresist (difficulty resisting obsessions); (5) obcontrol (difficulty controlling obsessions); (6) comptime (time consumed by compulsions); (7) compinterf (interference due to compulsions); (8) compdis (distress caused by compulsions); (9) compresis (difficulty resisting compulsions); and (10) compcont (difficulty controlling compulsions).
Quick Inventory of Depressive Symptomatology – self-report version (QIDS-SR; Rush et al. Reference Rush, Trivedi, Ibrahim, Carmody, Arnow, Klein, Markowitz, Ninan, Kornstein, Manber, Thase, Kocsis and Keller2003)
Upon entering the program, patients completed the QIDS-SR. This questionnaire contains 16 depression symptoms, and each symptom is scored on a four-point Likert scale ranging from 0 to 3; total scores range from 0 to 64. Their mean total score on the QIDS-SR was 12.75 (s.d. = 5.35; range 1–25). The means and standard deviations for each QIDS-SR symptom appear in Table 1. To fit labels inside the nodes, we used the following abbreviations for the QIDS-SR symptoms in the order of their appearance in the questionnaire. The abbreviation appears in italics, the full item appears in parentheses, with any clarifying comments. The symptoms were: (1) onset (sleep-onset insomnia); (2) middle (difficulty falling back asleep in the middle of the night); (3) late (early morning awakening); (4) hypersom (hypersomnia); (5) sad (sadness); (6) decappetite (decreased appetite); (7) incappetite (increased appetite); (8) weightloss (weight loss, within the last 2 weeks); (9) weightgain (weight gain, within the last 2 weeks); (10) concen (concentration/decision-making impairment); (11) guilt (guilt and self-blame); (12) suicide (suicidal thoughts, plans or attempts); (13) anhedonia; (14) fatigue; (15) retard (psychomotor retardation); and (16) agitation.
In summary, for each network, there were 26 nodes, each reflecting the severity of an OCD symptom or a depression symptom.
Networks
Partial correlation network (graphical LASSO)
For our first analysis, we estimated a network via a graphical Gaussian model whereby edges signify conditional independence relationships among the nodes (i.e. partial correlations between pairs of nodes controlling for the influence of all other nodes; e.g. Epskamp & Fried, Reference Epskamp and Fried2016). The thickness of an edge indicates the magnitude of the association between the two nodes it connects. Because networks involving the estimation of so many parameters are likely to result in some false-positive edges, we regularized the model by running the graphical LASSO (Friedman et al. Reference Friedman, Hastie and Tibshirani2008). This procedure implements an L1 penalty, estimating a sparse inverse covariance matrix that results in shrinkage such that trivially small partial correlations are driven to zero and thus do not appear in the graph. Partial correlations computed in this manner are called regularized partial correlations. A sparse network is a parsimonious one that best accounts for the covariance among nodes while endeavoring to minimize the number of depicted edges. The upshot is that only the strongest partial correlations, and hence possible candidates for genuine and potentially causal associations, remain visible.
We used the R packages qgraph (Epskamp et al. Reference Epskamp, Cramer, Waldorp, Schmittmann and Borsboom2012) and glasso (Friedman et al. Reference Friedman, Hastie and Tibshirani2014) to compute this network (see Supplementary material). Epskamp et al.’s (Reference Epskamp, Cramer, Waldorp, Schmittmann and Borsboom2012) qgraph package furnishes an extended Bayesian information criterion (EBIC) model comparison procedure that ascertains the tuning parameter that optimizes model fit as well as parsimony (Chen & Chen, Reference Chen and Chen2008), given a specific value of the hyperparameter γ. Following Beard et al. (Reference Beard, Millner, Forgeard, Fried, Hsu, Treadway, Leonard, Kertz and Björgvinsson2016), we set the initial value of γ to 0.5. In summary, the procedure estimates 100 different models varying in their sparsity ranging from 0 to 1.00, and the model with the lowest EBIC value is retained as the one that best maximizes likely genuine edges while minimizing likely false ones (Epskamp & Fried, Reference Epskamp and Fried2016).
We also computed strength centrality and betweenness centrality – two metrics signifying the importance of a node (symptom) to the network (Freeman, Reference Freeman1978/1979). The first is calculated by summing the weights of all edges connected to a node, whereas the second indicates the number of times that a node lies on the shortest path between two other nodesFootnote 1 Footnote †.
Highly central symptoms have clinical relevance. Activation of a highly central symptom increases the likelihood of activation spreading to other symptoms in virtue of the magnitude and number of its connections to them. If the requisite symptoms activate, an episode of disorder occurs. Conversely, successfully treating a highly central symptom should foster quicker recovery than treating a less central symptom.
However, a very important caveat qualifies the foregoing statements. Our undirected partial correlation network depicts associations between pairs of symptoms, controlling for the role of all other symptoms in the network, but the edges do not indicate whether symptom X predicts activation of symptom Y (or vice versa) or both. The foregoing statements hold true only if clinical intervention successfully deactivates symptom X and only if the direction of influence runs from symptom X to symptom Y. In contrast, directed networks (such as our Bayesian one described below) have edges with arrowheads at their tips, signifying the direction of prediction and potentially causal influence.
Finally, following Epskamp et al. (Reference Epskamp, Borsboom and Fried2016a ), we tested the stability of the network by applying the R package bootnet. Computing 1000 bootstrapped networks, we used these to estimate the stability of the centrality metrics and the confidence intervals for the strength of each edge.
Bayesian network (DAG)
We computed a BayesianFootnote 2 network, embodied in a DAG, by running the hill-climbing algorithm provided by the R package, bnlearn (Scutari, Reference Scutari2010). As implemented by bnlearn, the bootstrap function computes the structural aspect of the network by adding edges, removing them, and reversing their direction to optimize a goodness-of-fit target score (e.g. BIC). This step only determines whether an edge exists or not; no edge weights are computed yet. We randomly restarted the process with different candidate edges linking different symptom pairs, perturbing the system, and so forthFootnote 3 . As this iterative procedure unfolds, the algorithm discerns the structure of the network.
To ensure that the resultant network was stable, we conducted bootstrapping by extracting 1000 samples with replacement, computing a network for each sample, and then averaging them to obtain the resultant network. There are two steps to this procedure. First, we ascertained how frequently an edge appears in the 1000 bootstrapped networks. If an edge appeared in at least 85% of these networks (Sachs et al. Reference Sachs, Perez, Pe'er, Lauffenburger and Nolan2005), we retained it in the final, averaged DAG. Accordingly, such a sparse DAG depicts only those edges nearly certain to be genuine.
Second, we ascertained the direction of each edge in the 1000 bootstrapped networks. For example, if an edge runs from symptom X to symptom Y in at least 51% of the bootstrapped networks, then this direction will appear in the final, averaged network. In summary, we first determined the structure of the network (i.e. symptom to symptom connections), and then determined the direction of each edge.
The bnlearn program provides a BIC value for each edge. The larger the absolute BIC value, the more damaging it would be to model fit if one were to remove the edge from the network. Accordingly, high absolute BIC values indicate how important an edge is to the model that best characterizes the structure of the data. The thickness of an edge reflects the magnitude of its BIC value. We computed the identical network, but had edge thickness reflect the probability that the depicted direction of the edge occurred as shown in the graph. For example, if an edge went from symptom X to symptom Y in 95% of the 1000 bootstrapped networks, it would appear very thick. If it went from symptom X to symptom Y in only 55% of the bootstrapped networks, it would appear relatively thin.
Finally, Scutari & Nagarajan (Reference Scutari and Nagarajan2013) have devised a statistically motivated procedure for identifying edges for retention in Bayesian networks that matches ad hoc methods (e.g. Sachs et al. Reference Sachs, Perez, Pe'er, Lauffenburger and Nolan2005) in terms of specificity (i.e. rejecting false edges) and outperforms them in terms of sensitivity (i.e. retaining true edges). On the other hand, their method results in less sparse networks. We used both methods.
Ethical standards
All procedures contributing to this work comply with the ethical standards of the relevant national and institutional committees on human experimentation and with the Helsinki Declaration of 1975, as revised in 2008.
Results
Regularized partial correlation network (graphical LASSO)
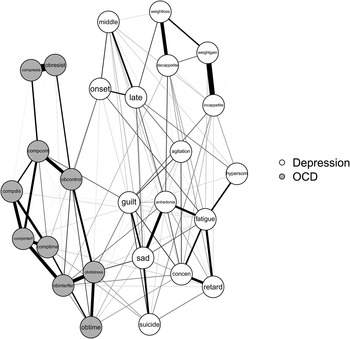
The (regularized) partial correlation network appears in Fig. 1. It is immediately evident that symptoms of OCD (gray nodes) cluster together as do those of depression (white nodes), but edges between symptoms of each cluster connect the syndromes.
Network constructed via the graphical LASSO depicting regularized partial correlations between pairs of obsessive–compulsive disorder (OCD) and depression symptoms in patients with primary OCD. For details of the symptoms, see the Method section.

The edges in this sparse network are likely genuine, and signify direct (not spurious) associations between pairs of symptoms. The vast majority of the edges represent positive correlations. Among the strongest edges are the link between the inability of patients to resist obsessions and to resist compulsions; sadness and suicidal ideation; fatigue and psychomotor retardation; amount of time consumed by obsessions and the distress associated with them. Six edges represent negative correlations, and most are unsurprising. These occur between the following symptom pairs: weight loss and weight gain; increased appetite and decreased appetite; decreased appetite and weight gain; hypersomnia and late insomnia (early morning awakening); hypersomnia and middle insomnia; suicidal ideation and the amount time engaged in compulsive rituals.
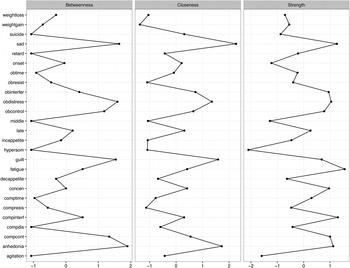
Fig. 2 is a centrality plot that illustrates three (standardized) centrality metrics: strength, betweenness and closeness. The five symptoms having the greatest node strength centrality were fatigue, interference due to compulsions, sadness, anhedonia and distress caused with obsessions. Sadness and anhedonia, the two gateway symptoms, at least one of which is required for a diagnosis of depression, were highly central nodes in terms of the number and strength of the connections with other elements of the network. Distress associated with obsessions is another finding that dovetails with clinical observation. Indeed, distress arising from the appraisal of intrusive thoughts as dangerous, morally repugnant, or otherwise unacceptable is deemed central to the etiology and maintenance of OCD (e.g. for a review, see Hezel & McNally, Reference Hezel and McNally2016).
Centrality plot for the graphical LASSO depicting standardized measures of node strength, betweenness and closeness. For details of the symptoms, see the Method section.

The five nodes having the highest betweenness centrality were anhedonia, sadness, distress associated with obsessions, guilt and difficulty controlling compulsions.
Online Supplementary Fig. S1 depicts the average correlation of a node's centrality in the bootstrapped samples with its centrality in the original estimated network as a function of the percentage of subjects in the sample. For example, even when our samples comprised only 70% of the original subjects, the correlations remained quite high, especially for strength centrality. Confidence intervals for edge strength are shown in online Supplementary Fig. S2.
Bayesian network
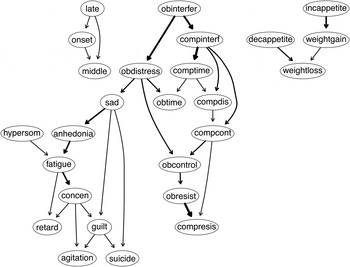
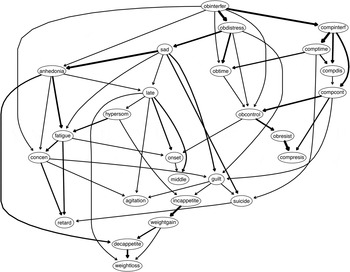
Fig. 3 depicts the DAG returned by the Bayesian network analysis. Several features are apparent. First, the predictive (and potentially causal) priority of OCD symptoms stands out as these appear at the top of the DAG. Second, there are two ‘islands’, one comprising depression symptoms related to difficulty sleeping, and the other comprising depression symptoms related to appetite. Because the sparsity parameter ensures that only the strongest associations remain in the network, this DAG suggests that these two symptom islands do not figure prominently in the maintenance of co-morbid OCD and depression. Third, syndromic coherence again emerges for OCD symptoms and for depression symptoms with the exception of the two islands noted.
A Bayesian network (directed acyclic graph; DAG) depicting obsessive–compulsive disorder (OCD) and depression symptoms in patients with primary OCD. For details of the symptoms, see the Method section.

As Fig. 3 illustrates, the degree to which obsessions interfere with patients’ lives directly influences the degree with which compulsions likewise interfere with patients’ lives and the degree with which patients experience distress concerning their obsessions. Distress about obsessions, in turn, activates the bridge symptom of sadness that connects OCD symptoms to those of depression. As evident in the previous networks, sadness directly influences guilt and suicidal ideation, plans and attempts. The main branch of the OCD segment of the DAG culminates in patients failing to resist their obsessions and compulsions just as the main branch of the depression segment of the DAG culminates in psychomotor agitation and suicidality.
The primary clinical relevance of a DAG is suggesting what symptoms should be the primary targets of therapeutic intervention. Upstream symptoms appearing near the top of the network, such as the degree of interference and distress caused by obsessions and the degree of interference caused by compulsions, should be primary targets as these appear to be the sources of activation driving co-morbid OCD and depression (Fig. 3). Note also the importance of sadness as the only symptom bridging the OCD and depression clusters. That it lies between the two syndromic clusters means that OCD symptoms must first activate sadness as the gateway to inciting the remaining symptoms in the depression cluster.
Fig. 4 is a DAG computed via Scutari & Nagarajan's (Reference Scutari and Nagarajan2013) method. Their procedure returns a very similar, but less sparse, DAG, such that the symptoms related to eating and sleeping are functionally integrated into the rest of the network.
A Bayesian network (directed acyclic graph; DAG) depicting obsessive–compulsive disorder (OCD) and depression symptoms in patients with primary OCD with Scutari & Nagarajan's (2013) method. For details of the symptoms, see the Method section.

Finally, online Supplementary Figs S3 and S4 depict the identical DAGs computed via the Sachs et al. (Reference Sachs, Perez, Pe'er, Lauffenburger and Nolan2005) 85% criterion for edge retention and the Scutari & Nagarajan (Reference Scutari and Nagarajan2013) method, but with one difference. In both graphs the thickness of an edge signifies the percentage of time that its direction occurred in the manner depicted across the 1000 bootstrapped samples.
Discussion
The goal of network analysis in the field of psychopathology is to discern potentially causal relationships among symptoms of mental disorders and to characterize an episode of disorder as a causal system. Yet most work has involved cross-sectional data on depression (e.g. Cramer et al. Reference Cramer, Borsboom, Aggen and Kendler2012), complicated grief (Robinaugh et al. Reference Robinaugh, LeBlanc, Vuletich and McNally2014) and post-traumatic stress disorder (McNally et al. Reference McNally, Robinaugh, Wu, Wang, Deserno and Borsboom2015) among other syndromes. Although correlation does not establish causation, it is consistent with it. Moreover, the absence of an edge between two symptoms provides strong evidence that neither symptom causes the other.
We used two network analytic approaches to model the relationship between symptoms of OCD and depression in patients with primary OCD. Just as the mean and median are differentially informative ways to characterize the central tendency of a distribution, so are the graphical LASSO and the DAG differentially informative ways of characterizing symptoms as a potentially causal system. Nevertheless, both tell a similar story about the co-morbidity of OCD and depression symptoms. Both revealed the syndromic clusters of OCD and depression, and high-centrality symptoms detected in the graphical LASSO network tend to be those most crucial to the DAG (e.g. sadness, anhedonia, fatigue). The DAG, however, underscored the importance of OCD symptoms in this picture of co-morbidity. The interference that obsessions produce had structural priority in the DAG, seemingly consistent with work by cognitive–behavioral therapists who argue that appraisal of occasional thoughts as threatening is a key to the etiology of the disorder (e.g. Salkovskis, Reference Salkovskis1985).
Our two networks have their strengths and weaknesses. The network disclosed by the graphical LASSO depicts (regularized) partial correlations between symptom pairs, unaffected by other symptoms in the network. Yet because such a network is undirected it cannot reveal whether symptom X is the cause of symptom Y, or vice versa, or both.
The Bayesian analysis returned a DAG that identifies the direction of prediction and potentially causal influence among symptoms. However, because our analysis concerned cross-sectional data, we were unable to model the effect of time (i.e. the temporal order of symptom emergence). Yet the DAG does suggest causal hypotheses testable via clinical intervention. For example, it revealed sadness as the node linking OCD symptoms with depression symptoms, implying that preventing this mood from worsening in someone with OCD symptoms would prevent the emergence of full-blown depression and hence diagnostic co-morbidity (Cramer et al. Reference Cramer, Waldorp, van der Maas and Borsboom2010).
Although cross-sectional data alone cannot confirm causality, experts in Bayesian analysis emphasize that one can nevertheless build a conjectural case for causality even in the absence of a randomized controlled experiment (Pearl et al. Reference Pearl, Glymour and Jewell2016, p. xii). Occasionally, one can draw on causal knowledge from other sources (e.g. experiments; Sachs et al. Reference Sachs, Perez, Pe'er, Lauffenburger and Nolan2005) to aid in causal interpretation. Sometimes structural priority in the DAG may imply temporal priority, even in an atemporal, cross-sectional dataset. Metaphorically speaking, consider someone who views a house with three floors. Knowledge of gravity enables an observer to conclude that construction of the first floor was a causal prerequisite for construction of the second and third floors even though the observer did not witness the process of construction.
Other assumptions requiring satisfaction are as follows. One must be confident that there are no important variables affecting associations among symptoms that have been omitted from the analysis (Pearl, Reference Pearl, Shrout, Keyes and Ornstein2011; Scutari & Denis, Reference Scutari and Denis2015, pp. 119–120). Another assumption is that the system does not involve any cycles (‘loops’). In a DAG, activation flows only in one direction such that it never returns to the node of origin. Yet cycles may figure in the etiology and maintenance of some forms of psychopathology. For example, Clark (Reference Clark1986) holds that panic attacks arise when certain bodily sensations (e.g. benign heart palpitations) are misinterpreted as signifying imminent catastrophe (e.g. a heart attack). Such interpretations incite fear which, in turn, aggravates the bodily sensations, seemingly confirming the person's catastrophic misinterpretation. The cycle continues, culminating in a full-blown panic attack, according to Clark. This acyclicity requirement, requisite for a DAG, does not pertain to networks computed via the graphical LASSO whereby such self-reinforcing loops are permissible.
Although one cannot model loops in a DAG, one may gain clues to the possibility of ‘hidden loops’ by examining the probability of an edge occurring in the direction depicted in a DAG (see online Supplementary Figs S4 and S5). For example, consider an edge pointing from symptom X to symptom Y in 51% of the bootstrapped samples, and from symptom Y to symptom X in 49% of the bootstrapped samples. Such instability in edge direction may suggest bidirectionality of influence.
In summary, the promise of Bayesian network analysis and other causal search procedures (Saxe et al. Reference Saxe, Statnikov, Fenyo, Ren, Li, Prasad, Wall, Bergman, Briggs and Aliferis2016) is only just beginning to be explored by clinical researchers. Another important development concerns vector autoregressive approaches that incorporate a temporal dimension to network analysis, thereby revealing how symptom interaction unfolds over time (e.g. Bringmann et al. Reference Bringmann, Lemmens, Huibers, Borsboom and Tuerlinckx2015; Epskamp et al. Reference Epskamp, Waldorp, Mõttus and Borsboom2016b ). Moreover, intra-individual networks that unfold over time encourage personalized methods of treating individuals that acknowledge the heterogeneity among patients qualifying for the same diagnosis. Taken together, these approaches are likely to bring us closer to casually and clinically relevant ways of characterizing psychopathology (McNally, Reference McNally2016; Borsboom, Reference Borsboomin press).
Supplementary material
The supplementary material for this article can be found at https://doi.org/10.1017/S0033291716003287
Acknowledgements
None.
Declaration of Interest
None.