


1. Introduction
The seasonal sea-ice cover that advances and retreats around the coastline of Antarctica each year has a significant impact on the global climate system, through its moderation of the exchanges of heat, fresh water and momentum between the ocean and atmosphere systems. Sea ice is both an important climate indicator and a sensitive component of the climate system (Reference GordonGordon, 1988). Attempts to model the atmosphere/sea-ice system in the Southern Hemisphere have shown that the sea-ice thickness and area! coverage is very sensitive to the oceanic heat flux (see, e.g., Reference Parkinson and WashingtonParkinson and Washington, 1979; Wน and others, 1997). Although varying estimates have been made as to the magnitude of the oceanic heat flux, little is known about its seasonality, except for the work by Reference Heil, I. and V. I.Heil and others (1996), where seasonal estimates are calculated for land-fast ice. Here we calculate the seasonal variability of oceanic heat flux beneath a drifting ice pack in the Southern Ocean using a dynamic/ thermodynamic sea-ice model coupled to a complex, nonlinear, eddy-resolving primitive equation ocean model.
It has been known for some time that the seasonal sea-ice cover in the Southern Ocean can exhibit two distinct climatic modes (Gordon and Huber, 1990; Reference MartinsonMartinson, 1990). in the “stable mode”, sea-ice formation is supported by the presence of a relatively thin surface mixed layer which is generally cooler and fresher than the waters below. The mixed layer is separated from the warmer, saltier bulk of the ocean by the pycnocline, a region characterised by sharp vertical gradients of ocean temperature and salinity. Brine rejection associated with sea-ice formation tends to destabilise this vertical structure, inducing deep-ocean convection, with a corresponding increase of oceanic heat flux into the mixed layer. This heat melts sea ice, or inhibits further sea-ice growth, creating a negative feedback. The stability of the upper ocean is intimately related to the amount of sea-ice growth. Too much sea-ice growth, or too little atmospheric fresh-water input to the upper ocean, can lead to a situation where the magnitude of mixed-layer salinity approaches that of deep-water salinity. This causes continual deep convection, which results in a near-uniform vertical ocean temperature and salinity column. The surface water in such a “thermal-mode” system is too warm for sea-ice formation to occur. The convective heat is released as a sensible-heat flux across the open ocean surface. The Weddell polynya is a good example of a regional-scale thermal-mode event (see Martinson, 1990 and references therein). The net heat loss from ocean to atmosphere in the thermal mode is an order of magnitude higher than in the stable mode. To date, the sensitivity of the upper-ocean/sea-ice interaction to variations in the surface fresh-water flux has not been directly investigated.
A variety ofindireel methods have been used to estimate the oceanic heat flux in the Southern Ocean. Gordon (1981), using mean monthly climatologies of sea-surface temperature, air temperature, dew-point temperature, wind speed and cloud cover for the 60 70 S latitude band, calculated a mean annual sea-to-air heat exchange of 31 Wm −2. Gordon and Huber (1990) estimated the cntrainment rate of Weddell Deep Water into the mixed layer using observed oxygen concentrations. They found that the associated vertical heat flux averages 41 wm −2 during the active winter entrainment period. For individual hydrographie stations I his value is as high as 100 wm −2. Assuming a summer heat flux of 2 wM−2 due to vertical diffusion of heat, they concluded that the mean annual oceanic heat flux for the area is 16 wm −2.
Direct measurement of oceanic heat flux was attempted in the Antarctic Zone Flux Experiment carried out in the eastern Weddell Sea duringJuly-August 1994 (Reference McPheeMcPhee and others, 1996). During an observed atmospheric storm event, the measured upward oceanic heat flux reached 100 wm−2 over a warm-water anomaly in the pycnoclinC. Where the mixed layer was both cooler and deeper, the ocean heat flux was 25 wm −2. Unfortunately, available measurements were sparse in both time and space. However they did point out that large variations in upper ocean temperature structure, and hence in vertical oceanic heat flux, do exist.
Coupled ocean/sea-ice modelling can give valuable insight into the spatial and temporal variability of the oceanic heat flux and the processes responsible for controlling it. Few attempts have been made to explicitly calculate oceanic-heat flux in the Southern Ocean. Reference Lemke, Owens and HiblerLemke and others (1990) coupled a dynamic/thermodynamic sea-ice model to a one-dimensional mixcd-layer/pycnocline ocean model, and applied it to the Weddell Sea region. They found the oceanic heat flux to have a mean of around 3 wm−2. A similar study by Reference Stössel, Lemke and OwensStössel and others (1990) for the entire Southern Ocean gave the same basic result. These studies did not incorporate the full complexity of the ocean's dynamic and thermodynamic circulation. The only Antarctic ocean/sea-ice model to include a full three-dimensional ocean is that of Reference HäkkinenHäkkinen (1995). That study showed the ocean heat flux to be highly spatially variable, with local annual means ranging from 0 to 100 wm −2. It also suggested that an adequate surface fresh-water flux is essentia] for modelling the coupled system. However, it did not answer the question of the seasonal variability in oceanic heat flux, or investigate its sensitivity to variation in the surface fresh-water flux. The latter is important, as the atmospheric precipitation minus evaporation is not well known in the Southern Ocean seasonal sea-ice zone.
As numerical models become increasingly sophisticated and of higher resolution, we expect that the corresponding calculations of oceanic heat flux will become more accurate. in this paper we: (1) present a regional high-resolution coupled ocean/sea-icc model and apply it to a region of East Antarctic seasonal sea ice; (2) use this model to calculate the magnitude of oceanic heat flux along with its time and space variability; and (3) examine the sensitivity of oceanic heat flux to a range of surface fresh-water input scenarios. It turns out that the coupled model is very sensitive to the fresh-water input, with too small a fresh-water surface flux leading rapidly to a thermal-mode ocean/sea-ice system.
2. Model Description
The ocean model used here is a version of the Hamburg Ocean Primitive Equation model (HOPE), described in detail in Wolff and others (1997). The HOPE model has a free surface and fully resolves the bottom topography. Horizontal discretisation is on a spherical staggered Arakawa E-grid (Reference Arakawa and LambArakawa and Lamb, 1977) with an effective resolution of ~ 19.5 km between like (scalar or vector) points. This allows for realistic simulation of the large-scale oceanic eddies. The model domain (Fig. 1) is bounded by the Antarctic continent to the south, and closed with an artificial wall at latitude 57° S. East-west boundaries are periodic (re-entrant), at longitudes 120° and 140° E, respectively. There are 12 vertical levels, with six of these in the upper 300 m (at 5, 15, 35, 75, 150 and 300m). The increased vertical resolution near the surface is necessary to resolve the mixed-layer/pyc-nocline ocean features. The realistic bathymetry consists of a continental shelf, slope and deep basin. The model time step is 1 hour. Newtonian (linear) relaxation to climalolog with a 2 year time-scale is applied to the lower six layers c the ocean, where temperature and salinity are restore! using Reference Levitus, Boyer and AtonovLevitus and others (1994a, b) datasets. This prevent the considerable cooling of deep water which would othei wise have resulted from the time mean net loss of hea through the ocean surface, due to the regional nature c the model.
Hatched area indicates the spatial coverage of our regional model which includes a highly resolved shelf, continental slope and deep-ocean topographic features to the north. The grid resolution is 0.5° in longitude, 0.25° in latitude.

The ocean has been coupled to a dynamic/thermodynamic sea-ice model, which allows prognostic calculation of sea-ice thickness, compactness and velocity. Sea-ice motion is determined by the momentum balance equation

where  is the sea-ice velocity, f is the Coriolis parameter,
 is a unit vector directed away from the Earth's centre, C is the sea-surface elevation,
 is the wind stress,
 is the ocean current stress, hI
is the ice thickness, pi
is the ice density, g is the Earth's gravity, t is the time, and
 is a two-dimensional stress tensor associated with internal ice stress.
The choice of  or sea-ice rheology, is an important component of the momentum balance, determining the way in which ice flows, rafts, cracks, ridges and deforms. Following Reference HiblerHibler (1979), internal ice stress is modelled in analogy to a non-linear viscous compressible fluid obeying the constitutive law

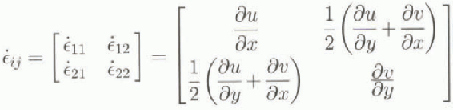
The strain-rate tensor is given by
PI
is an internal ice-pressure term,  is a non-linear bulk viscosity, and
 is a non-linear shear viscosity, defined as



Here e = 2 is the ratio of the principal axes of the yield ellipse, and the ice pressure is a function of ice compactness, A, and thickness h.

where p* and C are empirically derived constants with values taken from Hibler (1979), p*= 5000 Nm −1 and c = 20.
Sea ice is also subject to thermodynamic forcing. We use a Parkinson and Washington (1979)-style surface heat budget with parameterisations of incoming shortwave and longwave radiation, outgoing longwave radiation, and turbulent sensible- and latent-heat fluxes. The internal sea-ice thermodynamics are modelled with a Reference SemtnerSemtner (1976) zero-layer model. The surface heat balance is solved separately for open-ocean and ice-covered areas in each gridcell. Atmospheric precipitation is converted to snow when the air temperature falls below 0°C Conduction of heat through the sea-ice/snow layer is simplified by converting sea-ice and snow thickness to an equivalent sea-ice thickness according to
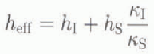
where K denotes thermal conductivity, and the subscripts are for sea ice and snow . when the snow/ice interface falls below the sea surface, enough snow is converted to sea ice to raise the interface to the sea surface.
The model is initialised with a zonaliy averaged climatology of temperature and salinity taken from Levitus and others (1994a, b) dataset. Mean monthly wind-stress forcing is from Reference Hellerman and M.Hellerman and Rosenstein (19831. Mean monthly air temperatures are taken from the Reference OberhuberOberhuber (1988) allas. A constant cloud cover of 90% is chosen for the surface heat-budget parameterisations, due to a lack of available forcing data.
3. Ocean Heat Flux and Surface Freshwater Flux
Oceanic heat flux is calculated as the net contribution to the upper level of the model from ocean sources. The primitive equation model provides three sources of oceanic heat to the surface layer: heat transport due to the three-dimensional advection, Qadv; vertical diffusion of heat, Qdiff; and heat due to convective processes, Qconv When sea ice is present in a gridcell the available heat is used for melting. Hence the oceanic heat flux, Qohf, which will melt sea ice or inhibit its growth, is given by

A series of four 20 year simulations were run to determine the effect of surface fresh-water input on the stability of the upper ocean. Here we analyze model output from three cases of constant precipitation minus evaporation at rates of 30, 50 and 70 cm a−1, and from a simulation using a time mean monthly precipitation field which varies spatially (personal communication from P.A. Reid, 1997), obtained from the fully coupled atmosphere/sea-ice/ocean model CSIRO 9 (Reference McGregor, Gordon, Watterson, Dix and RotstaynMcGregor and others, 1993). CSIRO 9 is a coarse-resolution global circulation model with nine vertical levels in the atmosphere and R21 horizontal resolution. The CSIRO 9 output has a tirne-and-space mean precipitation over our model area of 74 cm a−1, with lower values near the Antarctic continent, and higher values to the north. The use of a spatially constant precipitation minus evaporation is a reasonable approximation for the process study considered here.
Sea-ice area for thefirst JO years of the 30 cm a−1 surface fresh-water flux experiment, showing the transition to a thermal-mode system. Sea-ice coverage was negligible after the first six seasons.
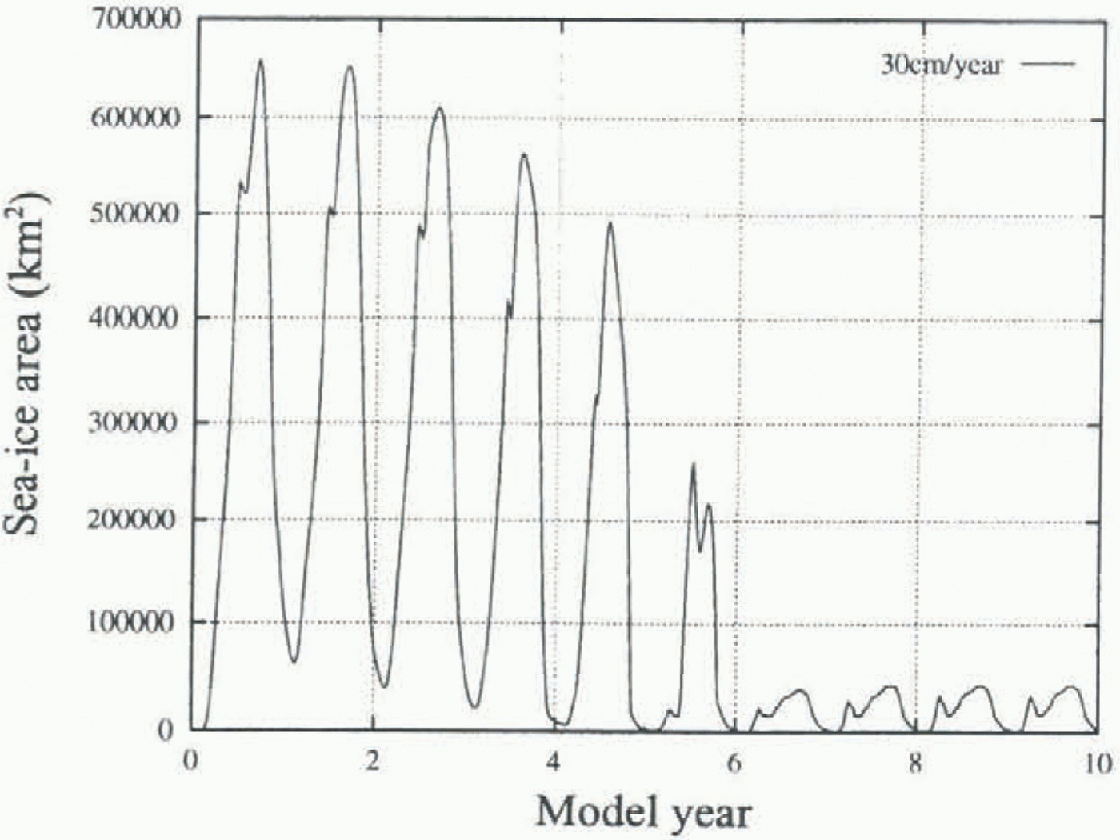
It was found that a stable-mode seasonal cycle is maintained only for the 50 and 70cma−1 realisations and the CSIRO 9 forced run. The 30 cm a−1 case leads rapidly to a thermal-mode system, with very little ice production after the sixth winter (Fig. 2). The evolution of the upper-ocean-layer salinity for all runs is shown in Figure 3. The areal mean salinity is monotonically increasing with respect to decreasing fresh-water input for the constant precipitation runs. This process is highly non-linear. A time series of total sea-ice coverage for the last 5 years of the simulations is
Evolution of ocean surface-layer mean salinity for the 30,50 and 70 cm a−1 constant surface fresh-waterflux experiments and the CSIRO 9 forced model over the 20 years of each simulation.

Total sea-ice area for the last 5 years of the 20year model runs with constant precipitation minus evaporation of 30,50 and 70 cm a−1, and for the CSIRO 9 precipitation run. SSM/1 satellite data of sea-ice area for the modelled area are shown for the years 1988-92.

shown in Figure 4. Sea-ice area from special sensor micro-wave/imager (SSM/I) data corresponding to the model domain for the years 1988-92 is shown for comparison. The phase of maxima and minima for the stable-mode runs is in agreement with the observations. However, the model tends to produce more ice in winter, and melt a greater area in summer. Autumn ice formation also occurs at a faster rate in the model than the observations would suggest. Compared to the autumn freezing rate, the spring melt rate appears to be closer to the satellite estimates.
Figure 5 shows the seasonal cycle of averaged oceanic heat flux for the instantaneous ice-covered area. Oceanic heat flux has been calculated for each model time-step and then averaged onto an annual cycle for the second decade of each simulation. The annual cycle was smoothed with a 10 day running mean. Increased fresh-water input reduces the magnitude of oceanic heat flux, the 50 and 70 cm a−1
Seasonal cycle of net oceanic heatjlux averaged over the second 10 years of the 20 year model runsfor constant precipitation minus evaporation (P — E) of 30 cm a−1 (annual mean 77.1 wm−2); constant P- E of 50 cm a−1 (annual mean 29.7 Wm−2); constant p - E of 70 cm a−1 (annual mean 22.2 wm−2); and using CSIRO 9 precipitation data (annual mean 27.7Wm−2);.

cases having means of 29.7 and 22.1 Wm−2, respectively. Oceanic heat flux for the CSIRO 9 forced run is very similar to that of the constant 50 cm a−1 case. Oceanic heat flux in the 30 cm a−1 run is considerably greater, with a mean of 77.0 wm −2, but this is over a much reduced sea-ice extent. To better understand the seasonal structure of oceanic heat flux we analyzed its breakdown into contributing terms. The result for the 50 cm a−1 run is shown in Figure G. Convective processes dominate for the period March October. An initial peak in convective and oceanic heat flux occurs during the onset of ice formation (late March). A second peak occurs in early June, corresponding to new ice formation and old ice advection in the marginal sea-ice zone. A third peak in oceanic heat flux occurs in mid-January, and is associated with the advection of warm water under the sea ice at this time. The advective heat flux is negligible during the period of active convection, but vertical diffusion is 3-4 wm −2 in this period and is considered significant. This seasonal cycle of three maxima is clearly reproduced each year for the 50 and 70 cm a−1 precipitation runs and the CSIRO 9 run. It is not a result oflong-term time averaging.
Seasonal cycle of the contributing terms to net oceanic heat flux, being convective, diffusive and advective heat fluxes into the ocean surface layer, for the 50 cm a−1 surface freshwaterjlux simulation.

The spatial distribution of oceanic heat flux for the CSIRO 9 forced run is shown in Figure 7. Shown are monthly mean values for the second 10 years of the simulation. Large fluxes of oceanic heat occur in the marginal ice zone during the ice-growth period. Other areas of high ocean-heat flux are near the continent and associated with shallow (~ 200 m) shelf depth.
Discussion
The coupled ocean/sea-ice model is very sensitive to the magnitude of surface fresh-water input. As evidenced by the 30 cm a−1 run, the stability of the upper ocean is greatly reduced for some critical value of fresh-water flux, and when this amount of fresh water is not available the coupled system undergoes a rapid transition (~6 years) into a thermal mode. This sensitivity is not unexpected. Gordon (1981) suggests that the seasonality of Southern Ocean sea ice is strongly dependent on the magnitude of the freshwater input. However, it is reassuring to see it operating so clearly in what is a relatively sophisticated eddy-resolving ocean-ice model.
Seasonal cycle of spatial distribution ofoceanic heat flux for the CSIRO 9 forced realisation. Mean monthly valuesfor each gridcell were determined using outputfrom the second Wyears of the model run. Units are WเN −2.

Our study has demonstrated that regional aspects of atmosphere—ocean interaction in the Southern Ocean sea-ice zone can be highly complex and non-linear. We expect different regional responses around Antarctica due to local variations in the annual cycle of surface fresh-water flux and the stability of the upper-ocean stratification. The latter may vary with changes in bottom topography or large-scale ocean currents. The CSIRO 9 model output shows the region studied to have one of the highest precipitation rates for the latitude band under consideration, which suggests that the occurrence of a large-scale convective polynya is more likely elsewhere in the Southern Ocean. It is worth noting that the oceanic heat flux is relatively insensitive for higher values of precipitation minus evaporation. Hence, we now have a direct estimate of 20-30 wm −2 for this (lux (along with its seasonal variation), for the range of freshwater flux values that we believe is realistic (50-70 cm a−1).
Acknowledgement
We would like to thank the two reviewers for their detailed and valuable comments.



