I. INTRODUCTION
Piezoelectric ceramics exhibit excellent piezoelectric and dielectric properties; however its inherent properties, such as brittleness, nonductility and poor shapeability, limit its applications in areas such as vibration sensing, impact detection, structural health monitoring of wind turbines, and fiber-reinforced structures in aircraft and energy harvesting.Reference Gururaja, Schulze, Cross, Newnham, Auld and Wang1–Reference Newnham, Skinner and Cross4 In piezoelectric composite materials, the high piezoelectric and dielectric properties of lead zirconium titanate (PZT) ceramics combined with the low density and the high flexibility of polymersReference McNulty, Janas and Safari5 make them suitable for aforementioned applications. Among these composites, 0–3 and 1–3 type composites have received much attention. Due to random distribution of PZT particles in the polymer matrix, 0–3 composites have relatively low piezoelectric properties, whereas in 1–3 composites, the piezoelectric properties significantly improve.Reference Taunaumang, Guy and Chan6–Reference Dias and Das Gupta8 The commonly used techniques to fabricate 1–3 composites like dice and fill, injection molding, lost mold, tape casting, relic processing, laser or ultrasonic cutting are expensive and labor intensive, especially at low volume fractions and where a high degree of alignment is required for better voltage sensitivity.Reference Klicker, Biggers and Newnham9–Reference Bowen, Shrout, Newnham and Randall15
It is demonstrated that dielectrophoresis can be used for structuring of PZT particles as columns in a polymer matrix, resulting in composites with quasi 1–3 connectivity.Reference van den Ende, Bory, Groen and van der Zwaag16–Reference Park and Robertson19 This will keep the manufacturing process as simple as 0–3 composites, and consequently, production costs can be kept low. In dielectrophoresis, when a moderate electric field is applied across a suspension of ferroelectric particles in an insulating medium, the particles orient themselves toward the direction of applied electric field. Under the optimum experimental parameters like electric field strength and frequency of the field, the particles attract each other and bring together to form pearl chains parallel to the electric field direction.
The present paper describes an investigation of piezoelectric and mechanical properties of structured PZT–epoxy composites prepared by dielectrophoresis. The results are compared with the corresponding unstructured 0–3 composites. The effect of poling voltage on the piezoelectric properties of the composites is also investigated. The flexural properties of structured and 0–3 composites were analyzed using three-point bending tests.
II. THEORY
Many analytical and numerical models have been proposed in literature for piezoelectric and dielectric properties of 0–3 and 1–3 piezoelectric composites by accounting the volume fractions of constituents, morphology, aspect ratio of the particles, polymer ceramic interphase, and particle to particle connectivity.Reference van den Ende, Bory, Groen and van der Zwaag16, Reference Yamada, Ueda and Kitayama20–Reference Lichtenecker25 Yamada et al.Reference Yamada, Ueda and Kitayama20 proposed an analytical model by assuming the composite as a uniform distribution of ellipsoidal particles in an isotropic polymer matrix. The present experimental results of the 0–3 composites are compared with this model. The dielectric constant of the composite is given by Eq. (1):
 $${\rm{\varepsilon }}_{\rm{c}} = {\rm{\varepsilon }}_1 \left( {1 + {{n\varphi ({\rm{\varepsilon }}_2 - {\rm{\varepsilon }}_1 )} \over {n{\rm{\varepsilon }}_1 + ({\rm{\varepsilon }}_2 - {\rm{\varepsilon }}_1 )(1 - \varphi )}}} \right)\quad,$$
where εc is the dielectric constant of the composite, ε1 and ε2 are that of the matrix and ceramic particles, respectively, ϕ is the volume fraction of the ceramic, and n is the inverse of the depolarization factor for an ellipsoidal particle in the direction of applied electric field. All the symbols keep the same meaning for the rest of the discussions. Bowen et al.Reference Bowen, Newnham and Randall23 derived an expression for the dielectric constant of composites having particles aligned into chain-like structures along a particular direction by considering the system as a collection of one-dimensional (1D) chain of particles separated by polymer gaps. The expression is as follows:
 $${\rm{\varepsilon }}_{{\rm{DEP}}} = \varphi \left( {{{R{\rm{\varepsilon }}_1 {\rm{\varepsilon }}_2 } \over {{\rm{\varepsilon }}_2 + R{\rm{\varepsilon }}_1 }}} \right) + (1 - \varphi ){\rm{\varepsilon }}_1 \quad,$$
where εDEP is the dielectric constant of dielectrophoretically structured 1–3 composites and R is the ratio of average particle size to the effective interparticle distance.
Yamada’s model for piezoelectric charge constant in the poling direction of 0–3 composites given by:
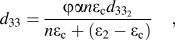 $$d_{33} = {{\varphi {\rm{\alpha }}n{\rm{\varepsilon }}_{\rm{c}} d_{33_2 } } \over {n{\rm{\varepsilon }}_{\rm{c}} + ({\rm{\varepsilon }}_2 - {\rm{\varepsilon }}_{\rm{c}} )}}\quad,$$
where α is the poling ratio of the PZT particles and εc is the dielectric constant of the composite given by Eq. (1). Van den Ende et al.Reference van den Ende, Bory, Groen and van der Zwaag16 proposed an analytical equation for d 33 of the structured composites by treating the particle–matrix alterations in the chains as two capacitors in series in the electrical domains and two springs in series in the mechanical domain. The resulted equation is given by [Eq. (4)]:
 $$\!\!\!d_{33_{{\rm{DEP}}} } = {{(1 + R)^2 {\rm{\varepsilon }}_1 \varphi Y_{33_2 } d_{33_2 } } \over {({\rm{\varepsilon }}_2 + R{\rm{\varepsilon }}_1 )[(1 + R\varphi )Y_{33_2 } + (1 - \varphi )RY_1 ]}}\quad,$$
where Y 1 and  $Y_{33_2 } $ are elastic moduli of the polymer matrix and that of the ceramic in the direction of chains.
The flexural properties of the composites are determined according to the force–deflection curve of three-point bending experiments. The flexural strength and modulus are calculated according to the following equations:
 $${\rm{\sigma }}_{\rm{f}} = {{3P_{\rm{f}} L} \over {2bh^2 }}\quad,$$
 $$E_{\rm{f}} = {{L^3 m} \over {4bd^3 }}\quad,$$
where P f is the load at fracture, L, b, and h are distance between the supporting head, width, and thickness of the sample, respectively, and m is the slope of the initial straight line portion of the load–deflection curve.Reference Dowling26
III. EXPERIMENTAL
A. Polymer–epoxy
Even though the polymer matrix phase is usually piezoelectrically inactive, its properties like compliance, dielectric constant, and loss tangent significantly affect the end properties of the composites. In addition to this, the viscosity and curing time also affect the structuring of the ceramic particles during dielectrophoresis.Reference van den Ende, Bory, Groen and van der Zwaag16, Reference Park and Robertson19 The epoxy selected for present investigation is based on two optically clear component systems (Epotek 302-3M, Epoxy Technology Inc., Billerca, MA). The resin, based on diglycidyl ether of bisphenol-A, is the prepolymer, and the curing agent is based on the multifunctional aliphatic amine, poly(oxypropylene) diamine. As per the manufacturers’ data sheet, the system exhibits a viscosity of 0.8–1.6 PaS after mixing and at room temperature (25 °C). This relatively high viscosity of the matrix prevents quick settling of dense ceramic particles during dielectrophoresis.
B. Ceramic—PZT 507
A donor-doped soft PZT (PZT 507) powder (Morgan Electro Ceramics, Ruabon, U.K.) is used for present study. This material is relatively easy to polarize and has a dielectric constant (εr33) of 4400, piezoelectric constant (d 33) of 820 pC/N, and a Curie temperature (T c) of 165 °C. In commercially available PZT powders, the compositional homogenization completes only after sintering, the process just before the final device fabrication. It is previously reported that further calcination of commercial PZT powders improves the piezoelectric properties of the resulted composite.Reference van den Ende, De Almeida and van der Zwaag27, Reference Babu, van den Ende and De With28 Hence, it is decided to heat-treat the as-received PZT 507 powder at 1200 °C for 1 h to improve the crystal structure and compositional homogeneity. Further, to get rid of agglomeration of particles, the calcined powder is ball milled with 5-mm zirconium balls for 48 h in cyclohexane. After ball milling, the PZT power is sieved using a 60-μm mesh filter, and the cyclohexane is evaporated at room temperature. The obtained PZT powder is heated at 150 °C for 1 h to remove absorbed moisture. The phase purity and compositional homogeneity are studied using a Bruker-AXS D5005 diffractometer (Germany), which uses Cu Kα1 (0.15406 nm) x-rays.
C. Composite fabrication
The structured PZT–polymer composite was prepared by applying an alternating (1 kV/mm) voltage across the suspension of ceramic particles in the epoxy matrix during the early stage of curing. The voltage was kept over the sample until the epoxy was cured. The completely cross-linked circular disk-shaped samples of dimensions 16 × 0.5 mm were fine polished on both sides and postcured at 100 °C for 1 h. The cross section of the structured and 0–3 composites were analyzed using a JEOL JSM-7500F scanning electron micrograph (Tokyo, Japan).
D. Electrical property measurements
Four test samples were electroded on both sides by gold sputtering for electrical property measurements. The composite samples were then poled in an organic oil (rapeseed oil) at 100 °C by keeping the voltage on for an hour; afterward, the oil temperature was cooled down to room temperature in the presence of poling voltage. The dielectric constant of the composites were measured using parallel-plate capacitor method using an Agilent 4263B LCR meter (Japan) at 1 V and 1 kHz. The d 33 of the composites were measured using a KCF technologies PM3001 d 33 meter (State College, PA).
E. Mechanical property
Mechanical property of the composites was tested in a three-point bending test setup using ZwickRoell 20 kN tensile bench (Germany) with 1 kN load cell and a cross-head speed of 0.5 mm/min at ambient temperature. Rectangular specimens with dimensions 10 × 5 × 2 mm were tested and an average of four specimens of each composition was reported.
IV. RESULTS AND DISCUSSION
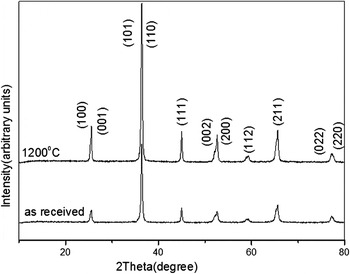
X-ray diffraction (XRD) was used to identify the phases present in the powder and the diffraction pattern indexed with a reference pattern for PZT (ICDD Card No. 33-0784). PZT solid solution exhibits enhanced piezoelectric properties at the morphotropic phase boundary where tetragonal and rhombohedral phases coexist.Reference Hiremath, Kingon and Biggers29 From the XRD pattern (Fig. 1), it is clear that the present PZT powder exhibits rhombohedral (200) and tetragonal peaks (002) and (200) together. The effect of calcination temperature on the piezoelectric properties of PZT 5A4 powder was previously investigated, and it has been reported that further calcinations of commercially available PZT powder improve the compositional homogeneity and thereby the piezoelectric properties.Reference van den Ende, De Almeida and van der Zwaag27, Reference van den Ende, Groen and van der Zwaag30 From Fig. 1, it is clear that the crystallinity increases for the powder calcined at 1200 °C compared to the as-received PZT powder, which will lead to better piezoelectric properties.
XRD pattern of as-received PZT powder and calcined at 1200 °C.

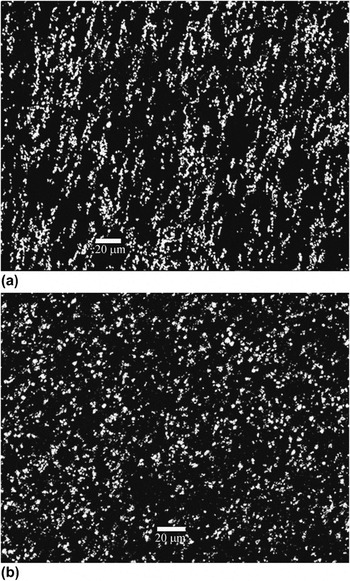
Figure 2 shows the scanning electron microscopy image of a 10 vol% PZT composite of a dielectrophoretically structured quasi 1–3 composite [Fig. 2(a)] and a 0–3 [Fig. 2(b)] composite. It is evident from the micrograph that during dielectrophoresis, PZT particles are oriented and do form short columns of particles along the electric field direction. The average particle size distribution of PZT powder is calculated using the software package ImageJ and was around 0.5–2 μm range.
Scanning electron micrographs of dielectrophoretically structured (a) and 0–3 (b) PZT–epoxy composites.

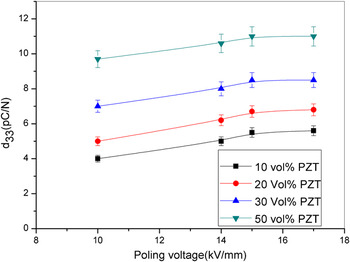
The piezoelectric properties of the composites depend on the poling state of the active PZT phase, in addition to the connectivity of the PZT phase. Figure 3 shows the variation of piezoelectric charge coefficient, d 33, of structured composites as a function of different poling fields for various volume fractions of PZT. The poling temperature and duration were fixed at 100 °C and 1 h for all the experiments. Lee et al.Reference Lee, Halliyal and Newnham31 investigated the effect of poling voltage and time on the piezoelectric properties of 70 vol% loaded PbTiO3 epoxy composites, and they observed almost a saturation of piezoelectric properties with a poling field of 8 kV/mm for a poling duration of 20 s. It is seen that the d 33 value increases with the poling field and saturation can be obtained above 15 kV/mm.
Effect of poling field on d 33 of structured composites for different volume fractions of PZT in epoxy matrix.

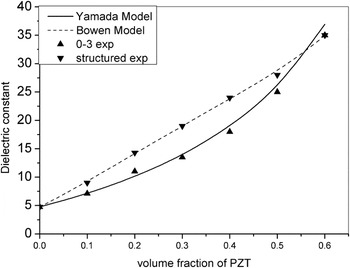
The effect of dielectrophoretic alignment of PZT particles on the dielectric constant of the composites was compared with unstructured composites in Fig. 4. The structured composites exhibit higher dielectric constants than those of the unaligned composites. During the dielectrophoresis process, the PZT particles are redistributed to form fibrils in the electric field direction, and hence, the properties are also enhanced in that direction. The experimental dielectric constants of the structured and randomly distributed ceramic polymer composites were compared with the models proposed by Bowen et al. and Yamada, respectively [Eqs. (1) and (2)].
Variation of dielectric constant of the composite compared with theoretical models as a function of PZT volume fraction in epoxy matrix.

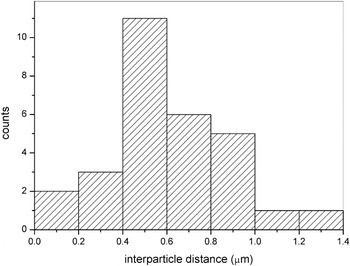
It is noted that the experimental dielectric constant of the 0–3 composites match very well with the values predicted by Yamada’s model with a shape parameter n of 4.56. Bowen et al. model was formulated by treating the system as 1D chain of ceramic particles separated by polymer, and the resulting expression for the structured composites is given by Eq. (2). The present experimental dielectric constant of the structured composites is substituted in the Bowen’s model, and the interparticle distance is calculated, which is in the range of 0.40 μm. This is in the same range as the interparticle distances calculated from scanning electron micrographs (SEMs) using ImageJ softwareReference Rasband32 of which the calculated distribution is shown in Fig. 5. Initially, the contrast of the SEM images was adjusted to clearly distinguish between particle and matrix, and then, distance between particles was measured over 50 particles.
Interparticle distance from SEM micrograph of 10 vol% filled structured composites.

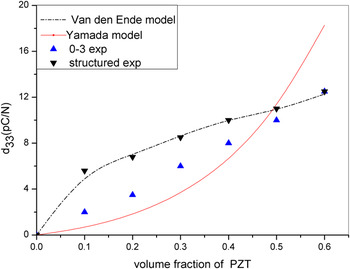
In Fig. 6, the experimentally observed d 33 values of both structured and 0–3 composites were compared with Yamada’s modelReference Yamada, Ueda and Kitayama20 and the model proposed by van den Ende et al.Reference van den Ende, Bory, Groen and van der Zwaag16 [Eqs. (3) and (4)], respectively. From Fig. 6, it is clear that the structuring of PZT particles significantly improved the d 33 values especially at lower PZT volume fractions. The interparticle distance was also calculated from Eq. (4) by fitting the experimental d 33 values and it is 0.40 μm, in good agreement with the value obtained from dielectric constant model, which clearly indicates the structuring of particles during dielectrophoresis, consistent with earlier findings.Reference van den Ende, Bory, Groen and van der Zwaag16
Variation of d 33 of structured and 0–3 composites compared with theoretical models as a function of volume fractions of PZT in epoxy matrix.

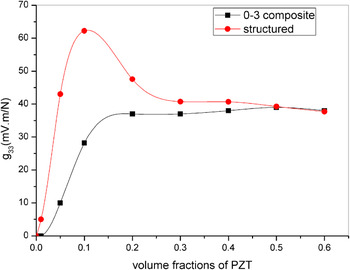
The piezoelectric voltage coefficient is defined as the ratio of g 33 = d 33/ε33. The variation of g 33 of the composites as a function of PZT volume fraction is depicted in Fig. 7. The structured composites with 0.1 volume fraction of PZT exhibit highest voltage coefficient. For these composites, the increase in d 33 is more rapid than the increase in dielectric constant especially at lower volume fractions. Therefore, the voltage coefficient of these composites exhibits a maximum at low volume fractions.
The dependence of g 33 of structured and 0–3 composite as a function of PZT volume fractions in epoxy matrix.

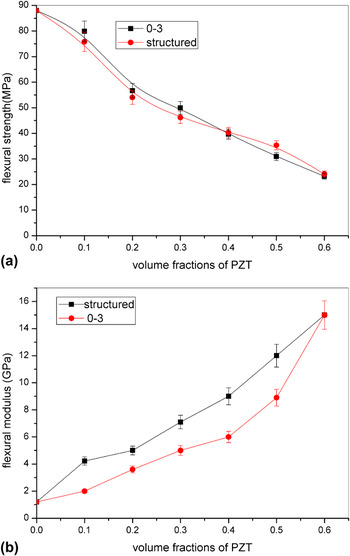
Flexural strength of the composite is defined as the ability of the materials to resist deformation under bending load. The flexural strength of the composites depend on their failure mechanisms such as tensile failure, compressive failure, and shear failure. These failure mechanisms closely related to filler morphology, particle–matrix interface properties and its relative content, and the amount of porosity.Reference Zakari, Laurent and Vaculin24 The flexural strengths and flexural moduli of structured quasi 1–3 composites and 0–3 composites are presented in Fig. 8. From this figure, it is clear that the flexural strength of the composite decreases with increasing amount of PZT loading in the polymer matrix for both structured and nonstructured composite. It is mainly attributed to the fact that as the PZT content increases, the ability of matrix to deform plasticity is also reduced. Rashid et al.Reference Rashid, Akil, Ariffin and Choong Kooi33 reported same kind of behavior in alumina–epoxy composites for 0–3 composites. The flexural modulus of the composite [Fig. 8(b)] increases with the increasing PZT content in the polymer matrix. This is mainly due to the inherent stiffness of the PZT particles, which contributes to the higher flexural modulus. Moreover, structured composites exhibit higher flexural modulus than 0–3 composites. The PZT columns formed during dielectrophoresis may restrict the mobility of polymer chains, which increases the flexural modulus of the structured composites.
Variation of (a) flexural strength and (b) flexural modulus of structured and 0–3 composites as a function of PZT volume fraction.

V. CONCLUSIONS
Structured PZT–epoxy composites were fabricated using dielectrophoresis. Piezoelectric and dielectric constants of the structured composites were enhanced in the structured direction. The experimentally observed piezoelectric and dielectric constants of structured and 0–3 composites were found to be correlating the values predicted by theoretical models. The structuring of PZT particles in the composite has been analyzed using scanning electron microscopy. The high piezoelectric voltage sensitivity of the structured composites at the low fractions leads to better flexibility and lightweight. Investigations of mechanical properties reveal that structuring of PZT particles increases the bending modulus of the composite compared to 0–3 composites, whereas the flexural strength of the composite has not changed much with structuring.
ACKNOWLEDGMENTS
This work was financially supported by the Smartmix funding program (Grant No. SMVA06071), as part of the program “Smart systems based on integrated Piezo.” The authors are grateful to Morgan Electro Ceramics for providing the PZT 507 powder used in this research.