I. INTRODUCTION
Recently, metal nanowires have received significant attention in the materials science community.Reference Bulatov, Hsiung, Tang, Arsenlis, Bartelt, Cai, Florando, Hiratani, Rhee, Hommes, Pierce and de la Rubia1–Reference Zhu, Qin, Xu, Fan, Ding, Zhang, Wiley and Wang3 From the perspective of basic theoretical research, one of the outstanding issues regarding metal nanowires is whether plastic-hardening behavior occurs in them. Strain hardening can change the strength of a ductile material by two to three orders of magnitude at low temperature. It should be noted that the strength of metals results from the interactions of dislocations, and the plastic deformation of metals results from the mutual movement of dislocations.Reference Deng and Sansoz4 This basic phenomenon about strain-hardening behavior largely determines the application prospects of metal nanowires. The application of metal nanowires will be limited if strain-hardening behavior does not occur in them. The strain-hardening behavior of metal nanowires should be very different from that in materials at the macroscale due to their small size relative to the sizes of dislocations. To fully understand the strain-hardening behavior of metal nanowires, such a behavior must be investigated on the atomic scale.
Wu et al.Reference Wu, Heidelberg and Boland5 used atomic force microscopy to investigate the bending process of gold nanowires. The results indicated that the load was increased during the plastic deformation of nanowires with a diameter of approximately 40 nm. This load increase indicates that dislocations still accumulate, resulting in strain-hardening behavior. However, Dou and DerbyReference Dou and Derby6 conducted compression experiments on gold nanowires with diameters of 30–80 nm. The level of stress was constant during plastic deformation after elastic deformation by compression, i.e., no strain-hardening behavior was observed. Philippe et al.Reference Philippe, Wang, Peyrot, Hassel and Michler7 performed bending experiments of rhodium nanowires with diameters in the range of 400–1000 nm using a scanning electron microscope; the experiments revealed that the load increased during the plastic deformation stage, and the plastic-hardening phenomenon was observed in the rhodium nanowires.
In summary, the experimental results discussed above are contradictory regarding the strain-hardening behavior in metal nanowires. These contradictory results are primarily due to the inherent inability to directly observe the movement of atoms in current experiments. In addition, many defects such as grain boundaries were present in the metal nanowires used in those experiments. These defects are likely to affect the plastic-hardening behavior. It is nearly impossible to reveal the plastic-hardening behavior of metal nanowires from current experimental results alone. To reveal the plastic-hardening behavior in metal nanowires, atomistic simulation methods must be adopted to help interpret the various experimental results.
Because of their small size, the lack of strain-hardening behavior in single metal nanowires is quite plausible.Reference Appell8–Reference Weinberger and Cai13 However, grain boundaries have a significant impact on the strain-hardening behavior of metal nanowires. Deng and SansozReference Deng and Sansoz14 used molecular dynamics simulation to study the strain-hardening behavior of the simplest grain boundaries: twin grain boundaries in nanowires. The results demonstrated that the hardening phenomenon occurred in some nanowires, and softening behavior was also observed in other nanowires. The authors simulated the plastic-hardening behavior of gold nanowires with three different cross-sectional shapes.Reference Deng and Sansoz15 The simulation results indicated that the cross-sectional shape also affected the strain-hardening behavior. Strain-hardening behavior was observed in nanowires with a circular cross-sectional shape but was not observed in nanowires with square and zigzag cross-sections. Cao et al.Reference Cao, Wei and Ma16 studied the tensile deformation behavior of twinned Cu nanowires and observed strain-hardening behavior under tension. Some researchers also used bicrystalline structures to investigate the deformation process using atomistic simulations.Reference Spearot, Jacob and Mcdowell17,Reference Tucker, Zimmerman and Mcdowell18 Their emphasis focused on the relationship between dislocations and the structure of individual grain boundaries.
Strain-hardening behavior is an important factor affecting the mechanical properties of metal nanowires, constraining their performance, structure, and functional applications. In this paper, atomistic simulations were performed to understand the quasi-static axial tensile behavior of bi-crystal Cu nanowires with an asymmetric grain boundary of varying numbers of atoms and tilt angles at 0 K.
II. METHODS AND SIMULATION MODELS
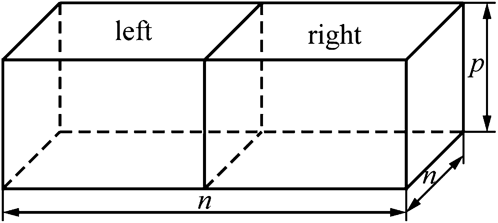
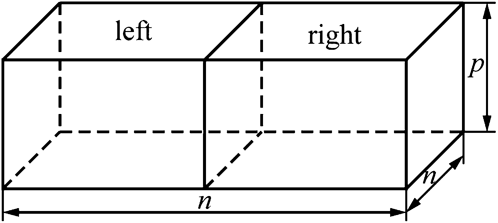
Tensile models of bicrystal Cu nanowires are shown in Fig. 1 and Table I. Figure 1 shows a schematic of the bicrystal Cu nanowire model subject to the tension. The coherent twin boundary is the most common Σ3 GB; however, most boundaries in polycrystalline materials are actually asymmetric tilt grain boundaries. Asymmetric tilt grain boundaries (GBs) present an interesting case for studying dislocation nucleation behavior because of the faceted structure and different adjoining crystal orientations with different Schmid factors. As a classic representation with a high density of coincident sites, the Σ3 system with a <110> tilt axis was chosen in this study, and another two Σ11 GBs and one Σ121 GB were also chosen as comparison. All GBs with varying orientations are listed in Table I. Dimensions of the model, i.e., the number of atoms in the model, affect the slip distance of dislocations. To study the effect of the number of atoms on the strain hardening phenomena, the numbers of 40,000, 170,000, 400,000, and 1,000,000 were used in the same model shown as a, b, c, and d, respectively.
Tensile model of a bicrystal Cu nanowire.
Parameters of the simulations.

Note: a, b, c, and d represent approximately 40,000, 170,000, 400,000, and 1,000,000 numbers of atoms, respectively.
The embedded atom method (EAM) potential was adapted to describe the interaction of the Cu atoms.Reference Daw and Baskes19 In addition, the conjugate gradient method was used to minimize the energy of the atomistic system. After relaxation of the ideal initial configuration, for each step of loading, the left and right ends were moved by a constant displacement of 0.075a (0.271125 Å, a is the lattice constant of Cu) along the X-axis, followed by relaxation. All of the simulations were performed using the open code LAMMPS.Reference Plimpton20 To study the change in the atomistic configuration during deformation, the centrosymmetry parameter,Reference Kelchner, Plimpton and Hamilton21 based on the interatomic distance, was adopted to identify crystal defects. The value of the centrosymmetry parameter increases with increasing lattice distortion.
The virial stress for an atomistic system is defined as
 $${{\rm{\sigma }}^{{\rm{\alpha \beta }}}} = {1 \over V}\left[ { - \mathop\sum\limits_{i = 1}^N {{m_i}v_i^{\rm{\alpha }}v_i^{\rm{\beta }}} + {1 \over 2}\mathop\sum\limits_{i = 1}^{N - 1} {\mathop\sum\limits_{j = i + 1}^N {{{\partial \phi } \over {\partial {r_{ij}}}}{{r_{ij}^{\rm{\alpha }}r_{ij}^{\rm{\beta }}} \over {{r_{ij}}}}} } } \right]\quad ,$$
where V, N, and  $\phi$ are the volume, number of atoms, and potential of the system, respectively, m i and v i are the mass and velocity, respectively, of atom i, r ij is the distance between atoms i and j, and the indices α and β denote the relevant Cartesian components. The first summation term on the right side of Eq. (1) is due to thermal vibration and is zero in static simulations; for the static case, the stress for an atom is defined as
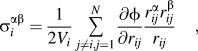 $${\rm{\sigma }}_i^{{\rm{\alpha \beta }}} = {1 \over {2{V_i}}}\,\mathop\sum\limits_{j \ne i,j = 1}^N {{{\partial \phi } \over {\partial {r_{ij}}}}{{r_{ij}^{\rm{\alpha }}r_{ij}^{\rm{\beta }}} \over {{r_{ij}}}}\quad ,}$$
where V i is the volume of atom i.
To calculate the resolved shear stress (RSS) in a slip direction on a slip plane for a general stress state, the Schmid factor tensor is introduced, which is defined as
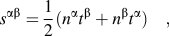 $${s^{{\rm{\alpha \beta }}}} = {1 \over 2}({n^{\rm{\alpha }}}{t^{\rm{\beta }}} + {n^{\rm{\beta }}}{t^{\rm{\alpha }}})\quad ,$$
where n is the slip plane normal (unit vector) and t is the slip direction (unit vector) on the slip plane. Using these terms, the RSS for an atom is calculated as
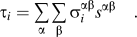 $${{\rm{\tau }}_i} = \mathop\sum\limits_{\rm{\alpha }} {\mathop\sum\limits_{\rm{\beta }} {{\rm{\sigma }}_i^{{\rm{\alpha \beta }}}{s^{{\rm{\alpha \beta }}}}\quad .} }$$
When the RSS reaches the critical value, a dislocation is activated.
III. RESULTS AND DISCUSSION
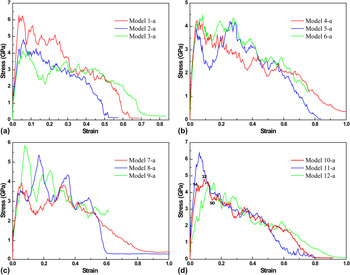
Figure 2 shows the stress–strain curves of the models with different tilt angles in Cu nanowire bicrystals containing approximately 40,000 atoms. The simulations demonstrate that strain-hardening behavior occurs for most tilt angles of the asymmetrically tilted grain boundary in bicrystal Cu nanowires. However, strain-hardening behavior does not occur at the tilt angles underlined in Table I. No strain-hardening behavior occurs in the model with angles 1-a and 9-a. Both of these cases, in which there is no strain-hardening behavior, involve models composed of 40,000 atoms. For some angles, however, strain hardening is also observed in models composed of less than 40,000 atoms. Hence, for bicrystal Cu nanowires with an asymmetrically tilted grain boundary, the strain-hardening phenomenon is related to both the number of atoms and the tilt angle. Strain hardening is observed in all of the models composed of 170,400 or 1,000,000 atoms. The relatively obvious strain-hardening behavior was observed in models 10-a, 8-d, and 12-d; therefore, it would be discussed in comparison among them. The tilt angle and atom number vary in the former two models with the same coincident sites, whereas the latter one with different coincident sites.
Stress–strain curves of the models with different tilt angles in Cu nanowire bicrystals containing approximately 40,000 atoms. (a) Model 1-a, 2-a and 3-a; (b) Model 4-a, 5-a and 6-a; (c) Model 7-a, 8-a and 9-a; (d) Model 10-a, 11-a and 12-a.

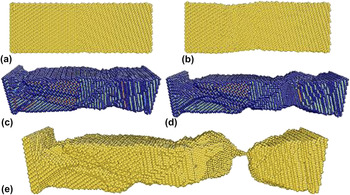
Typical strain-hardening phenomena are observed in models 10-a, 8-d, and 12-d. Understanding the entire strain-hardening process involves analyzing the yield, the strain-hardening behavior, and the fracture of bicrystal Cu nanowires, using these models to represent the materials' deformation behavior in other models. Figure 3 shows the evolution of the atomistic configuration of a Cu bicrystal nanowire under tension using model 10-a. After elastic deformation [Fig. 3(a)], the initial yield begins in the left grain in the bicrystal [Fig. 3(b)]. Next, the neck nucleates [Fig. 3(c)] and is then elongated [Fig. 3(d)]. Finally, total fracture occurs in the model Cu nanowire, as shown in Fig. 3(e).
Tensile deformation process of model 10-a. (a) Elastic deformation, (b) initial yield, (c) necking, (d) neck elongation, and (e) total fracture.

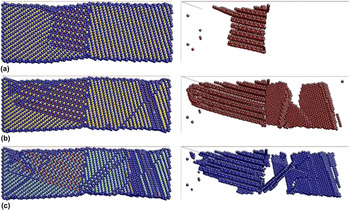
Figure 2(d) shows the stress–strain curve of the tension process of model 10-a. The stress initially decreases at the 14th load step. This decrease indicates the transition from elastic deformation to plastic deformation. A stacking fault nucleation site is formed in the left grain at the 14th load step, as shown in Fig. 4(a). While the fault continues to nuclear and to grow from the GB in the left grain, although the fault continues to grow at the grain boundary from the onset of stretching in the left grain, it has no effect on the increase in stress. With an increase in the applied tension, the fault continuously becomes larger and begins to nucleate at the 50th load step, as shown in Fig. 4(c).
Atomistic configurations of model 10-a at different load steps. (a) Initial yield at the 14th load step. (b) Maximum stress at the 32nd load step and (c) at the 50th load step.

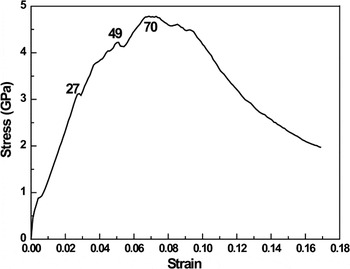
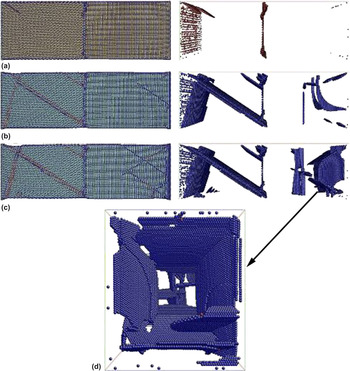
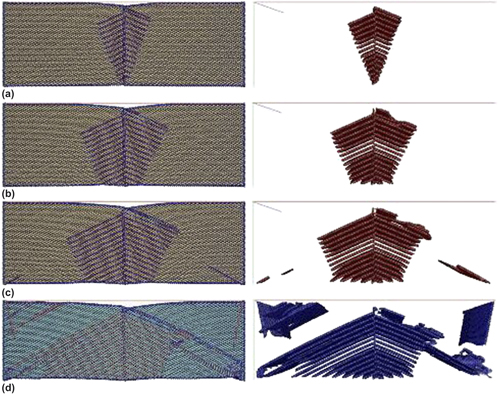
Figure 5 shows the stress–strain curve of model 8-d, containing approximately 1,000,000 atoms. The stress–strain curve is elastic in the first stage. At the 27th, 49th, and 70th load steps, the curve exhibits sudden decreases. Figure 6(a) shows the atomistic configuration at the 27th load step, where the first initial yield occurs. The dislocations appear in two grains along the grain boundary. The stress–strain curve exhibits an increasing trend until the 49th load step, at which point the dislocations propagate. The dislocations distribute along the grain boundary. Finally, at the 70th step, the stress–strain curve exhibits an increase up to the peak stress, where the dislocations continue to be distributed along the grain boundary. At this point, dislocations are also generated at other locations in the two grains. As indicated in this figure, the grain boundary remains unchanged throughout the entire tension process.
Stress–strain curve of model 8-d.

Atomistic configurations of model 8-d at different load steps. (a) Initial yield at the 27th load step. (b) Second stress decrease at the 49th load step. (c) Maximum stress at the 70th load step. (d) Dislocations at the 70th load step in the right grain.

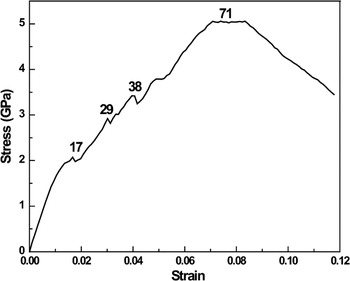
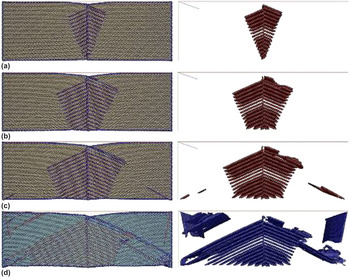
Figure 7 shows the stress–strain curve of model 12-d. The stress–strain curve is elastic in the first stage. At the 17th, 29th, and 38th load steps, the curve exhibits sudden decreases. Figure 8(a) shows the atomistic configuration at the 17th load step. The first initial yield occurs in the model at this point; additionally, the dislocations appear in the two grains along the grain boundary. The initial yield can be attributed to dislocations formed at the grain boundary during the deformation process. Next, the stress–strain curve increases until the 29th load step, at which point the dislocations propagate and distribute along the grain boundary. Finally, at the 71st step, the stress–strain curve increases up to the peak stress, where the dislocations continue to distribute along the grain boundary but are also produced at other locations in the two grains. As indicated in this figure, the grain boundary remains unchanged throughout the entire tension process. Therefore, in this bicrystal Cu nanowire, strain-hardening behavior clearly occurs. From this figure, the GB was found to remain unchanged during the entire tension process. Therefore, GBs are effective obstacles to the motion of dislocations, resulting in the strain hardening of bicrystal nanowires.
Stress–strain curve of model 12-d.

Atomistic configurations of model 12-d at different load steps. (a) Initial yield at the 17th load step. Deformation at (b) the 29th load step, (c) the 38th load step, and (d) the 71st load step.

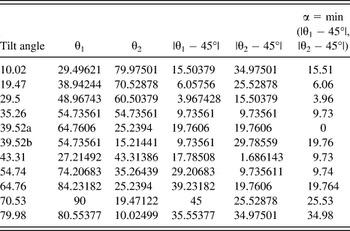
From the metal theory, it is known that the yield stress is related to the crystal orientation factor, and when the normal angle θ between the stress and the gliding plane is 45° and the orientation factor reaches the maximum value of 0.5, the yield stress reaches its minimum and crystal plastic deformation occurs. Thus, the material can reach the critical RSS required for slip under minimum tensile stress. When the orientation factor decreases, the yield stress rapidly increases, resulting in a higher tensile stress that is required for slip to generate plastic deformation. Due to the orientation difference between the two crystal grains in the bicrystal Cu nanowire, the RSS in one grain differs greatly from that in the other under external tensile stress; hence, the plastic deformation of the two crystal grains in the bicrystal occurs at different strains, initially in the crystal grain with an advantageous orientation and a slip system with a large orientation factor. Yield stress is the stress under which the crystal grains generating plastic deformation exhibit the earliest slip, where those initially slipping grains reduce the stress; however, those grains without slip enhance the stress, thus causing strain hardening. In addition, the greater the orientation difference between the two grains is and the bigger the strain that the two grains generate plastic deformation is, the more likely strain hardening is to occur. The angles θ1 and θ2 are defined as the relative included angle between the crystal plane (hkl)1 and the crystal plane {111} and the relative included angle between the crystal plane (hkl)2 and the crystal plane {111}, respectively, i.e., the angle between the respective tensile force and the crystal plane {111}. α is the minimum of all of the values |θ1 − 45°| and |θ2 − 45°|, representing the level of deviation from the maximum orientation factor; the relevant details regarding the data are shown in Table II.
Orientation angles of the different models.

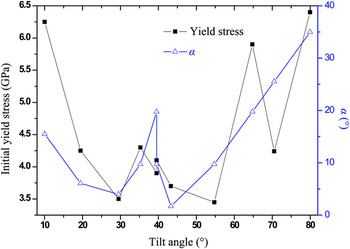
The initial yield stress and α vary nearly accordingly with the increase in the tilt angle, as shown in Fig. 9; thus, the deviation of α from 45° has an effect on the initial yield stress of bicrystal materials, i.e., the initial yield stress of bicrystal materials is determined by the crystal orientation in which slipping is easily generated. The occurrence of strain hardening depends on whether the successor stress, namely the stress concentration occurring at the grain boundary as the second grain slips, exceeds the initial yield stress. In the bicrystal Cu nanowire stretching simulations performed in this study, nearly all of the successor stresses exceed the initial yield stress, thus leading to strain hardening. From the simulated stress–strain curves, compared with Fig. 2, no strain hardening occurs in three cases: 10.02, 35.26, and 64.76; in these cases, small wave crests emerge in the initial yield stress curve, which are probably related to the lack of strain hardening at these three angles.
Relationship between the initial yield stress and α with the tilt angle.

IV. CONCLUSIONS
By simulating the tension of bicrystal Cu nanowires with different tilt angles, the following conclusions can be drawn. (1) The occurrence of strain hardening in asymmetrically tilted Cu nanowires is determined by both the orientation of the two crystal grains involved and the number of atoms composing the models, and strain hardening occurs in almost all orientations; therefore, to increase strain hardening and flow stresses in metal nanowires, special grain boundary defects should be introduced to prevent the easy gliding of dislocations and their exhaustion at the free surfaces. (2) The initial yield stress is determined by the grain whose orientation is closer to 45° among the two crystal grains, resulting in a greater value of the tilting tendency factor and thus generating slips more easily in bicrystal Cu nanowires.
ACKNOWLEDGMENTS
This project is sponsored by the National Science Foundation of China (Grant No. 51175110) and the Fundamental Research Funds for the Central Universities (Grant No. HIT.KLOF.2010006).