I. INTRODUCTION
The corrosion resistance of stainless steels is closely related to the passive film on their surfaces. Understanding of passive film electrical properties is a key factor for protection of stainless steels against localized corrosion attack, as the electrical characteristics of the passive film play an important role in the film breakdown mechanism.Reference Hakiki, Montemor, Ferreira and da Cunha Belo1–Reference Antony, Singh Raman, Mohanram and Raman5 Several studies at the macroscopic scale have shown that the passive films formed on stainless steels exhibit semiconducting behavior and have n- or p-type semiconducting properties.Reference Kim, Cho and Kwon6–Reference Rangel and Silva9 Chemical and electronic structures of passive films are unlikely to be uniform along the stainless steel surfaces, especially for duplex stainless steels. This is because of a combination of austenite and ferrite phases with a complex microstructure, leading to the differences in corrosion resistance between the two phases.Reference Gluszek and Nitsch10–Reference Hakiki, Boudin, Rondot and Da Cunha Belo12 The conductivity of passive film varies depending on parameters, such as film thickness and stoichiometry.Reference Marcus, Maurice and Strehblow13,Reference Amri, Souier, Malki and Baroux14 Due to the fact that the localized corrosion is closely linked to surface preparation,Reference Milosev and Kapun15–Reference Li and Li17 it should be considered another important parameter that affects the passive film properties. Therefore, the surface heterogeneities induced by the surface preparation should be identified and characterized to clarify the role of passive film electrical properties change in relation to the localized corrosion. However, it is difficult to detect such microscopic defects on the passive film surface using classical method at a macroscopic scale. The current sensing atomic force microscopy (CSAFM) is a valuable tool to characterize submicrometer change in electrical properties of the passive film with high spatial resolution.Reference Souier, Martin, Bataillon and Cousty18–Reference Guo, Li, Qiao and Volinsky20
The present study aims to investigate the electrical properties of passive films on duplex stainless steel as a function of surface preparation (grinding, polishing, and electrochemical etching) by using CSAFM. The x-ray photoelectron spectroscopy (XPS) and auger electron spectroscopy (AES) were used to characterize the passive film structure and chemical properties on the surface prepared by different surface preparation procedures.
II. EXPERIMENTAL PROCEDURE
The material used for the experiments was commercial 2507 duplex stainless steel, with the chemical composition shown in Table I, as described in our previous reports.Reference Guo, Li, Shi, Yan, Li and Qiao21–Reference Guo, Zhao, Li, Bai and Qiao24 The specimens were machined into square sheet with 6 mm × 6 mm × 0.7 mm dimensions. To properly compare the effect of different preparations on the passive film electrical properties, CSAFM measurements were conducted on the same area of the specimen using Agilent 5500 AFM (Agilent Technologies). Magnetic force microscopy (MFM) was used to select the scanning region and identify the ferrite and austenite phases before electrochemical polishing began using Dimension Nanoscope V AFM (Bruker Instruments Inc.). Three procedures of surface preparation of the specimen were tested:
(i) Grinding, polishing, and electrochemical etching. Grinding: the surface of sample was wet ground with SiC paper from 230 to 5000 grit.
(ii) Polishing: after measuring the grinding specimen surface by CSAFM, the specimen was further polished using diamond paste to 0.5 μm.
(iii) Electrochemical etching: CSAFM measurements were finished on a polishing specimen, the specimen was then exposed for 20 s in a mixed solution of HNO3:H2O = 1:1 at an applied voltage of 1.2 V.
The chemical composition of the 2507 duplex stainless steel.

After preparing the surface by one of the above procedures, the specimen was kept for 24 h in open air, allowing the formation of a native passive layer.
The chemical composition of the passive film was determined by XPS using an AXIS ULTRADLD instrument (a Versaprobe PHI 5000 apparatus in local mode) with a monochromatic Al Ka radiation source with energy of 1486.6 eV and a pass energy of 40 eV. The spot size of monochromatic Al Ka radiation was 200 μm in diameter for macroscale analysis (power of 50 W) and 20 μm in diameter for microscale analysis (power of 4.5 W). The microscale mode permitted to analyze the austenite and the ferrite separately. The full width half maximum of Ag 3d 5/2 was less than 0.48 for the total energy resolution. To achieve better spectra fitting, the curve fitting was performed using the commercial software XPS Peak, version 4.1, which contains the Shirley background subtraction and Gaussian–Lorentzian tail functions.
The thickness of the passive film was determined by AES using a Cameca-Riber instrument (5 kV electron beam operating at around 1 μA, with a tilt of 45° with respect to the normal) and a 5 keV Argon ion sputtering gun operating at 0.1 μA. The AES beam was of approximately gaussian shape, with a diameter of 5 μm at 5 keV. Acquisitions in direct mode were derivated for the measurement of intensities. The thickness of the passive film was considered to be the sputter depth at which the oxygen concentration has dropped to half its value at the surface.Reference Vignal, Krawiec, Heintz and Mainy8
III. RESULTS
A. CSAFM of the passive film formed on the different prepared surface
Figure 1(a) shows the optical micrograph of specimen after electrochemical etching. Figure 1(b) shows an MFM image (where the ferrite and austenite phases can be easily distinguished and identified) retrieved after polishing but before electrochemical etching. In the same scanning region as the MFM and optical images, the topography images and the corresponding current maps of the passive films formed on the different prepared surface were measured by CSAFM by applying +3 V bias to the probe tip, along with the corresponding current profiles [in Figs. 1(c) and 1(d) (ground surface), Figs. 1(e) and 1(f) (polished surface) and Figs. 1(g) and 1(h) (electrochemical polished surface)].
(a) Optical micrographs of duplex stainless steel surface electrochemically etched with passive film on the surface; (b) MFM image of the boxed area in (a); AFM topography mapping with a line profile of height (in nm) on the same region as (b) and corresponding conductive maps (in nA) with line current profiles for (c) and (d) the ground surface, (e) and (f) the polished surface and (g) and (h) electrochemical etched surface.
Mechanical grinding resulted in a relatively rough surface showing some contamination particles and a few grinding scratches of about 60 nm deep [in Fig. 1(c)]. The average surface roughness of the ground surface was 23.4 nm over an area of 50 μm × 50 μm [Fig. 1(c)]. It was obvious that the distinguishing features were some grinding scratches on the ground specimen surface. It was not possible to recognize the ferrite and austenite phases from that image. The current map [Fig. 1(d)] obtained at +3 V bias at the same time as Fig. 1(c) displayed the nonuniform current distribution. A line profile in the current map showed that the current value was about 2.45 nA. A comparison between the topography image and the current map showed that the high current areas could be related to the topography features, such as grinding scratches, and the direction of current distribution could be related to the grinding direction.
The polished surface showed a less rough surface than the ground surface with fewer polishing scratches [Fig. 1(e)]. The topography image showed that the polished surface was less rough [Fig. 1(e)] and had an average surface roughness value of 2.09 nm, that is, about one 10th of that of the ground surface. It was also difficult to recognize the ferrite and austenite phases on the smooth polishing surface [Fig. 1(e)]. The MFM image [Fig. 1(b)], however, showed the ferromagnetic ferrite and paramagnetic austenite in the same scanning area. Compared with the ground surface, the current map of the polished surface [Fig. 1(f)] was more insulating at the same applied tip bias (at +3 V), and the current on the polished surface was about 75 pA shown in the current line profiles [Fig. 1(f)].
Electrochemical etching in acid solution caused the preferential dissolution of the ferrite phase because of its higher chemical activity. The ferrite (darker color) and austenite (brighter color) could be distinguished clearly in Fig. 1(g) and confirmed by the MFM image [Fig. 1(b)], which was in agreement with our previous work.Reference Guo, Li, Qiao and Volinsky20,Reference Guo, Bai, Xu, Pan, Li and Qiao23,Reference Guo, Li, Qiao and Volinsky25 Specifically, the ferrite matrix was about 35 nm lower than the austenite [Fig. 1(g)]. The average surface roughness of the electrochemical etched surface was 20.6 nm, which was greater than that of the polished surface but smaller than the ground surface. The average roughness on the austenite phase was about 5.26 nm and in the range of 4.38 nm on the ferrite phase. With the aid of the MFM image [Fig. 1(b)] and the topography image [Fig. 1(g)], the ferrite and austenite phases could be easily distinguished and identified in the CSAFM images [Fig. 1(h)]. The current map obtained at the same bias (+3 V) exhibited significant differences between the ferrite and austenite phases. The passive film that formed on the austenite had a much higher current than on the ferrite, which was consistent with our previous work.Reference Guo, Li, Qiao and Volinsky20,Reference Guo, Li, Qiao and Volinsky25 Specifically, the current on the austenite was about 1.08 nA, while on the ferrite it was about 10 pA, as shown in the line profile in the current map [Fig. 1(h)]. It was clear that the current obtained at the same bias to the probe tip (+3 V) was highest for the passive film formed on the ground surface, while that on the polished surface was the lowest.
B. The passive film chemical composition/thickness on three prepared surfaces
AES analysis was performed on the passive films formed on the ground and polished surfaces to characterize the film thickness change induced by surface preparation, as shown in Figs. 2(a) and 2(b). The results indicated that the passive film was thicker on the polished surface (thickness of 2.4 nm) than that on the ground surface (thickness of 1.8 nm).
AES depth profiles of the passive film formed on (a) ground surface and (b) polished surface.
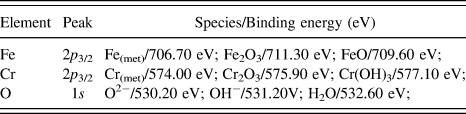
XPS analysis was carried out at the macroscale to examine the change in the film surface composition caused by mechanical grinding and polishing preparation (Figs. 3–5). The spectra for the passive films formed on the ground and polished surfaces revealed almost identical film composition (see Figs. 3–5). The Fe 2p 3/2 spectrum was decomposed into four peaks for the passive films formed on the ground surface attributed to metallic state Fe(met) at 706.7 eV, Fe2+ species at 709.6 eV, Fe3+ species at 711.3 eV, and Fe3O4 species at 706.5 eV [Fig. 3(a)]. The quantitative evaluation yielded 48.28% of Fe(met), 26.16% of Fe2+, 10.9% of Fe3+, and 14.56% Fe3O4. Compared with the passive film on the ground surface, film on the polished surface had a lower concentration of Fe(met) and higher iron oxidized contents [Fig. 3(b)], which were 24.38% of Fe(met), 30.19% of Fe2+, 17.62% of Fe3+, and 27.81% Fe3O4. For the Cr 2p 3/2 spectra in Fig. 4, there were three constituent peaks, representing Cr(met) (574.0 eV), Cr(OH)3 (577.1 eV), and Cr2O3 (575.9 eV). The quantitative evaluation yielded 34.58% of Cr(met), 26.17% of Cr2+, and 39.25% of Cr3+ for the passive film on the ground surface [Fig. 4(a)]. For the film on the polished surface [Fig. 4(b)], the Cr(met) concentration decreased and Cr(OH)3 and Cr2O3 contents increased compared to the film on the ground surface, which were 9.37% of Cr(met), 40.49% of Cr2+ and 50.14% of Cr3+ for the passive film on the polished surface. The O1s spectrum was composed of three peaks, which absorbed water at 532.6 eV, O2− species at 530.2 eV and OH− species at 531.2 eV (Fig. 5). The quantitative calculation revealed 39.47% of O2−, 49.68% of OH− and 10.58% of absorbed water for the passive film on the ground surface [Figs. 5(a)], and 43.74% of O2−, 53.74% of OH− and 12.51% of absorbed water for the passive film on the polished surface [Fig. 5(b)]. Table III summarizes the chemical composition in the passive film formed on the ground and polished surface. Compared with the polished surface, the ground surface had higher concentration of metallic states of iron and chromium but a lower concentration of iron oxides and chromium oxides. Moreover, the O2−/OH− ratio was equal to 0.8 for the ground surface and 1.0 for the polished surface and the O2−/OH− was higher for the polished surface than that for the ground surface. In addition, no significant changes were observed in XPS spectra of other elements, such as nickel and molybdenum and therefore these spectra are not shown.
XPS spectra of Fe 2p 3/2 of the passive film formed on (a) the ground surface and (b) polished surface.
XPS spectra of Cr 2p 3/2 of the passive film formed on (a) the ground surface and (b) polished surface.
XPS spectra of O1s of the passive film formed on (a) the ground surface and (b) polished surface.
AES and XPS analyses were performed at the microscale to examine the film thickness change and composition change on the ferrite and austenite phases of the electrochemical etched surface. After electrochemical etching, no significant changes were detected in the thickness of the passive film on both phases (thickness of about 2.8 nm). The spectra for the passive films formed on both phases show almost the same film composition (see Figs. 6–8). Table IV summarizes the quantitative evaluation of the elemental composition in the passive film formed on the ferrite and austenite phases. Compared with the passive film on the ferrite phase surface, film on the austenite surface had a higher concentration of Fe(met) and Cr(met) but lower iron and chromium oxygen/hydroxides contents (Figs. 6 and 7). The O1s spectrum is also composed of three peaks (Fig. 8). The O2−/OH− ratio was much higher in the ferrite (O2−/OH− = 2.11) than in the austenite (O2−/OH− = 0.93). Such differences were not observed on the two phases of the mechanical ground and polished surfaces. Therefore, it can be assumed that electrochemically etched specimen surface behaves differently than mechanically ground and polished specimen surfaces.
XPS spectra of Fe 2p 3/2 obtained at the microscale in (a) the ferrite and (b) austenite for the passive film formed on the electrochemical surface.
XPS spectra of Cr 2p 3/2 obtained at the microscale in (a) the ferrite and (b) austenite for the passive film formed on the electrochemical surface.
XPS spectra of O1s obtained at the microscale in (a) the ferrite and (b) austenite for the passive film formed on the electrochemical surface.
IV. DISCUSSION
In situ CSAFM observations show that the passive films on the ground, polished, and electrochemical etched surface exhibit different electrical properties. The electrical properties are dependent on the surface preparation. The passive film properties can vary widely with respect to: the alloy composition, structure, film thickness, stoichiometry, etc.Reference Hakiki4 Therefore, the effect of the surface preparation on the local electrical properties can be illustrated by both changes of the topographical properties and the chemical composition and thickness of the films.
The CSAFM current map with the line profile reveals that the passive film on the ground surface has a higher current than that on the polished surface, which could be related to the surface properties [Figs. 1(d) and 1(f)]. It can be seen that the ground surface has some deeper grinding scratches, but the polished surface shows a less rough surface [Figs. 1(c) and 1(e)]. The calculated average roughness of the ground surface is more pronounced than that of polished surface. The rougher ground surface could result in nonuniformity of the surfaces' passive film, especially because some scratches might cause the surfaces' passive film to break. As a result, the conductivity of the film on these areas is higher. In contrast, the passive film formed on the smooth polished surface is more uniform. Moreover, the continuous force applied to the surface might induce very fine grains in the mechanical polishing process.Reference Wang, Tao, Liu, Lu and Lu26 The grain refinement also has a higher surface energy, which is more easily passivated, and thus the passive film is easily formed on the polished surface.Reference Meng, Wang, Han and Ke27,Reference Lv and Luo28 Compared to the polished surface, the ground surface should have lower grains refinement level.Reference Meng, Wang, Han and Ke27,Reference Lv and Luo28 Therefore, the higher conductivity on the ground surface, in comparison with the polished surface, is attributed to the nonuniform and thinner passive film induced by the rougher ground surface properties. This is confirmed by the AES result [Figs. 2(a) and 2(b)], where the passive film thickness on the polished surface is higher than on the ground surface. This is also in agreement with XPS analysis [Figs. 3–5 and Tables II and III], where the O2−/OH− ratio is higher on the polished surface than on the ground one. Additionally, the concentration of iron oxides and chromium oxides on the polished surface is higher than on the ground surface, but the concentration of metallic states of iron and chromium is lower on the polished surface. It matches the oxygen/hydroxides concentration change on the different preparation surface, that is, the concentration of the oxides/hydroxides is higher on the polished surface.
Binding energies of the primary passive film compounds formed on the duplex stainless steel obtained from the XPS spectra deconvolution.
The elemental composition of the passive film formed on the ground and polished duplex stainless steel surface.
For the electrochemical polished surface, the CSAFM current map with corresponding current measurements exhibits significant conductivity differences compared with mechanically ground and polished surfaces. It is known that the electrochemical polishing removes several micrometers of metal, which eliminates the grain refinement effect on the passive film formation.Reference Milosev and Kapun15,Reference Souier and Chiesa19 The electrochemical etching can also remove the strain-hardened layer formed during mechanical grinding, which usually increases the passive film electrical conductivity.Reference Souier and Chiesa19,Reference Vignal, Delrue, Heintz and Peultier29 Therefore, the different passive film conductivity on the electrochemical etched surface, in comparison with mechanical grinded and polished surface, is attributed to surface property change. Although the roughness is higher on the electrochemical etched surface because of the height difference of 35 nm between ferrite and austenite grains. The roughness of the each phase is below 5.5 nm [Fig. 1(g)], thus the roughness has less effect on the passive film formation on the electrochemical polished surface of each phase.
The CSAFM current map with the line profile reveals that the current value of the passive film formed on the austenite is much higher than on the ferrite phase [Fig. 1(h)]. This is because that the ferrite has more chromium than austenite, which is more easily passivated, and thus the chromium oxide is undoubtedly preferentially formed on the ferrite surface in air.Reference Guo, Li, Qiao and Volinsky20,Reference Guo, Li, Qiao and Volinsky25,Reference Garfias-Mesias, Skyes and Tuck30 This matches the XPS measurement results in each phase at microscale. The concentration of chromium oxides/hydroxides and iron oxides in the passive film on the ferrite is higher than on the austenite, but the concentration of metallic states of iron and chromium is lower than on the austenite (Figs. 6 and 7 and Table IV). No significant changes are detected in the thickness of the passive film formed on the ferrite and austenite phases, consistent with previous reports.Reference Vignal, Krawiec, Heintz and Mainy8,Reference Vignal, Delrue, Heintz and Peultier29 Another reason for the lower conductivity of the ferrite phase might be that the ferrite grains behave as blocking electrodes attributed to the significant increase of the O2−/OH− ratio (O2−/OH− = 2.11) in the passive film formed on this phase [in Fig. 8(a)]. In contrast, the fact that the passive film on the austenite phase exhibits the higher conductivity might be because of no blocking electrode effect attributed to the low value of the O2−/OH− ratio (O2−/OH− = 0.93) in the passive film formed on this phase [Fig. 8(b)].
The elemental composition of the passive film formed on the ferrite and austenite of the electrochemical polished duplex stainless steel surface.
V. CONCLUSION
The CSAFM, AES, and XPS measurements were used to characterize the local electrical properties of native passive films formed on the different preparation surface of duplex stainless steel. In situ CSAFM observations show that the passive films on the ground, polished, and electrochemical etched surface exhibit different electrical properties, which are dependent on the surfaces' preparation. The passive film on the ground surface has a higher current than that on both the polished surface and electrochemical polished surface. This could be related to the surface properties induced by surface preparation procedures as evidenced by AFM. This behavior originates not only from the changes in the topographical properties but also from differences in the film thickness and chemical composition induced by the preparation procedures, which are confirmed by AES and XPS measurements. The electrochemical polished surface exhibits significant conductivity differences compared with mechanically grounded and polished surfaces, which is attributed to surface property change. In particular, the current in the passive film on the austenite is much higher compared with that on the ferrite phase for the electrochemical etched surface due to the change in the passive film composition. This is supported by XPS measurements in each phase at the microscale. The results indicate that small differences in surface preparation may cause significant differences in the passive film electrical properties of duplex stainless steel.
ACKNOWLEDGMENTS
The authors acknowledge support from the National Natural Science Foundation of China under Grant Nos. 51271026 and 51431004.