


Attention-deficit/hyperactivity disorder (ADHD) is a high-burden neurodevelopmental disorder that persists across the lifespan. Characterized by persistent, developmentally inappropriate patterns of inattention, hyperactivity, and impulsivity, ADHD is one of the most prevalent neurodevelopmental disorders among children and adolescents. An umbrella review of 13 meta-analyses (covering 588 studies) has reported a global ADHD prevalence of approximately 8.0% among children and adolescents (Ayano et al., Reference Ayano, Demelash, Gizachew, Tsegay and Alati2023). Current diagnostic criteria for ADHD are primarily based on the Diagnostic and Statistical Manual of Mental Disorders (DSM-5; American Psychiatric Association, 2013) or the International Classification of Diseases (ICD; World Health Organization, 2022). ADHD symptoms often persist from childhood into adulthood and are frequently associated with emotional and behavioral difficulties, along with significant functional impairments across multiple domains. Without appropriate intervention, ADHD is associated with long-term adverse outcomes. These include social developmental deficits (e.g., impaired interpersonal relationships), risk-taking behaviors (e.g., traffic violations, substance misuse), and elevated risks of academic underachievement, school dropout, and criminal behavior. These consequences impose substantial social and economic burdens on both individuals and society at large. In the United States, the estimated annual economic burden of ADHD ranges from $143 billion to $266 billion, including healthcare and educational expenditures for children, as well as lost income and productivity in adults. In England and Wales, preliminary expert assessments indicate that baseline costs of the National Health Service (NHS) for ADHD management — excluding pharmacological treatment — total £23 million, with an additional £14 million per year for follow-up care (Popit et al., Reference Popit, Serod, Locatelli and Stuhec2024).
Pharmacotherapy remains the cornerstone of ADHD management for symptom alleviation and long-term functional improvement. First-line agents include psychostimulants (e.g., methylphenidate, amphetamines) and nonstimulants (e.g., atomoxetine, guanfacine, clonidine), with stimulants demonstrating the largest effect sizes. Nonstimulants are reserved for individuals intolerant to stimulants or those with comorbid anxiety disorders (Nazarova et al., Reference Nazarova, Sokolov, Chubarev, Tarasov and Schiöth2022). A substantial treatment gap exists across the continuum of ADHD care. Over 80% of affected adults remain unrecognized or undiagnosed; only half of diagnosed children and a minority of diagnosed adults receive appropriate or evidence-based treatment. Limited recognition in primary care settings, ill-defined referral pathways, and persistent stigma collectively exacerbate this gap (Asherson et al., Reference Asherson, Buitelaar, Faraone and Rohde2016; Faraone et al., Reference Faraone, Banaschewski, Coghill, Zheng, Biederman, Bellgrove, Newcorn, Gignac, Al Saud, Manor, Rohde, Yang, Cortese, Almagor, Stein, Albatti, Aljoudi, Alqahtani, Asherson, Atwoli and Wang2021). Importantly, current medications remain suboptimal: up to one-third of children fail to achieve adequate symptom alleviation with stimulants and experience adverse events (e.g., anorexia, insomnia, headache; Türk et al., Reference Türk, Korfmacher, Gerger, van der Oord and Christiansen2023). Despite advances in genomewide association studies (GWAS), translating genetic associations into actionable, druggable targets remains a major challenge in ADHD therapy. Therefore, optimizing pharmacological strategies through precision prescribing and adverse event mitigation is critical to improve patients’ quality of life, reduce the risk of psychiatric comorbidities (e.g., depression, anxiety), and alleviate the associated socioeconomic burden.
Mendelian randomization (MR) is a genetic epidemiological framework that uses germline genetic variants as instrumental variables to infer causal associations between modifiable exposures and health outcomes. It offers a distinct advantage when randomized controlled trials (RCTs) are impractical or unethical (Li & Gong, Reference Li and Gong2024). Single-nucleotide polymorphisms (SNPs) that function as expression quantitative trait loci (eQTLs) provide a robust tool for evaluating lifelong exposure to gene products and their potential druggability (Schmidt et al., Reference Schmidt, Finan, Gordillo-Marañón, Asselbergs, Freitag, Patel, Tyl, Chopade, Faraway, Zwierzyna and Hingorani2020). By leveraging large-scale summary statistics from ADHD GWAS, SNPs associated with the disease phenotype can be selected as the outcome variable, enabling two-sample MR analyses to estimate the causal effects of gene expression on ADHD risk (Jiang et al., Reference Jiang, Zheng, Fang and Yang2021).
To strengthen causal inference and mitigate bias due to linkage disequilibrium or horizontal pleiotropy, Bayesian colocalization analysis was applied. Furthermore, we employed computational approaches, including gene-set enrichment analysis (GSEA) and protein-protein interaction (PPI) network construction, to elucidate the biological pathways and regulatory mechanisms underlying candidate drug targets (Cao et al., Reference Cao, Yang, Hu and Wei2023).
For drug prioritization, the Drug Signatures Database (DSigDB) was queried to identify small molecules predicted to modulate candidate proteins. Molecular docking simulations were subsequently performed to quantify ligand-target binding affinity and facilitate the identification of potential therapeutic candidates for ADHD (Liu et al., Reference Liu, Cho, Huang, Park, Chaudhuri, Rosewood, Bice, Chung, Bennett, Ertekin-Taner, Saykin and Nho2025).
Given the limited efficacy and substantial interindividual variability of current ADHD therapies, this study aims to integrate large-scale GWAS summary statistics with two-sample Mendelian randomization to estimate the causal effects of gene expression on ADHD risk, thereby prioritizing novel druggable targets. In parallel, we will implement an in silico drug-repurposing pipeline to evaluate the therapeutic potential of existing compounds in ADHD, with the goal of expanding treatment options and improving clinical management.
Methods
Study Design and Overview
We conducted a comprehensive two-sample MR analysis to evaluate the potential causal effects of gene expression on ADHD risk. This study was reported in accordance with the Strengthening the Reporting of Observational Studies in Epidemiology using Mendelian Randomization (STROBE-MR) guidelines. All analyses utilized publicly available, de-identified summary-level data; consequently, no additional ethical approval or participant consent was deemed necessary.
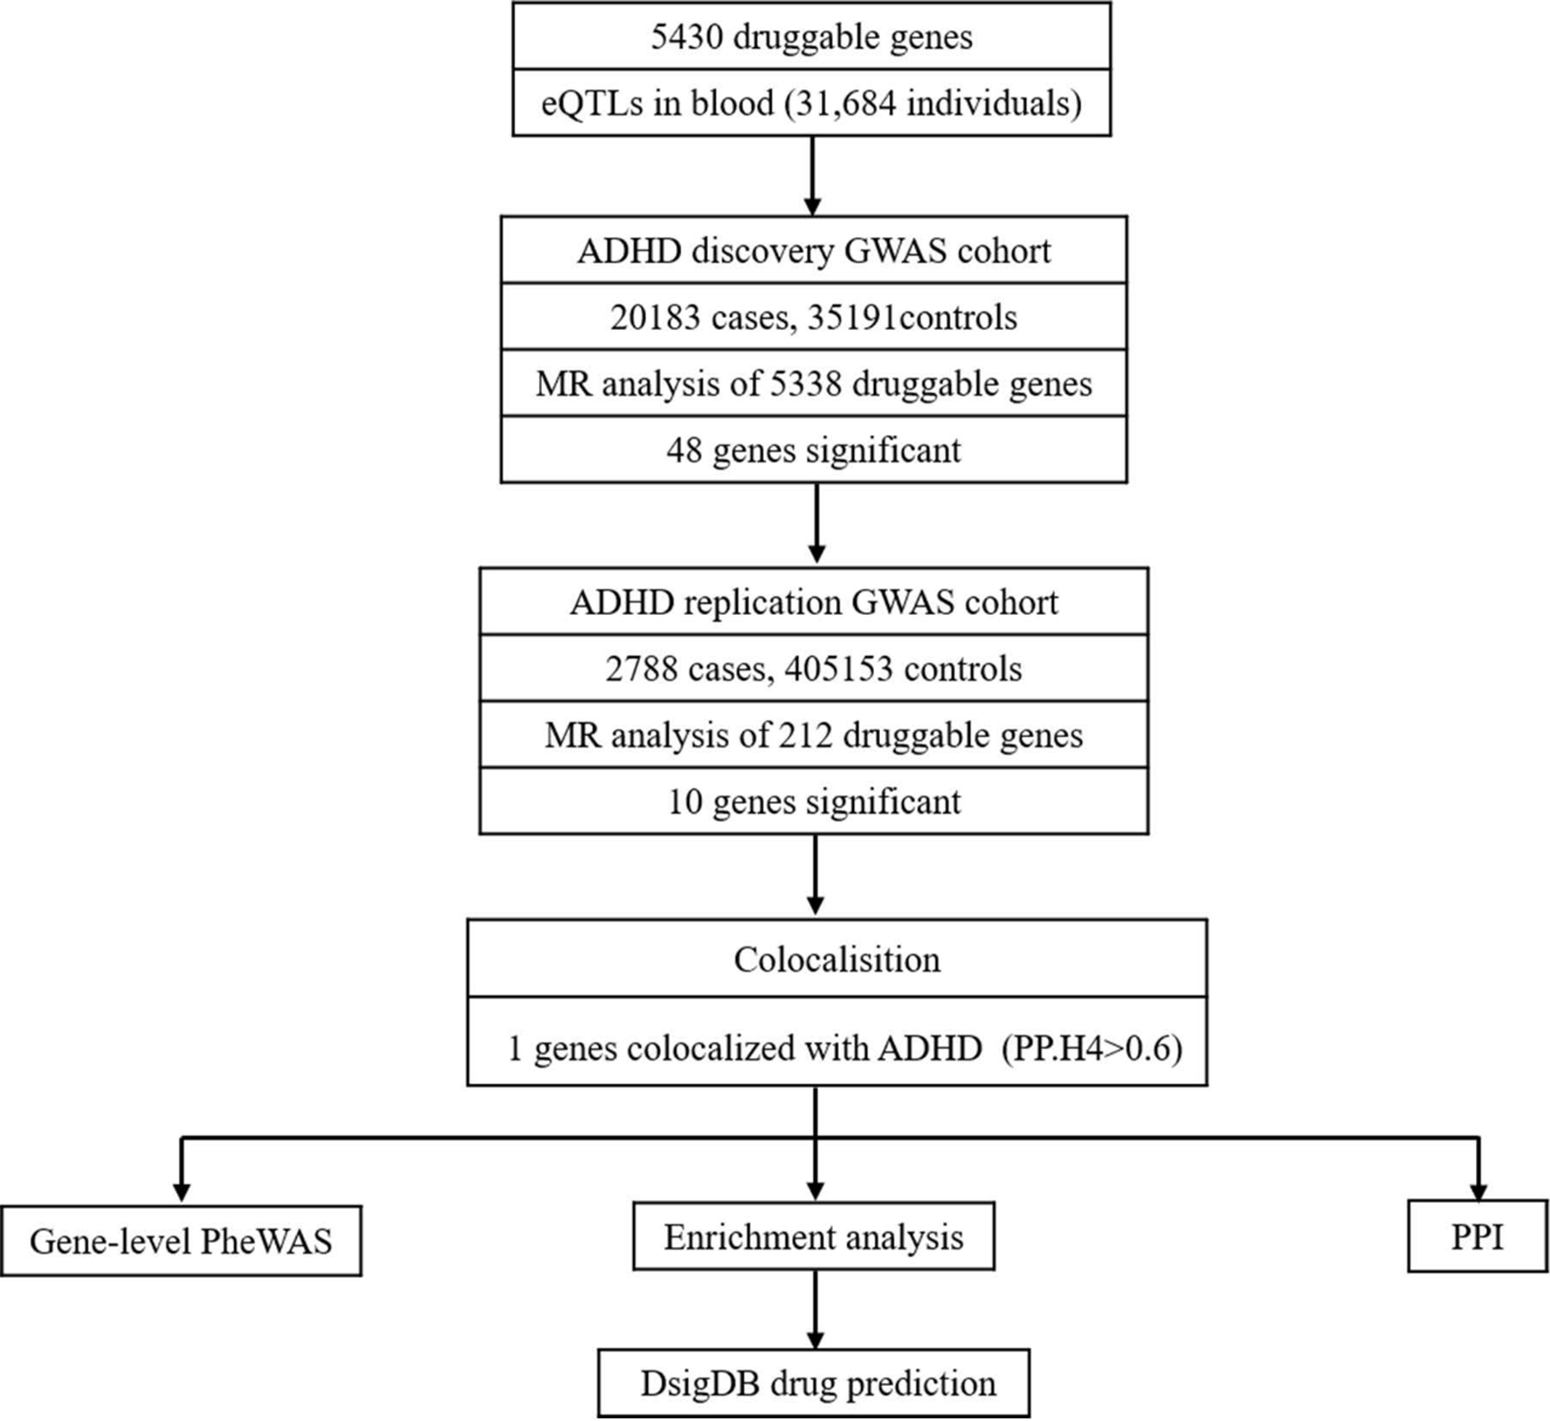
Instrumental variables were selected based on the three core MR assumptions: (1) Relevance — genetic variants must be robustly associated with the exposure (i.e., gene expression in blood or brain tissues); (2) Independence — variants must be independent of confounders influencing both exposure and outcome; (3) Exclusion restriction — variants must affect the outcome exclusively through the exposure (i.e., no horizontal pleiotropy; Lawler & Warren Andersen, Reference Lawler and Warren Andersen2023). A schematic flowchart of the analytical pipeline is presented in Figure 1.
Overview of the study design.

Data Sources
Exposure: eQTLGen Consortium
Expression quantitative trait locus (eQTL) summary statistics were retrieved from the eQTLGen Consortium (https://eqtlgen.org; accessed on 15 January 2024). The consortium previously identified cis-eQTLs in whole blood samples derived from 31,684 unrelated individuals of European ancestry. Following rigorous quality control procedures, 11 million SNPs with a minor allele frequency (MAF) ≥ 1% were tested for associations with 19,960 protein-coding genes, leading to the identification of 10,317 independent expression SNPs (eSNPs) at a false discovery rate (FDR) < 0.05 (Võsa et al., Reference Võsa, Claringbould, Westra, Bonder, Deelen, Zeng, Kirsten, Saha, Kreuzhuber, Yazar, Brugge, Oelen, de Vries, van der Wijst, Kasela, Pervjakova, Alves, Favé, Agbessi and Franke2021).
A list of druggable genes (n = 19,531) was acquired from a previously published computational framework that integrates multitrait GWAS findings with existing drug-target databases to prioritize proteins harboring known or predicted ligands. Notably, this druggable-gene list was applied exclusively for downstream annotation and prioritization of significant MR associations, and was not used as a prefilter during instrumental variable selection, thereby ensuring unbiased instrument selection.
Outcome: ADHD Discovery Cohort. Outcome data were extracted from a GWAS meta-analysis of individuals of European ancestry, comprising 20,183 ADHD cases and 35,191 controls (OpenGWAS ID: ieu-a-1183; https://gwas.mrcieu.ac.uk/; last accessed on 15 January 2024). All cases fulfilled DSM-5 diagnostic criteria or were diagnosed by board-certified pediatricians.
Replication: FinnGen Release 10. For independent validation, we further extracted ADHD summary statistics from the FinnGen Release 10 (R10) cohort (released in December 2023), which comprised 2788 cases and 405,153 controls of Finnish ancestry (https://www.finngen.fi/en; accessed on 20 January 2024). Cases were ascertained based on registry-based ICD-10 codes (F90.0–F90.9) (Kurki et al., Reference Kurki, Karjalainen, Palta, Sipilä, Kristiansson, Donner, Reeve, Laivuori, Aavikko, Kaunisto, Loukola, Lahtela, Mattsson, Laiho, Della Briotta Parolo, Lehisto, Kanai, Mars, Rämö and Palotie2023).
Instrumental Variable Selection
SNP selection criteria. We retained SNPs that were significantly associated with gene expression at the genomewide significance threshold (p < 5 × 10⁻⁸) and were mutually independent. To ensure robust instrumental strength, we required a minimum F-statistic of 10, calculated as F = β2/SE2, which corresponds to an R 2 > .10 in the first-stage regression and a relative bias < 10% in the Wald ratio estimate (Cao et al., Reference Cao, Yang, Hu and Wei2023). Variants with F-statistic < 10 were excluded to avoid weak instrument bias. This procedure yielded 5430 genes with at least one valid instrumental variable for subsequent MR analyses.
Linkage disequilibrium clumping. Linkage disequilibrium (LD) clumping was performed using PLINK 1.9 with the following parameters: --clump-p1 5e-8 (variants must reach genomewide significance for expression), --clump-r2 0.001 (stringent LD threshold to ensure mutual independence), and --clump-kb 10000 (10,000-kb window). The most significant SNP (lowest p value) per LD block was retained to ensure independence among instrumental variables (Cao et al., Reference Cao, Yang, Hu and Wei2023). LD estimates were based on the 1000 Genomes Project Phase 3 European (EUR) reference panel. Both exposure and outcome cohorts were restricted to individuals of European ancestry to mitigate bias arising from population stratification.
Mendelian Randomization Analysis
All MR analyses were performed in R version 4.3.0 using the R packages TwoSampleMR (v0.5.6), gwasglue (v0.0.6), and VariantAnnotation (v1.44). Exposure and outcome datasets were harmonized using the harmonize_data function, which involved aligning effect alleles and ensuring forward-strand compatibility (Davies et al., Reference Davies, Holmes and Davey Smith2018).
Primary methods. For genes instrumented by a single SNP, causal estimates were calculated using the Wald ratio method, which estimates the causal effect as the ratio of the SNP-outcome association to the SNP-exposure association. For genes with multiple instruments, SNP-specific estimates were pooled using three complementary methods: (1) Inverse-variance weighted (IVW) method: Provides the highest statistical power under the assumption that all genetic instruments are valid (no horizontal pleiotropy) (Burgess et al., Reference Burgess, Davey Smith, Davies, Dudbridge, Gill, Glymour, Hartwig, Kutalik, Holmes, Minelli, Morrison, Pan, Relton and Theodoratou2019); (2) Weighted-median estimator: Remains consistent even if up to 50% of the weight is derived from invalid instruments, as it weights each ratio estimate by the inverse of its variance (Bowden et al., Reference Bowden, Davey Smith, Haycock and Burgess2016); (3) MR-Egger regression: Provides a more robust estimate under horizontal pleiotropy by modeling an intercept term that captures the average pleiotropic effect across all instruments (Cao et al., Reference Cao, Yang, Hu and Wei2023). Consistent effect directions across IVW, weighted-median, and MR-Egger estimates were utilized as a qualitative indicator that pleiotropy did not substantially bias the IVW estimate.
Heterogeneity assessment. For genes instrumented by more than two SNPs, Cochran’s Q statistic was computed under both IVW and MR-Egger models to quantify heterogeneity among Wald ratios. The MR-Egger intercept test (p < .05) was used to assess directional pleiotropy (Cao et al., Reference Cao, Yang, Hu and Wei2023). Genes with significant heterogeneity (Q statistic p < .05) or evidence of directional pleiotropy (MR-Egger intercept p < .05) were flagged for careful interpretation. Priority genes that passed the aforementioned quality control criteria — specifically, demonstrating directional concordance across all three MR methods and nonsignificant MR-Egger intercept (p ≥ .05) — were selected for replication in the independent FinnGen R10 dataset.
Colocalization Analysis
Genes demonstrating significant associations in both discovery and replication cohorts were tested for colocalization with ADHD using the R package COLOC (v5.1.0) (Giambartolomei et al., Reference Giambartolomei, Vukcevic, Schadt, Franke, Hingorani, Wallace and Plagnol2014). Prior to colocalization analysis, locus boundaries were defined as ±250 kb flanking the transcription start site (TSS) of each gene. SNPs within these windows were extracted from harmonized datasets generated using TwoSampleMR (v0.5.6).
Default prior probabilities were applied: p1 = 1 × 10⁻⁴ (probability of a variant being associated with gene expression), p2 = 1 × 10⁻⁴ (probability of a variant being associated with ADHD), and p12 = 1 × 10⁻⁵ (probability of a variant being associated with both traits). Posterior probabilities (PP) were calculated for five mutually exclusive hypotheses: PPH0, no association with either trait; PPH1, association with gene expression only; PPH2, association with ADHD only; PPH3, association with both traits but mediated by distinct causal variants; PPH4, association with both traits via a shared causal variant.
A locus was considered to have strong evidence of colocalization if PPH4 exceeded .6. Genes mapping to these loci were prioritized as potential therapeutic targets for ADHD.
Phenomewide Association Analysis
To quantify horizontal pleiotropy and predict potential on-target adverse effects, a comprehensive phenomewide association study (PHEWAS) was conducted using the AstraZeneca PheWAS Portal (https://azphewas.com; last accessed on 15 July 2025) (Wang et al., Reference Wang, Dhindsa, Carss, Harper, Nag, Tachmazidou, Vitsios, Deevi, Mackay, Muthas, Hühn, Monkley, Olsson, Wasilewski, Smith, March, Platt, Haefliger and Petrovski2021). The portal aggregates exome sequencing data from approximately 450,000 UK Biobank participants (a subset) and maps variants to 15,500 binary and 1,500 continuous phenotypes; detailed information regarding the analytical pipeline is provided in the original publication. The family-wise error rate was controlled by adopting the portal’s default genomewide significance threshold of 2 × 10⁻⁹, thereby minimizing false positive findings.
Bioinformatic Analyses
Enrichment analyses. To characterize the functional landscape and biological context of putative therapeutic targets, Gene Ontology (GO) and Kyoto Encyclopedia of Genes and Genomes (KEGG) enrichment analyses were performed using the clusterProfiler and pathview R packages (R version 4.3.0). GO terms were analyzed across three domains: biological process (BP), molecular function (MF), and cellular component (CC). KEGG pathways were mapped to identify dysregulated metabolic and signaling pathways. Statistical significance was set at FDR < 0.05 after Benjamini-Hochberg correction.
Protein-protein interaction network. Protein–protein interaction (PPI) network analysis was performed to dissect intracellular interaction patterns among these proteins (Szklarczyk et al., Reference Szklarczyk, Kirsch, Koutrouli, Nastou, Mehryary, Hachilif, Gable, Fang, Doncheva, Pyysalo, Bork, Jensen and von Mering2023). The PPI network was constructed using STRING v11.5 with a minimum interaction confidence score of 0.4; all other parameters were set to default values (Szklarczyk et al., Reference Szklarczyk, Kirsch, Koutrouli, Nastou, Mehryary, Hachilif, Gable, Fang, Doncheva, Pyysalo, Bork, Jensen and von Mering2023). The network was visualized using Cytoscape v3.9.1 software (Otasek et al., Reference Otasek, Morris, Bouças, Pico and Demchak2019). Concurrently, PPIs were validated using GeneMANIA (https://genemania.org; v3.5.2) (Bowden et al., Reference Bowden, Davey Smith, Haycock and Burgess2016).
Candidate drug prediction. Evaluation of protein-drug interactions is critical for determining the druggability of target genes. Target genes were screened using the Drug Signatures Database (DSigDB; https://dsigdb.tanlab.org/DSigDBv1.0; last accessed on 15 March 2025) (Wang et al., Reference Wang, Sun, Liang, Ou, Liu, Ye, Wu and Liu2025). DSigDB integrates 22,527 gene sets and 17,389 unique compounds, encompassing 19,531 genes and linking drugs and other small molecules to their cognate targets. The identified target genes were uploaded to DSigDB to predict candidate compounds and evaluate the druggability of the corresponding proteins. Compensating for multiple testing using the Benjamini-Hochberg method, compounds with FDR < 0.05 were retained as significant hits. A flow chart of this study is presented in Figure 1
Statistical Analysis
For the primary MR screen, we applied a nominal IVW p < .05 threshold, combined with directional concordance across all three MR methods (IVW, weighted median, and MR-Egger) and an MR-Egger intercept test that did not indicate significant directional pleiotropy (p ≥ .05). A stricter threshold (IVW p < .01 with MR-Egger intercept p > .05) was used for prioritized analyses. This nominal primary threshold was selected to maximize sensitivity for hypothesis generation, given that all signals were subsequently subjected to multilayered downstream validation — including cross-cohort replication in the independent FinnGen cohort, Bayesian colocalization, and phenome-wide association analyses. This staged strategy serves as an empirical filter against false-positive findings at the level of the final nominated gene set.
To assess robustness, we performed leave-one-out (LOO) sensitivity analysis for all prioritized genes by iteratively removing one SNP at a time and recalculating the IVW estimate. Genes were considered robust if the effect direction and significance remained unchanged after excluding any single SNP.
For multiple testing correction, we applied Bonferroni correction to the primary screening threshold (p < .05/5,430 ≈ 9.2 × 10⁻⁶) and the Benjamini-Hochberg method (FDR < 0.05) for downstream analyses. We note that no formal Bonferroni-type correction was applied at the primary screening stage, as such stringent correction is overly conservative in this context and may eliminate true biological signals given the moderate power of the current discovery GWAS; instead, the requirement for cross-cohort replication in FinnGen serves as a robust empirical filter.
Visualization was performed using the qqman, RCircos, and TwoSampleMR R packages to generate Manhattan plots, circos plots, forest plots, and funnel plots. All filtering thresholds, their statistical rationale, and the corresponding number of genes retained at each step are summarized in Supplementary Table S1.
Results
Overview of MR Screening and Replication
Using summary statistics from the largest available ADHD GWAS meta-analysis (20,183 cases and 35,191 controls of European ancestry; 2022 multi-ancestry study with European-ancestry controls), we conducted two-sample MR analyses, including heterogeneity testing, leave-one-out sensitivity analyses, and assessments of directional pleiotropy. Scatter, forest, and funnel plots were generated to visualize the robustness of causal estimates. Of the 5430 genes with valid instrumental variables, an initial screen applying IVW p < .05 and no evidence of directional pleiotropy (pleiotropy test p > .05) identified 213 candidate SNP–exposure instruments (Table S2). After reference genome alignment and removal of 9 variants with ambiguous genomic annotation, Manhattan and circos plots were constructed for the remaining variants using MR-derived p values (Figure 2A-2B). To prioritize more specific signals, we applied a more stringent threshold (IVW p < .01 with pleiotropy p > .05), yielding 48 ADHD-associated genes, with corresponding MR effect estimates summarized in a forest plot (Figure S1).
Genomewide association signals for attention deficit/hyperactive disorder (ADHD) identified by Mendelian randomization (MR) analysis. (A) Manhattan plot showing the chromosomal distribution of single nucleotide polymorphism (SNP)–exposure instruments with MR-derived p values. The x-axis represents chromosomal position (Chr 1–22), and the y-axis shows the −log10 (p value) from MR analysis. Each point represents a genetic variant tested for causal association with ADHD. (B) Circular plot (Circos) representation of the same MR-derived association signals. The outer ring displays the 22 human autosomes (numbered 1–22). The radial axis indicates −log10 (p value) ranging from 0 (outer) to 7.0 (inner), with significance increasing toward the center.

MR-Identified ADHD-Associated Genes and Cross-Cohort Replication
Applying the same prioritization criteria in the independent FinnGen Release 10 cohort (2788 cases; 405,153 controls) identified 10 ADHD-associated genes. We then performed an intersection analysis between the discovery and replication results. Variants/genes with OR > 1 were classified as risk-increasing, whereas those with OR < 1 were classified as protective. This cross-cohort prioritization yielded four risk genes (RRAGD, DTX2, HMOX1, AGAP3) and six protective genes (NUCKS1, CPSF1, MAU2, CLDN5, CYP4F12, ATP6V1E2). Effect estimates were summarized in forest plots (Figure 3; Table S3).
Cross-cohort replication of Mendelian randomization (MR)-identified attention deficit/hyperactivity disorder (ADHD)-associated genes in the FinnGen Release 10 cohort. Forest plots showing the effect estimates for 10 genes that achieved replication significance in the independent FinnGen Release 10 cohort (2788 ADHD cases; 405,153 controls). For each gene, the plot displays the odds ratio (OR) with 95% confidence interval (CI). Genes with OR > 1 (to the right of the vertical unity line) are classified as risk‑increasing variants, while genes with OR < 1 (to the left) are classified as protective variants.

Colocalization Highlights MAU2 as a High-Confidence Target
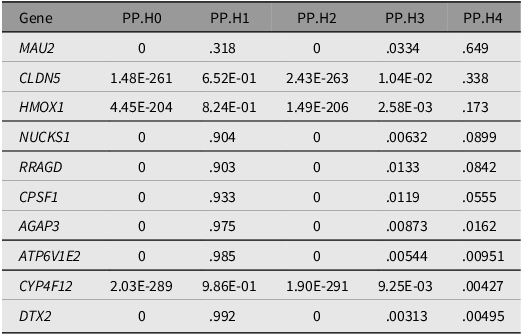
MR signals can be inflated by LD, where distinct causal variants within the same LD block independently influence gene expression and ADHD, thereby generating spurious causal estimates. To strengthen causal attribution, we performed Bayesian colocalization analysis for the 10 prioritized genes in the discovery dataset to test whether the exposure and outcome associations were driven by a shared causal variant. Among these candidates, Only MAU2 demonstrated strong colocalization evidence (PPH4 = 0.649), while the remaining nine genes showed PPH4 < 0.6, suggesting distinct causal variants for gene expression and ADHD risk (Table 1).
Colocalization results of eQTLs for 11 genes with ADHD-associated SNPs

Table 1. Long description
The table presents colocalization results of eQTLs for 11 genes with ADHD-associated SNPs. It has 11 rows and 5 columns. The columns are labeled Gene, PP.H0, PP.H1, PP.H2, PP.H3, and PP.H4. The row labels are the gene names: MAU2, CLDN5, HMOX1, NUCKS1, RRAGD, CPSF1, AGAP3, ATP6V1E2, CYP4F12, and DTX2. Each row lists the corresponding values for PP.H0, PP.H1, PP.H2, PP.H3, and PP.H4. Notable values include MAU2 with PP.H4 of 0.649 and other genes with PP.H4 values ranging from 0.00495 to 0.338.
Note: PP.H0–PP.H4 represent the posterior probabilities of different hypotheses. PP.H4 > .6 represents a relatively high probability of colocalization between gene expression and ADHD risk.
Protein–Protein Interaction Network Reveals Convergent Neurodevelopmental and Synaptic Modules
To investigate potential functional connectivity among prioritized genes, we constructed a PPI network using STRING and visualized it in Cytoscape. After removing four isolated nodes (Figure 4A), the remaining network contained six seed proteins connected to 20 additional interactors. GeneMANIA further expanded the network by 25 candidates, yielding 520 edges composed of co-expression (46.5%), physical interaction (23.1%), genetic interaction (18.3%), shared pathway (8.2%), and co-localization (3.9%) (Figure 4B). Functional characterization of the network recapitulated enrichment results, indicating convergence on neuronal development, synaptic plasticity, and neurotransmission-related programs.
Protein-protein interaction networks of prioritized attention deficit/hyperactivity disorder (ADHD)-associated genes. (A) STRING-derived PPI network visualizing functional interactions among prioritized seed genes. After removing three isolated nodes, the network contains seven seed proteins (indicated by larger nodes) connected to 20 additional interactors. Edge thickness represents the confidence of functional relationships. (B) GeneMANIA-expanded PPI network demonstrating expanded connectivity. The network was expanded by 25 additional candidates, yielding 520 edges composed of co-expression (46.5%, purple), physical interaction (23.1%, blue), genetic interaction (18.3%, orange), shared pathway (8.2%, green), and co-localization (3.9%, pink). Node colors indicate the functional pathway in which each gene is involved.

Functional Enrichment Analysis Reveals mTOR Signaling and Autophagy-Related Processes
To characterize the biological functions of the prioritized genes, we performed GO and KEGG enrichment analyses. The GO enrichment results (Figure 5A) showed that the enriched terms across the three ontologies were mainly related to: (1) Biological process: regulation of TOR signaling, TOR signaling, and cellular response to amino acid starvation; (2) Cellular component: vacuolar membrane, lysosomal membrane, and lytic vacuole membrane; (3) Molecular function: GTPase activator activity, GTPase regulator activity, and nucleoside triphosphatase regulator activity.
GO and KEGG enrichment results for prioritized attention deficit/hyperactivity disorder (ADHD)-associated genes. (A) GO enrichment results across three ontologies. Bars are colored by ontology: orange for Biological Process (BP), green for Cellular Component (CC), and dark blue for Molecular Function (MF). The x-axis shows Enrichment Score. (B) KEGG pathway enrichment analysis. Dot position indicates Enrichment Score (-log10 (p value)), dot size represents Gene Count, and dot color indicates p-value gradient.

KEGG pathway mapping results (Figure 5B) revealed that the mTOR signaling pathway was the most significantly enriched pathway (Enrichment Score = 22.87, Gene Count = 15), followed by mRNA surveillance pathway, viral hepatitis, collecting duct acid secretion, and tight junction. Together, these results point to a coordinated dysregulation of mTOR signaling and autophagy-lysosomal pathways, which may be associated with the biological mechanisms underlying ADHD.
Drug Repurposing Screen Prioritizes Candidate Compounds Targeting MR-Implicated Genes
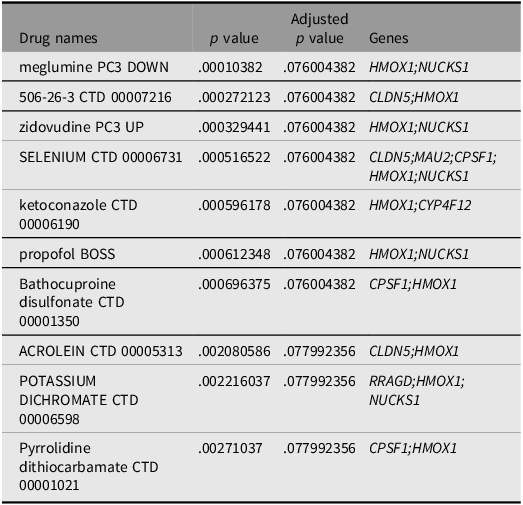
Finally, we queried DSigDB to prioritize candidate compounds predicted to modulate the prioritized targets. After multiple-testing correction, the top 10 compounds were retained (Table 2). Among them, meglumine (‘meglumine PC3 DOWN’) and compound 506-26-3 (‘506-26-3 CTD 00007216’) showed the most significant adjusted p values, targeting HMOX1/NUCKS1 and CLDN5/HMOX1 respectively. Selenium (‘selenium PC3 UP’) exhibited the broadest target coverage (CLDN5, MAU2, CPSF1, HMOX1, NUCKS1), while ketoconazole (‘ketoconazole CTD 00006190’) was also predicted to interact with HMOX1 and CYP4F12. Importantly, these compound–target interactions are computational predictions derived from in vitro chemical–genetic signatures and require confirmation in CNS-relevant experimental models before any therapeutic relevance can be inferred.
Candidate drug predicted using DSigDB

Table 2. Long description
A table with four columns and ten rows. The columns are labeled Drug names, p value, Adjusted p value, and Genes. The table lists various drug names along with their corresponding p values, adjusted p values, and associated genes. Row 1: Drug names, meglumine PC3 DOWN; p value, .00010382; Adjusted p value, .076004382; Genes, HMOX1; NUCKS1. Row 2: Drug names, 506-26-3 CTD 00007216; p value, .000272123; Adjusted p value, .076004382; Genes, CLDN5; HMOX1. Row 3: Drug names, zidovudine PC3 UP; p value, .000329441; Adjusted p value, .076004382; Genes, HMOX1; NUCKS1. Row 4: Drug names, SELENIUM CTD 00006731; p value, .000516522; Adjusted p value, .076004382; Genes, CLDN5; MAU2; CPSF1; HMOX1; NUCKS1. Row 5: Drug names, ketoconazole CTD 00006190; p value, .000596178; Adjusted p value, .076004382; Genes, HMOX1; CYP4F12. Row 6: Drug names, propofol BOSS; p value, .000612348; Adjusted p value, .076004382; Genes, HMOX1; NUCKS1. Row 7: Drug names, Bathocuproine disulfonate CTD 00001350; p value, .000696375; Adjusted p value, .076004382; Genes, CPSF1; HMOX1. Row 8: Drug names, ACROLEIN CTD 00005313; p value, .002080586; Adjusted p value, .077992356; Genes, CLDN5; HMOX1. Row 9: Drug names, POTASSIUM DICHROMATE CTD 00006598; p value, .002216037; Adjusted p value, .077992356; Genes, RRAGD; HMOX1; NUCKS1. Row 10: Drug names, Pyrrolidine dithiocarbamate CTD 00001021; p value, .00271037; Adjusted p value, .077992356; Genes, CPSF1; HMOX1.
Discussion
Our integrative drug-target discovery framework combined two-sample MR, colocalization, phenomewide association screening, functional annotation, and in silico compound prioritization to nominate genetically supported therapeutic targets for ADHD. Using complementary MR estimators (Wald ratio, IVW, weighted median, and MR-Egger) alongside heterogeneity (Cochran’s Q) and pleiotropy diagnostics (MR-Egger intercept), we identified ten putative target genes — including four risk-increasing genes (RRAGD, DTX2, HMOX1, AGAP3) and six protective genes (NUCKS1, CPSF1, MAU2, CLDN5, CYP4F12, ATP6V1E2) — with consistent evidence across discovery and replication datasets. From an initial pool of 5430 genes with valid instrumental variables, our stringent multi-step filtering (IVW p < .05 → IVW p < .01 → cross-cohort replication) yielded a final set of 10 genes, representing a ∼0.2% nomination rate, which aligns with observations that only a small fraction of genes are likely to be functionally relevant for a given complex trait, consistent with the expected proportion of functionally relevant genes in complex traits (Halldorsson et al., Reference Halldorsson, Eggertsson, Moore, Hauswedell, Eiriksson, Ulfarsson, Palsson, Hardarson, Oddsson, Jensson, Kristmundsdottir, Sigurpalssdottir, Stefansson, Beyter, Holley, Tragante, Gylfason, Olason, Zink, Asgeirsdottir, Sverrisson, Sigurdsson, Gudjonsson and Stefansson2022).
From a therapeutic perspective, this directional dichotomy carries important implications. The identification of four risk-increasing genes suggests that pharmacological inhibition of these targets may reduce ADHD susceptibility, whereas the six protective genes imply that activation or maintenance of normal expression levels may be beneficial. Notably, MAU2 emerged as the only gene with strong colocalization evidence (PPH4 > .6), supporting a shared causal variant underlying both MAU2 expression and ADHD risk. Given MAU2’s protective effect, therapeutic strategies targeting this gene would require particular caution: indiscriminate inhibition could increase ADHD risk, necessitating directionality-aware modulation rather than conventional loss-of-function approaches (Chen et al., Reference Chen, Duffy, Park, Stein, Schlessinger, Itan, Glicksberg, Tinker, Jordan, Rocheleau and Do2025; Parenti et al., Reference Parenti, Diab, Gil, Mulugeta, Casa, Berutti, Brouwer, Dupé, Eckhold, Graf, Puisac, Ramos, Schwarzmayr, Gines, van Staveren, van IJcken, Strom, Pié, Watrin, Kaiser and Wendt2020).
Functional annotation converged on pathways with plausible relevance to neurodevelopment and neurotransmission. mTOR dysregulation has been implicated in neurodevelopmental and cognitive phenotypes relevant to ADHD (Boff et al., Reference Boff, Xavier, Diz, Gonçalves, Ferreira, Zambeli, Pazzin, Previato, Erwig, Gonçalves, Bruzzo, Marinowic, da Costa and Zanirati2025; Grünblatt et al., Reference Grünblatt, Homolak, Perhoc, Davor, Knezovic, Osmanovic Barilar, Riederer, Walitza, Tackenberg and Salkovic-Petrisic2023), while the mRNA surveillance pathway (nonsense-mediated mRNA decay, NMD) is increasingly recognized as a critical regulator of neural development and synaptic plasticity (Lee et al., Reference Lee, Yang, Sun and Guo2021). Together, these pathways may represent high-priority nodes for therapeutic modulation. The enrichment of collecting duct acid secretion genes, while unexpected, is consistent with emerging evidence of subtle renal and metabolic alterations in ADHD (Salmerón et al., Reference Salmerón, Fernández-Martín, Rodríguez-Herrera, Arrabal-Campos, Abreu, Fernández and Flores2025), though the underlying mechanism linking acid-base regulation to ADHD remains unclear and warrants further investigation.
From a target-biology perspective, several nominated genes map to processes with clear mechanistic links to ADHD-relevant circuitry. RRAGD regulates mTOR signaling and thereby influences cellular growth, autophagy, and metabolism (Lipton & Sahin, Reference Lipton and Sahin2014; Kim et al., Reference Kim, Goraksha-Hicks, Li, Neufeld and Guan2008; Sancak et al., Reference Sancak, Peterson, Shaul, Lindquist, Thoreen, Bar-Peled and Sabatini2008); aberrant mTOR activity could plausibly disrupt neurodevelopment and synaptic plasticity underlying executive dysfunction in ADHD (Boff et al., Reference Boff, Xavier, Diz, Gonçalves, Ferreira, Zambeli, Pazzin, Previato, Erwig, Gonçalves, Bruzzo, Marinowic, da Costa and Zanirati2025; Gonzalez & Reinberg, Reference Gonzalez and Reinberg2025). DTX2, an E3 ubiquitin ligase involved in Notch signaling, may affect neuronal differentiation, migration, and synaptogenesis (Scalia et al., Reference Scalia, Williams, Suma and Carnevale2023). HMOX1 encodes heme oxygenase-1 (HO-1), a key oxidative-stress response mediator, aligning with evidence implicating redox imbalance and neuroinflammatory mechanisms in ADHD (Ding et al., Reference Ding, Ma, Zhou, Zhang, Zhang, Xie, Wang, Wu and Jia2025). AGAP3, an ArfGAP protein involved in vesicular trafficking and synaptic transmission, may influence dopaminergic neurotransmission (Oku & Huganir, Reference Oku and Huganir2013), consistent with the established role of synaptic genes in ADHD susceptibility.
Other targets point to regulatory layers that may shape neurodevelopmental trajectories. NUCKS1 participates in DNA damage responses and cell-cycle control, suggesting a potential link between genomic stability during development and later cognitive outcomes (Parplys et al., Reference Parplys, Zhao, Sharma, Groesser, Liang, Maranon, Leung, Grundt, Dray, Idate, Østvold, Schild, Sung and Wiese2015). CPSF1, a core factor in mRNA 3′-end processing and polyadenylation, highlights RNA-processing mechanisms that could indirectly affect neurotransmitter-related gene networks (Kilicarslan et al., Reference Kilicarslan, Gangfuß, Hentschel, Kölbel, Muhmann, Töpfl, Stöhr, Chen, Horvath, Thompson, Schara-Schmidt, Kurth, Lochmüller, Kraft, Polavarapu and Roos2026). CLDN5, a tight-junction component of the blood–brain barrier (BBB), links BBB integrity to neuroinflammation and neurotransmitter homeostasis (Deshwar et al., Reference Deshwar, Cytrynbaum, Murthy, Zon, Chitayat, Volpatti, Newbury-Ecob, Ellard, Lango Allen, Yu, Noche, Walker, Scherer, Mahida, Elitt, Nicolas, Goldenberg, Saugier-Veber, Lecoquierre and Weksberg2023); BBB perturbation could plausibly contribute to the behavioral and cognitive phenotype of ADHD (Sayed et al., Reference Sayed, Hassan, Abdelraheem, Refaat and Abuelela2024). CYP4F12, a cytochrome P450 enzyme involved in lipid metabolism, may exert protective effects through regulation of bioactive lipid mediators, consistent with reports of altered fatty-acid profiles (e.g., reduced docosahexaenoic acid) in ADHD (Choquet et al., Reference Choquet, Trapani, Goitre, Trabalzini, Akers, Fontanella, Hart, Morrison, Pawlikowska, Kim and Retta2016). ATP6V1E2, a vacuolar ATPase subunit controlling lysosomal acidification and protein turnover (Mahedy et al., Reference Mahedy, Anderson, Tilling, Thornton, Elmore, Szalma, Simen, Culp, Zicha, Harel, Davey Smith, Smith and Paternoster2024), may connect lysosomal function to neurodevelopmental vulnerability (Accogli et al., Reference Accogli, Park, Lenk, Severino, Scala, Denecke, Hempel, Lessel, Kortüm, Salpietro, de Marco, Guerrisi, Torella, Nigro, Srour, Turro, Labarque, Freson, Piatelli and Meisler2024). Collectively, these targets suggest that ADHD risk may be shaped by convergent perturbations in synaptic signaling, neurodevelopmental programs, oxidative stress responses, barrier integrity, and systemic metabolic regulation. While these findings provide a genetically anchored framework for prioritizing candidate targets, several methodological and translational considerations warrant acknowledgment before interpreting these results for therapeutic development.
The DSigDB-based drug prioritization identified 10 candidate compounds predicted to modulate the prioritized ADHD targets. However, these associations reflect computational predictions derived from in vitro chemical–genetic interaction profiles, and do not constitute direct evidence of therapeutic efficacy. Several critical pharmacokinetic and pharmacodynamic considerations were not addressed in our analysis, including blood–brain barrier permeability, target engagement in CNS tissue, and the developmental timing of intervention. Furthermore, several top-ranked compounds (e.g., ketoconazole, acrolein) carry known systemic toxicity profiles. We therefore emphasize that the drug prioritization findings are hypothesis-generating rather than practice-changing, and require experimental confirmation in CNS-relevant models and ultimately randomized clinical trials before any therapeutic application can be considered.
This study has several limitations. First, although MR strengthens causal inference, it reflects lifelong, genetically proxied differences in gene expression and typically assumes approximately linear effects; thus, MR estimates may not directly translate to short-term, high-dose pharmacological interventions evaluated in clinical trials. Second, our analyses were largely restricted to European-ancestry ADHD GWAS data, limiting generalizability; differences in allele frequencies and linkage disequilibrium across populations may also bias effect estimates when exposure and outcome datasets are ancestrally mismatched. Third, reliance on blood-derived cis-eQTL instruments may miss central nervous system–specific regulatory mechanisms that are more directly relevant to ADHD, and the focus on cis-eQTLs excludes potential contributions from trans-eQTLs and environmental modifiers (e.g., early developmental exposures). Fourth, despite sensitivity analyses, residual horizontal pleiotropy and other unmeasured biases cannot be fully excluded. Fifth, functional enrichment results depend on predefined gene sets and may not capture the full complexity of ADHD biology or gene–environment interplay, so null enrichment should not be interpreted as biological irrelevance. Finally, our in silico drug-target validation pipeline has several limitations: (a) As noted above, the compound–target associations are computational predictions derived primarily from in vitro cell-line experiments, not direct evidence of therapeutic efficacy; (b) Beyond the pharmacokinetic considerations already mentioned, molecular docking is further constrained by the accuracy of available protein structures and the ligand models used; (c) Our analysis did not systematically assess blood–brain barrier penetration or the developmental timing of intervention, both of which are critical for CNS drug development. Given the polygenic nature of ADHD, prioritized targets and compounds therefore require validation in CNS-relevant cellular and animal models and ultimately in well-powered randomized clinical trials before any therapeutic applicability can be established. Future work should integrate multi-ancestry ADHD datasets and multi-tissue omics profiles — particularly from relevant brain regions — and apply analytical frameworks that better capture tissue specificity, pleiotropy, and gene–environment contributions to accelerate translation.
Conclusion
In summary, we utilized two-sample MR with cross-cohort validation, identifying 10 genetically supported therapeutic targets for ADHD, including four risk-increasing genes and six protective genes. MAU2 demonstrated strong colocalization evidence (PPH4 > .6), supporting it as a high-confidence causal locus for ADHD. Functional analyses implicated dysregulated mTOR signaling and ferroptosis as priority pathways, alongside oxidative stress responses and blood-brain barrier integrity. In silico drug prioritization identified candidate compounds modulating these targets. These findings provide a prioritized set of candidate targets for future therapeutic development in ADHD. However, translational value requires validation through functional assays, target engagement studies, and prospective clinical trials, particularly given ADHD’s clinical heterogeneity and interindividual variability in drug responsiveness.
Supplementary material
To view supplementary material for this article, please visit https://doi.org/10.1017/thg.2026.10106.
Data availability
The datasets analyzed during the current study are available in the in the following repositories: eQTLs data were obtained from eQTLGen Consortium (https://eqtlgen.org); ADHD discovery data was from a previous study and downloaded on GWAS Catalog (OpenGWAS ID: ieu-a-1183; https://gwas.mrcieu.ac.uk/); ADHD replication data was from FinnGen Release 10 (https://www.finngen.fi/en). Data availability: All data generated or analyzed during this study are included in this article and its supplementary information files (Supplementary Tables).
Acknowledgments
We thank the eQTLGen consortium, the FinnGen team and other researchers and participants for providing publicly available data for this analysis.
Contribution statement
LSW, PP, YWJ, ZXY, and LJN were responsible for study conception and design. LSW mainly performed the data analysis and software, and wrote the original draft. YWJ and ZXY performed data curation and validation. LJN contributed to software and formal analysis. LSW prepared the visualization. PP supervised the project, administered funding, and reviewed the manuscript. All authors critically reviewed and approved the final version of this manuscript to be published. PP is the guarantor of this work.
Funding
Not applicable.
Competing interests
There are no potential conflicts of interest among all authors.