Introduction
Organic production acreage has increased in the past two decades, but meta-analyses have demonstrated lower crop yields in organic than conventional production across a broad range of crops and geographic locations (Ponisio et al. Reference Ponisio, M’Gonigle, Mace, Palomino, de Valpine and Kremen2015; Seufert et al. Reference Seufert, Ramankutty and Foley2012). Multiple factors have been identified in these analyses that account for lower yields in organic compared with conventional production, including failure to control weeds. The weed seedbank in soil of organic fields is often more abundant and more diverse than that in conventional fields (Rotchés-Ribalta Reference Rotchés-Ribalta, Armengot, Mäder, Mayer and Sans2017; Ryan et al. Reference Ryan, Smith, Mirsky, Mortensen and Seidel2010b; Wortman et al. Reference Wortman, Lindquist, Haar and Francis2010). The expression of this seedbank can be highly variable and depends on annual variations in meteorological conditions and implementation of management practices (Légère et al. 2011; Smith and Gross Reference Smith and Gross2006; Sosnoskie et al. Reference Sosnoskie, Herms, Cardina and Webster2009), but often results in high aboveground weed biomass that significantly reduces crop yield (Ryan et al. Reference Ryan, Mortensen, Bastiaans, Teasdale, Mirsky, Curran, Seidel, Wilson and Hepperly2010a; Teasdale and Cavigelli Reference Teasdale and Cavigelli2010). Meteorological and management factors can interact to influence weed species diversity, the competitive potential of the weed community, and the ultimate effect of both on crop yield (Ferrero et al. Reference Ferrero, Lima, Davis and Gonzalez-Andujar2017). Due to the potentially complex interactions between meteorological fluctuations and management, organic growers have adopted multiple strategies for reducing weed competition, including practices such as crop rotation, delayed planting, increased plant density, and postplanting mechanical cultivation (Baker and Mohler Reference Baker and Mohler2015; DeDecker et al. Reference DeDecker, Masiunas, Davis and Flint2014).
A diversified crop rotation is a well-recognized practice for enhancing organic crop production and is particularly important for managing weed populations because of the inability to use herbicides. At the long-term Farming Systems Project (FSP) in Maryland, diversifying an organic row-crop corn (Zea mays L.) and soybean [Glycine max (L.) Merr.] rotation with winter annual wheat (Triticum aestivum L.) and perennial hay crops has reduced the seedbank of important summer annual weeds, reduced aboveground weed abundance, and increased crop yield and profitability in selected years (Cavigelli et al. Reference Cavigelli, Teasdale and Conklin2008, Reference Cavigelli, Hima, Hanson, Teasdale, Conklin and Lu2009; Teasdale et al. Reference Teasdale, Mangum, Radhakrishnan and Cavigelli2004). However, a recent assessment of crop yield variability during 18 yr at FSP has shown that meteorological variables, and particularly precipitation during late vegetative and early reproductive crop growth, were the primary influences on yield fluctuations, while rotational system had a relatively minimal overall influence (Teasdale and Cavigelli Reference Teasdale and Cavigelli2017). Based on this analysis, weed abundance made a significant contribution to reducing yield in organic systems and played a key role in reducing the efficiency of precipitation use in organic compared with conventional crops. A comparable long-term analysis was needed to define the relative importance of management and meteorological variables on weed abundance during this 18-yr period at FSP. Because the crop was expected to have a profound competitive impact on weed abundance (Maxwell and O’Donovan Reference Maxwell and O’Donovan2007; Mohler Reference Mohler2001), and because meteorological and management factors were expected to impact both crops and weeds, we chose to conduct a multivariate path analysis to identify the direct and indirect effects of these variables on crop competitiveness and weed abundance.
Therefore, the objectives of this analysis were to (1) determine the relative effect of management versus meteorological variables on weed abundance and (2) distinguish between the direct effect of these variables on weed abundance compared with the indirect effect on weed abundance by way of effects on crop performance. A path analysis using structural equation modeling was employed to determine these relationships among variables. Structural equation modeling offers a powerful approach to testing hypotheses about causal relationships among multiple, correlated variables in complex systems (Grace Reference Grace2006; Smith et al. Reference Smith, Davis, Jordan, Atwood, Daly, Grandy, Hunter, Koide, Mortensen, Ewing, Kane, Li, Lou, Snapp, Spokas and Yannarell2014). It is often used to determine relationships involving both measurable manifest variables and unmeasurable latent variables and can be particularly valuable in agricultural research for developing complex hypotheses in multidisciplinary research (Smith et al. Reference Smith, Davis, Jordan, Atwood, Daly, Grandy, Hunter, Koide, Mortensen, Ewing, Kane, Li, Lou, Snapp, Spokas and Yannarell2014). It also can be used to compute path analyses among data sets composed of only manifest variables (SAS Institute 2011), and this approach is well-suited to distinguishing direct from indirect relationships (Mitchell Reference Mitchell2001), as we present in this paper.
Materials and Methods
The Farming Systems Project (FSP) is conducted at the USDA-ARS Beltsville Agricultural Research Center in Beltsville, MD (39.03472222, -76.90777778). Soil types are Christiana (fine, kaolinitic, mesic Aquic Hapludults), Matapeake (fine-silty, mixed, semiactive, mesic Aquic Hapludults), Keyport (fine, mixed, semiactive, mesic Aquic Hapludults), and Mattapex (fine-silty, mixed, active, mesic Aquic Hapludults) silt loams. This experiment includes five cropping systems, two conventional systems differing in tillage intensity, and three organic systems differing in rotational diversity. This paper focuses on the three organic systems: (1) a 2-yr corn–soybean rotation, (2) a 3-yr corn–soybean–wheat (Triticum aestivum L.) rotation, and (3) a 6-yr corn–soybean–wheat–hay rotation. A rye (Secale cereal L.) cover crop was planted following corn in all rotations, and a winter annual legume cover crop was planted the fall before corn planting in the two shorter rotations. The longest rotation was a 4-yr rotation during the first 4 yr of the experiment with orchardgrass (Dactylis glomerata L.) and red clover (Trifolium pratense L.) as the hay crop, but was expanded to 6 yr thereafter with alfalfa (Medicago sativa L.) as the hay crop. Thus, the number of years without a spring-planted row crop in the three rotations ranged from 0 to 4; this variable was used for subsequent analyses as described later.
The FSP was initiated in 1996, and the first full year of organic management was initiated in 1997. This analysis will use a data set from the first 18 yr of organic management, 1997 to 2014, which includes nine cycles of the 2-yr rotation, six cycles of the 3-yr rotation, and three cycles of the 6-yr rotation. The experiment is arranged in a split-plot design, with crop rotation as the main plot and crop as the subplot. All rotational crop phases are present in each year of the experiment. Corn and soybean are the only crops present in all rotational systems in every year, so this paper focuses on weed abundance in these row crops. Organic rotations were managed according to USDA National Organic Program standards and recommendations by local organic farmers. Generally, seedbeds were prepared by moldboard plowing before corn and chisel plowing before soybean (with the exception of a reduced-tillage approach used during the first 6-yr rotational cycle of the experiment). Fertility was provided by legumes (cover crops or hay), poultry litter (with rates adjusted to provide appropriate amounts of available nitrogen and phosphorus), and potassium sulfate. Conventional cultivars were planted through 2004 and organic cultivars were used thereafter. Organic corn and soybeans were planted in 76-cm rows, and the date of planting varied considerably from May 4 to June 30 as weather and operational constraints permitted. Weeds were controlled postplanting by rotary hoeing (number of operations ranged from none to three each year) and by interrow cultivation with either a single wide sweep or Danish S-tined cultivator (one to five each year). Corn and soybean grain was harvested from the middle two to four rows of the entire plot length with a combine and either weighed with an internal scale or downloaded to a weigh wagon. Corn and soybean yields were adjusted to 15.5% and 13.5% moisture content, respectively.
The rotational systems were arranged in a randomized complete block design with four replications. Each crop was planted into a plot that was 12 corn or soybean rows wide (9.1 m) and 111-m long. The percentage of soil area covered by weeds (weed cover) was estimated visually by the same rater in all years at crop maturity within the middle six rows of four 28-m-long quadrants of each plot. Thus, a 4.6 by 28 m quadrant was the experimental unit for the weed cover data set. Weed cover is highly correlated to weed biomass and provides a more comprehensive assessment of weed abundance over a large plot area than does weed biomass, which is typically sampled at a considerably smaller scale (Teasdale and Cavigelli Reference Teasdale and Cavigelli2010). Estimates included total weed cover and the percent contribution of major species in each quadrant. Total weed cover is the focus of analyses reported in this paper. For background information, prominent species in all years were smooth pigweed (Amaranthus hybridus L.), common lambsquarters (Chenopodium album L.), and annual grasses, primarily giant foxtail (Setaria faberi Herrm.), fall panicum (Panicum dichotomiflorum Michx.), large crabgrass [Digitaria sanguinalis (L.) Scop.], and yellow foxtail [Setaria pumila (Poir.) Roem. & Schult.]. In addition, horseweed (Erigeron canadensis L.), jimsonweed (Datura stramonium L.), and velvetleaf (Abutilon theophrasti Medik.) were prominent species in some years.
Weed cover data were transformed to a logit scale, a transformation considered appropriate for proportional data (Warton and Hui Reference Warton and Hui2011). After transformation, rotation system and crop treatment variances were homogenous, and skewness and kurtosis were minimized to 0.05 and 0.01, respectively. A mixed-model ANOVA was conducted on the logit of weed cover, with rotation and crop as fixed effects and year and block as random effects (PROC MIXED, SAS v. 9.3, SAS Institute, Cary, NC). In addition, variance components were decomposed to determine the relative contribution of each effect to the overall variance of the data (PROC VARCOMP, SAS v. 9.3).
Variables that potentially influenced weed abundance during the experimental period were identified by preliminary correlation analyses. Management variables chosen for subsequent analyses included the number of years in the rotation without a row crop, the number of rotary hoe operations in a season, the number of sweep cultivations, and the crop planting date (computed as the number of days after April 30). Meteorological variables included the weekly precipitation and average temperature for a critical period early and late in the cropping season. The early- and late-season critical periods were determined for the range of weeks for which the correlation between the meteorological variable and weed cover was highest (a detailed description of this approach is described in supplementary material to Teasdale and Cavigelli [Reference Teasdale and Cavigelli2017]). The magnitude of crop competition effects on weed cover was estimated by crop yield, which was considered an integrated measure of crop density and biomass. Crop yield also was considered an appropriate metric for this analysis, because it was determined across the same central area of each plot, as was the weed cover metric. Corn and soybean yields were standardized to mean=0 and SD=1 before analyses. The logit of weed cover was used as the measure of weed abundance in all analyses.
Path models were constructed for direct effects of management and meteorological variables on crop yield and on weed cover and for the direct effect of crop yield on weed cover. Thus, management and meteorological variables were exogenous variables, and crop yield and weed cover were endogenous variables. Path models were recursive (one directional only, flowing from crop to weed) to facilitate interpretation. Recognizing that crops and weeds reciprocally impact each other, the effects of weeds on crop performance have already been reported in Teasdale and Cavigelli (Reference Teasdale and Cavigelli2017); in this paper, we have focused on the influence of crops on weed abundance. Structural equation modeling for conducting the path analysis was performed with PROC CALIS (SAS v. 9.3) using the PATH language to analyze the covariance structure of identified parameters (SAS Institute 2011). The weighted least-squares estimation method was employed, because data lacked a multivariate normal distribution and were subject to multivariate kurtosis. Models were reduced when path or covariance coefficients were not significant, and their corresponding paths were set to zero. Overall goodness of fit between the covariance structure of the reduced model and that of the unconstrained model was determined by the chi-square test and root mean-square error of approximation (RMSEA). Models that were determined to fit the unconstrained covariance structure were compared using the Schwarz Bayesian criterion (SBC), and the model with the lowest SBC value was considered the best model. Standardized coefficients were decomposed into direct, indirect, and total effects (Mitchell Reference Mitchell2001). The standardized error variance of each endogenous variable subtracted from one (R2) provided an estimate of the proportion of variance accounted for by predictor variables.
Results and Discussion
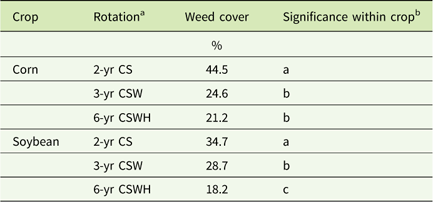
ANOVA showed a significant rotation by crop interaction effect on weed cover (P=0.0012), although the pattern of rotation effects was similar in both corn and soybean. Weed cover was highest in the 2-year corn–soybean rotation and lowest in the 6-year corn–soybean–wheat–hay rotation in both corn and soybean across 18 yr of organic systems at FSP (Table 1). Weed cover exhibited a wider range of yearly fluctuations than rotational fluctuations, ranging from an annual mean of 10.6% to 61.4%. Examination of variance components showed that year contributed 28.9%, rotational system contributed 7.8%, crop (corn or soybean) contributed 0.3%, and block contributed 2.5% of the total variation in weed cover. Therefore, yearly fluctuations led to almost four times as much variability in weed cover as that resulting from the rotation treatment. Consequently, a more comprehensive analysis of weed response to seasonally fluctuating factors was required to understand the dynamics of weed cover in this experiment.
Least-squares mean of weed cover (back-transformed from logit scale) in organic rotations across 18 yr at the Beltsville Farming Systems Project.

a C, corn; H, hay; S, soybean; W, wheat.
b Weed cover values of rotations followed by different letters within crops are significantly different (P<0.05).
Path models for both corn and soybean fit the data covariance structure well. The probabilities of greater chi-squared values were greater than 0.05, and the RMSEA values were less than 0.05, indicating an acceptable goodness of fit between the model and the observed covariance matrix (SAS Institute 2011). In addition, the goodness of prediction, as determined by R2 values, was acceptable. R2 values for predicting corn and soybean yield were 0.59 and 0.63, respectively, and values for predicting weed cover were 0.50 and 0.49 in corn and soybean, respectively.
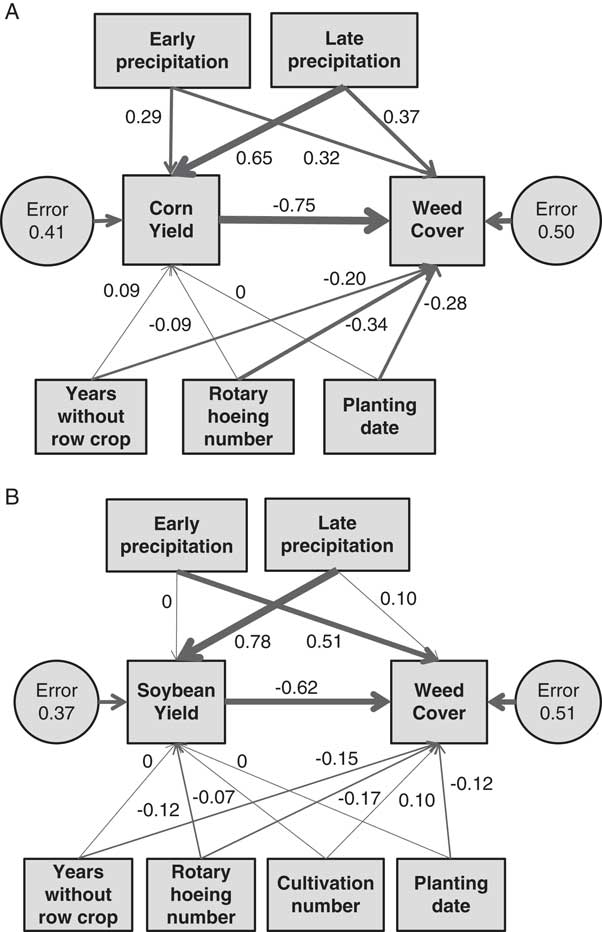
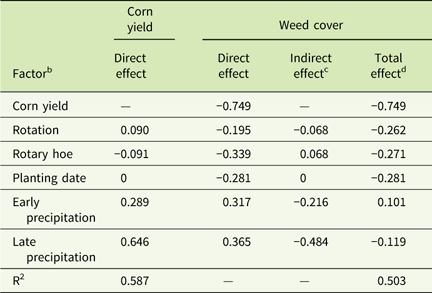
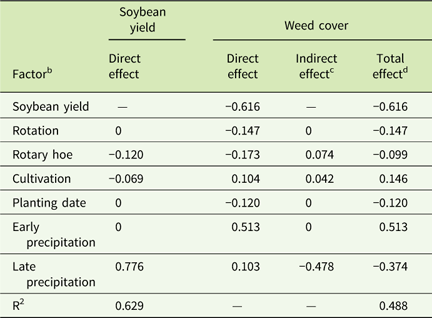
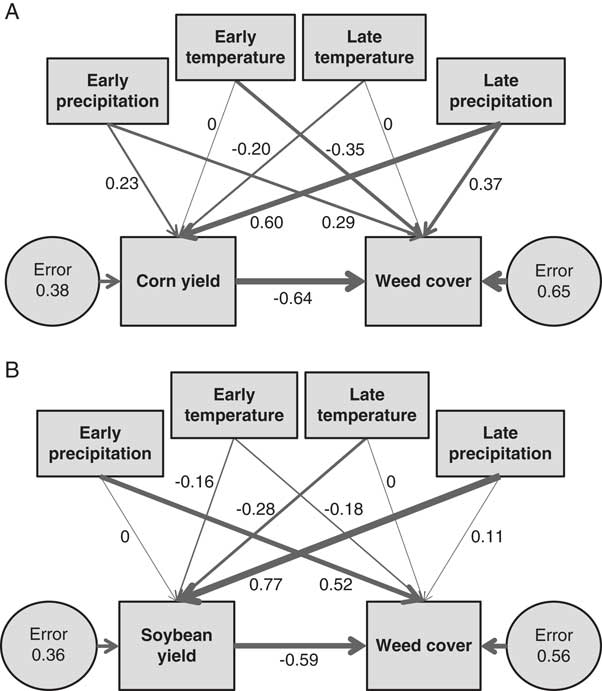
Figure 1 provides a visual representation of paths between exogenous precipitation and management factors and the endogenous factors. Paths show the direct effects flowing from exogenous factors to crop yield and weed cover, and the direct effect of crop yield on weed cover. The indirect effect of a factor on weed cover was determined by the product of the direct effect of the factor on crop yield times the direct effect of crop yield on weed cover (Tables 2 and 3). Thus, it represents the impact of the factor on weed cover through its indirect effect on crop performance and the subsequent crop competitive impact on weeds. The total effect of a factor on weed cover was then determined as the sum of the direct and indirect effect of the factor on weed cover. Indirect effects can be either positive or negative and can augment the direct effect if they are the same sign or reduce the direct effect if they are the opposite sign (Mitchell Reference Mitchell2001).
Path model for direct effects of precipitation and management factors on crop yield (as a surrogate for crop competitiveness) and weed cover variables. Standardized path coefficients and error leading to each endogenous variable were significant (P<0.05), except where equal to zero. Thickness of path lines is proportional to coefficients. Variances and covariances of exogenous variables are not shown. (A) Corn model (covariance structure analysis: n=771, model parameters=23, probability>χ2 p value=0.541, RMSEA=0.000). (B) Soybean model (covariance structure analysis: n=752, model parameters=29, probability>χ2p value=0.256, RMSEA=0.019).

Path model standardized coefficients for direct, indirect, and total effects of management and precipitation factors on corn yield and weed cover in corn.Footnote a

a All effects were significant (P<0.05), except for values equal to zero.
b Management factors were the number of rotation years without a row crop preceding corn, rotary hoeing number, and the day that corn was planted. Precipitation factors were the average weekly precipitation during the periods from 1 wk before to 4 wk after planting (early) and from 7 to 11 wk after planting (late).
c Indirect effect of a factor on weed cover is the product of the direct effect of the factor on corn yield times the direct effect of corn yield on weed cover.
d Total effect of a factor on weed cover is the sum of the direct and indirect effects of the factor on weed cover.
Path model standardized coefficients for direct, indirect, and total effects of management and precipitation factors on soybean yield and weed cover in soybean.Footnote a

a All effects were significant (P<0.05), except for values equal to zero.
b Management factors were the number of rotation years without a row crop preceding corn, rotary hoeing number, cultivation number, and the day that soybean was planted. Precipitation factors were the average weekly precipitation during the periods from 2 wk before to 3 wk after planting (early) and from 6 to 12 wk after planting (late).
c Indirect effect of a factor on weed cover is the product of the direct effect of the factor on soybean yield times the direct effect of soybean yield on weed cover.
d Total effect of a factor on weed cover is the sum of the direct and indirect effects of the factor on weed cover.
Precipitation Factors
Precipitation during both early and late season had a positive influence on both crop yield and weed cover (Figure 1). Late-season precipitation was the most important predictor of corn and soybean yield as determined by having the highest standardized path coefficients to yield of all factors in these models. Late precipitation also had a positive direct influence on weed cover in corn and soybean. Because crop competition (as measured by crop yield) had a strong negative influence on weed cover, the positive effects of late precipitation on crop performance led to a negative indirect effect of precipitation on weed cover (Tables 2 and 3). Consequently, the indirect negative effects of precipitation offset the positive direct effects, so the total effect of precipitation variables on weed cover, particularly in corn, was a relatively small negative effect (Table 2). In other words, high late-season precipitation increased weed cover, but it also increased crop growth, which competitively reduced weed cover, leading to an overall negative effect on weed cover. The total effect whereby higher late-season precipitation moderately reduced weed cover is consistent with earlier research that showed increased crop competitiveness with weeds when soil moisture is adequate (Cowan et al. Reference Cowan, Weaver and Swanton1998; McDonald et al. Reference McDonald, Riha and Mohler2004; Toler et al. Reference Toler, Guice and Murdock1996), although no influence (Patterson and Highsmith Reference Patterson and Highsmith1989) or decreased crop competitiveness (Mortensen and Coble Reference Mortensen and Coble1989) have also been reported depending on the weed and crop species involved. These mixed results suggest that the effect of maintaining a high soil water content throughout the season, if irrigation is available, will usually favor the crop more than weeds, but may not always lead to enhanced crop competitiveness.
Precipitation during the early period of crop establishment favored weeds at the expense of the crop. The direct effect of early precipitation was greater than the indirect effect of this factor on weed cover, so the total effect of early precipitation on weed cover was positive, particularly in soybean (Tables 2 and 3). Precipitation during the crop establishment period probably both favored weed emergence and hampered rotary hoeing and cultivation operations (Posner et al. Reference Posner, Baldock and Hedtcke2008). Therefore, maintaining low soil moisture levels near the surface of the soil would be desirable for reducing early-season weed germination and establishment, although this may be a difficult factor to control and still maintain sufficient deep soil moisture for crop establishment, particularly in regions with relatively frequent spring precipitation.
Management Factors
Management factors had a greater impact on weed cover in corn than in soybean (Figure 1). Rotational diversification (as measured by the number of years without a row crop before corn) was inversely related to weed cover, confirming the results presented in Table 1 that the lowest weed cover was in the 6-year corn–soybean rotation with 4 yr of diversifying crops. Because rotation had little direct effect on corn and no direct effect on soybean yield, the total rotational effect was driven by direct effects on weed cover (Tables 2 and 3). Previous research at this site showed that the seedbank of dominant broadleaf weeds was reduced by seed mortality in years when competitive winter annual grain or perennial hay crops prevented seed production (Teasdale et al. Reference Teasdale, Mangum, Radhakrishnan and Cavigelli2004; Ullrich et al. Reference Ullrich, Buyer, Cavigelli, Seidel and Teasdale2011). A summary of recent rotation literature (Teasdale Reference Teasdale2018) has confirmed the principle that phenological diversity of crops and operational diversity of weed management contribute to improved weed control in a wide range of cropping systems and environments. Consequently, this analysis confirms that rotation can reliably contribute to weed control in organic systems.
Sweep cultivation was usually effective in controlling weeds between crop rows but did not control weeds within the row. The number of cultivations (from one to five) had no significant effect on weed cover in corn and was not included in that model, but cultivation did have a small effect in soybean (Figure 1). The rotary hoe controls weeds within a row by dislodging emerging weed seedling roots from surface soil while, in theory, minimizing damage to the more deeply rooted crop seedlings (Place et al. Reference Place, Reberg-Horton and Burton2009). Increasing the rotary hoeing frequency reduced weed cover in both crops (Figure 1). However, rotary hoeing frequency also had a small negative impact on crop yield, which decreased the competitive effect of the crop on weeds, and thus indirectly offset a portion of the direct negative effect of rotary hoeing on weed cover (Tables 2 and 3). Previous research has shown improved weed control from multiple rotary hoe operations (Buhler et al. Reference Buhler, Gunsolus and Ralston1992; Place et al. Reference Place, Reberg-Horton and Burton2009; Taylor et al. Reference Taylor, Renner and Sprague2012); however, the largest increase in weed control is often obtained from the first rotary hoe operation (Place et al. Reference Place, Reberg-Horton and Burton2009; Renner and Woods Reference Renner and Woods1999; Vangessel et al. Reference Vangessel, Schweizer, Lybecker and Westra1995). This mode of weed control is often not adequately selective, as multiple rotary hoe operations can also reduce crop populations and yield (Buhler et al. Reference Buhler, Gunsolus and Ralston1992; Leblanc et al. Reference Leblanc, Cloutier and Stewart2006; Place et al. Reference Place, Reberg-Horton and Burton2009; Renner and Woods Reference Renner and Woods1999). Our results are consistent with this previous research, whereby increasing the number of rotary hoe operations had a moderate effect on reducing weed cover, but increasing rotary hoe operations also had a slight negative effect on crop production, thereby indirectly offsetting some of the direct effect on weed cover. Therefore, rotary hoeing can improve weed control but is not sufficiently selective, and a portion of the advantage gained is offset by reduced crop competitiveness with weeds. These results suggest that this weed control method can contribute to weed control in organic row-crop production but should not be overly relied on.
Weed cover was inversely related to the date of planting (Figure 1), meaning that weed cover in both crops decreased as planting date was delayed. Because there were no significant effects of planting date on either corn or soybean yield, there were no indirect planting date effects on weed cover. Planting date, which ranged over a 57-d period, was highly correlated with early and late average temperature (correlation coefficients between early and late average temperature and planting date of corn were 0.79 and −0.74, respectively, and analogous values for soybean were 0.86 and −0.69, respectively). Generally, the earlier crops were planted, the lower the early temperature and the higher the late temperature. Because of this close relationship between planting date and temperature, only one of these variables was included in the path analyses presented in Figure 1. Planting date was chosen because it was a controllable management practice, and because models had a lower SBC with planting date than with either of the temperature variables. To better understand the effect of planting date, a separate path analysis was conducted with only meteorological variables, including early and late temperature and precipitation as exogenous variables and crop yield and weed cover as endogenous variables.
Temperature and Planting Date Relationships
Average temperature before planting had inverse direct effects on weed cover in corn and soybean (Figure 2). Accordingly, weed cover was higher when temperatures during the weeks before planting were lower, and weed cover was lower when temperatures were higher. Given the high correlation between planting date and early temperature variables, later planting dates presumably lowered weed cover by raising average temperatures before planting. The timing of emergence of typical annual weeds in the mid-Atlantic area is primarily determined by accumulation of thermal units (Myers et al. Reference Myers, Curran, VanGessel, Calvin, Mortensen, Majek, Karsten and Roth2004), and higher temperatures during the 4 wk before planting would be expected to increase the cumulative emergence of resident annual species. Previous research with annual weeds similar to those in our experiment has shown that destruction of weeds that emerged between early and late planting dates accounted for lower weed populations at the late planting date (Buhler and Gunsolus Reference Buhler and Gunsolus1996; Coulter et al. Reference Coulter, Sheaffer, Haar, Wyse and Orf2011). Thus, late planting probably decreased weed cover partially through destruction of weed populations that germinated before seedbed tillage operations. Williams (Reference Williams2006, Reference Williams2009) showed that late planting dates also can result in lower weed biomass and suggested that growth of weeds emerging after late plantings may be curtailed by earlier photoperiod induction of flowering. In addition, late planting dates have been shown to improve weed control by cultivation and rotary hoeing (Buhler and Gunsolus Reference Buhler and Gunsolus1996; Mulder and Doll Reference Mulder and Doll1994), so planting date could have interacted with rotary hoeing in ways that this analysis could not detect.
Path models for the direct effects of early- and late-season precipitation and average temperature on crop yield (as a surrogate for crop competitiveness) and weed cover. Standardized path coefficients and error of each endogenous variable were significant (P<0.05), except where equal to zero. Thickness of path lines is proportional to coefficients. Variances and covariances of exogenous variables are not shown. (A) Corn model (covariance structure analysis: n=771, model parameters=19, probability>χ2 p value=0.120, RMSEA=0.038). (B) Soybean model (covariance structure analysis: n=752, model parameters=19, probability>χ2 p value=0.651, RMSEA=0.000).

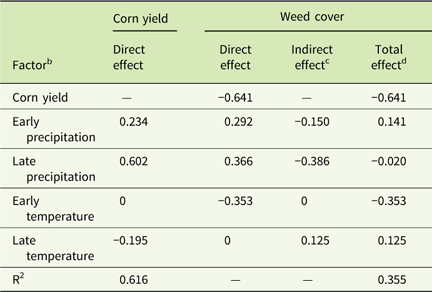
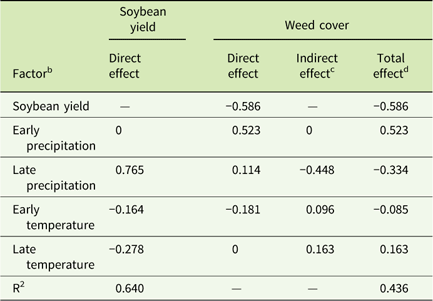
Average temperature late in the season had a moderate inverse direct effect on crop yield but no direct effect on weed cover (Figure 2). A previous analysis of crop yields at FSP (Teasdale and Cavigelli Reference Teasdale and Cavigelli2017) showed that extreme heat had a negative effect on crop yield that likely resulted from enhancement of drought effects. Any effect that lowered crop performance would reduce the competitive effect of crops on weeds and result in a positive indirect effect on weed cover. In the absence of any direct effect of this factor on weed cover, the total effect of higher late-season temperatures was to increase weed cover in both corn and soybean (Tables 4 and 5). Given the inverse relationship between late-season temperature and planting date, delayed plantings may have reduced weed cover by avoiding heat stress effects during midseason (Teasdale and Cavigelli Reference Teasdale and Cavigelli2017), thereby favoring crop over weed growth.
Path model standardized coefficients for direct, indirect, and total effects of precipitation and temperature on corn yield and weed cover in corn.Footnote a

a All effects were significant (P<0.05), except for values equal to zero.
b Precipitation factors are the average weekly precipitation during the 5-wk periods from 1 wk before to 4 wk after planting (early) and from 7 to 11 wk after planting (late). Temperature factors are the daily average temperature during the 5-wk periods from 4 wk before to 1 wk after planting (early) and from 9 to 13 wk after planting (late).
c Indirect effect of a factor on weed cover is the product of the direct effect of the factor on corn yield times the direct effect of corn yield on weed cover.
d Total effect of a factor on weed cover is the sum of the direct and indirect effects of the factor on weed cover.
Path model standardized coefficients for direct, indirect, and total effects of precipitation and temperature on soybean yield and weed cover in soybean.Footnote a

a All effects were significant (P<0.05), except for values equal to zero.
b Precipitation factors are the average weekly precipitation during the periods from 2 wk before to 3 wk after planting (early) and from 6 to 12 wk after planting (late). Temperature factors are the daily average temperature during the periods from 4 wk before to the day of planting (early) and from 6 to 14 wk after planting (late).
c Indirect effect of a factor on weed cover is the product of the direct effect of the factor on soybean yield times the direct effect of soybean yield on weed cover.
d Total effect of a factor on weed cover is the sum of the direct and indirect effects of the factor on weed cover.
Delayed planting, particularly in northern areas of the United States, can reduce crop yields by extending the effective season beyond that required for optimal crop reproductive development (Buhler and Gunsolus Reference Buhler and Gunsolus1996; Egli and Cornelius Reference Egli and Cornelius2009; Sindelar et al. Reference Sindelar, Roozeboom, Gordon and Heer2010). However, Sindelar et al. (Reference Sindelar, Roozeboom, Gordon and Heer2010) showed that under low-stress conditions in Kansas, corn planting could be delayed until early June with minimal yield reduction. Egli and Cornelius (Reference Egli and Cornelius2009) showed that soybean yields from the central Midwest to the Deep South could be maintained relatively constant with planting dates as late as early June but declined sharply thereafter. Our path analysis showed a negligible effect of planting date on organic corn or soybean yields (Figure 1). Previous research showed similar results for organic corn yields at a different site in Beltsville, MD (Teasdale et al. Reference Teasdale, Mirsky, Spargo, Cavigelli and Maul2012). In that report, the growing season was sufficiently long that even corn planted in late June received similar total radiation as earlier planted corn. It is possible that organic production reduces the yield potential of corn and soybean sufficiently that improved weed control more than compensates for the lost yield potential associated with later planting dates. Regardless, this research suggests that organic growers in the central or southern regions of the United States could obtain weed control benefits from delayed plantings with minimal yield consequences.
Importance of Direct and Indirect Crop Effects on Weed Management
Path analysis has identified several factors that may be causally related to large fluctuations in weed cover in organic rotations over the 18-yr time frame of this experiment. This analysis was not performed to test a hypothesized a priori model, but to conduct a retrospective analysis to determine the best a posteriori models to define these relationships. Mechanisms for relationships and potential interactions among factors can not be determined from this analysis. Additional research is required to verify the causality of relationships and to understand more fully the interacting direct and indirect effects identified here involving crop–weed interactions.
Corn and soybean performance, as measured by grain yield, had a stronger direct effect on weed cover than management or meteorological factors (Figure 1; Tables 2 and 3). Crop yield reduction from competition with weeds for essential resources is a fundamental principle of weed science, but this process is usually accompanied by a reciprocal competitive suppression of weeds by the crop (Maxwell and O’Donovan Reference Maxwell and O’Donovan2007). Distinguishing whether the strong negative crop–weed relationships observed in our analyses were based more on weed effects on the crop or crop effects on weeds cannot be determined with the available data. Crop and weed densities and their relative times of emergence are two critical factors in determining the outcome of competition (Maxwell and O’Donovan Reference Maxwell and O’Donovan2007), and these were likely driving factors in our experiments. After accounting for precipitation, crop yields at FSP were decreased by increasing weed cover (Teasdale and Cavigelli Reference Teasdale and Cavigelli2017), presumably mediated in part by higher weed density and/or earlier emergence where cover was higher. But crop densities also varied greatly in organic systems in this experiment and likely accounted for large differences in crop competitiveness that undoubtedly contributed to the observed inverse correlations with weed cover. Because crop density data were determined only in intermittent years and at a scale much smaller than the crop and weed variables reported here, these data were not used in these analyses. However, suboptimal corn densities of 40,000 to 60,000 plants ha−1 were recorded in several years, suggesting inadequate capacity of crops to use available light and soil resources and a concurrent increase in resource availability for weed growth (Mohler Reference Mohler2001). Generally, the strong inverse relationship between crop yield and weed cover demonstrated in our analyses reinforces the principle that any factors that maintain good crop stands and promote crop growth in organic production will contribute to enhancing current-year weed control and reducing seed production and future weed populations (Maxwell and O’Donovan Reference Maxwell and O’Donovan2007).
Three management factors (crop rotational diversification, delayed planting, and rotary hoeing) that are well known to organic growers (Baker and Mohler Reference Baker and Mohler2015; DeDecker et al. Reference DeDecker, Masiunas, Davis and Flint2014) were identified in this paper as reducing weed cover in both crops. Rotary hoeing can facilitate crop competitiveness if it reduces and delays weed emergence relative to the crop, but it must be used with care so as not to reduce crop populations and competitiveness. Delayed planting can permit destruction of early-emerging weeds and reduce emerged weed populations, thereby improving the competitive capacity of the crop relative to weeds. Diverse rotations can dampen and diversify weed populations over time as well as improve soil fertility, both leading to improved crop competitiveness. But this analysis also shows that meteorological factors, particularly precipitation, have a dominating effect on crop performance and a strong direct and indirect influence on weed cover depending on their timing early or late in the season. Thus, the crop not only had a dominating direct effect on weed cover, but also mediated indirect meteorological effects on weed cover, thereby accounting for part of the large yearly fluctuations observed in weed cover. Given these interrelationships of management and weather conditions demonstrated by this analysis and intuitively understood by observant growers, weed management in organic systems must remain flexible and adaptable to shifting conditions and weed populations.
Acknowledgments
Authors declare no conflicts of interest.