Introduction
Grain legumes are important food and forage crops globally (Graham and Vance, Reference Graham and Vance2003). Although legumes, consumed either as dried grain or fresh vegetables, are low in sulphur-containing amino acids, this is counterbalanced by the presence of many other beneficial nutritional and health factors (Champ et al., Reference Champ, Anderson and Bach-Knudsen2002). In combination with cereals, vegetables and fruits, legumes contribute towards balanced and healthy human nutrition, providing protein, carbohydrate, essential vitamins and oils, trace elements and fibre (Champ et al., Reference Champ, Anderson and Bach-Knudsen2002). Additionally, legumes are a source of high-quality animal fodder (Graham and Vance, Reference Graham and Vance2003), and interact symbiotically with rhizobia, providing nitrogenated soils.
Lablab purpureus (L.) Sweet (Dolichos lablab, hyacinth bean) is an important legume, cultivated throughout the tropics and subtropics. It is mostly grown for human consumption and animal forage (Murphy and Colucci, Reference Murphy and Colucci1999), and is widely used as an intercrop in India and Australia (Pengelly and Maass, Reference Pengelly and Maass2001; Maass et al., Reference Maass, Jamnadass, Hanson and Pengelly2005). It is a versatile crop, able to be cultivated in a range of climates and soil types and is relatively drought tolerant. In addition to a food crop, L. purpureus is often grown as a weed suppressor, a soil erosion retardant and as green manure (Liu, Reference Liu1996; Murphy and Colucci, Reference Murphy and Colucci1999; Pengelly and Maass, Reference Pengelly and Maass2001).
Traditional, ‘classical’, breeding, involving exotic and indigenous varieties from southern India, has successfully produced photo-insensitive, high-yielding, determinate L. purpureus lines that can be grown all year round (Mahadevu and Byre Gowda, Reference Mahadevu and Byre Gowda2005). Further breeding objectives would combine characteristics like photo-insensitivity and yield with other desirable attributes, such as improved fragrance, together with pest and disease resistance (Mahadevu and Byre Gowda, Reference Mahadevu and Byre Gowda2005). Some legume crops, as is also the case for non-legume crops, have a relatively narrow genetic base (Udupa et al., Reference Udupa, Sharma, Sharma and Pai1993; Kochert et al., Reference Kochert, Halward, Stalker, Pickersgill and Lock1996; Ladizinsky, Reference Ladizinsky1998). The use of inter-species crosses to produce lines with desirable traits, such as yield improvement or disease resistance, has been one way to overcome the genetic bottleneck of crop plant domestication (Ladizinsky, Reference Ladizinsky1998; Winter et al., Reference Winter, Benko-Iseppon, Hüttel, Ratnaparkhe, Tullu, Sonnante, Pfaff, Tekeoglu, Santra, Sant, Rajesh, Kahl and Muehlbauer2000; Rao et al., Reference Rao, Reddy and Bramel2003; Gur and Zamir, Reference Gur and Zamir2004). This breeding approach, of inter- or wide intra-specific crosses, can benefit from good genetic maps with robust markers anchored to reference genomes, such as are available from comparative genetic maps.
Previous studies of diversity within the L. purpureus spp. and sub-species using RAPD (random amplified length polymorphism) (Liu, Reference Liu1996) and AFLP (amplified fragment length polymorphism) (Maass et al., Reference Maass, Jamnadass, Hanson and Pengelly2005) suggest that there is considerable molecular variation from accessions found in collections that comprise lines from Africa, Asia and Europe, and that these lines could provide useful and desired traits if incorporated into breeding strategies. In addition to this molecular diversity, L. purpureus also has diverse phenotypic characters (Basavarajappa and Byre Gowda, Reference Basavarajappa and Byre Gowda2000; Pengelly and Maass, Reference Pengelly and Maass2001; Maass, Reference Maass2006), reflected in their different growth habits, that have served to provide cultivars fitted to specific environments. Yield losses can be as much as 70% in any 1 year from pests and diseases (M. Byre Gowda, unpublished observations), and this low productivity problem is not unique to L. purpureus but also applies to other legumes (Udupa et al., Reference Udupa, Sharma, Sharma and Pai1993; Kochert et al., Reference Kochert, Halward, Stalker, Pickersgill and Lock1996; Graham and Vance, Reference Graham and Vance2003; Rao et al., Reference Rao, Reddy and Bramel2003). The introgression of alleles from diverse germplasm may provide some opportunities to control yield instability.
Isozymes and RFLP (restriction fragment length polymorphism) (nuclear and plastid) as well as polymerase chain reaction (PCR)-based markers [RAPD, simple sequence repeat (SSR), AFLP and single nucleotide polymorphism (SNP)] have been used to analyse germplasm (Palmer et al., Reference Palmer, Jorgensen and Thompson1985; Karp et al., Reference Karp, Seberg and Buiatti1996; Lu et al., Reference Lu, Knox, Ambrose, Brown and Ellis1996; Mba and Tohme, Reference Mba and Tohme2005). The use of AFLP is advantageous as it has no need for sequence information from the genotypes being analysed, a multiplex of reproducible bands is generated; AFLP is robust and can be automated for high-throughput large-scale studies. Other sequence-based markers do require prior information and, where sequence data are limited for a given species, taxonomically close relatives can provide useful data. For L. purpureus there are few sequences available, but there is a vast amount of sequence data available from related legume species. Comparative mapping within the legume crop and model species (Zhu et al., Reference Zhu, Choi, Cook and Shoemaker2005) provides evidence that this wealth of sequence data can be used for genetic analysis even in neglected legume species such as L. purpureus, especially given that this genome aligns well with Vigna radiata (mungbean) (Humphry et al., Reference Humphry, Konduri, Lambrides, Magner, McIntyre, Aitken and Liu2002).
The aim of the present study was to characterize the genetic diversity within regional L. purpureus from southern India in comparison with lines from international germplasm collections. Two molecular marker types, AFLP, and gene sequence-specific PCR-based markers from a range of legumes, were used and tested within subsets of L. purpureus accessions. This diversity study approach has the potential to define population structure as an aid to identifying useful marker alleles in association with L. purpureus traits such as fragrance and pathogen resistance.
Materials and methods
Plant material
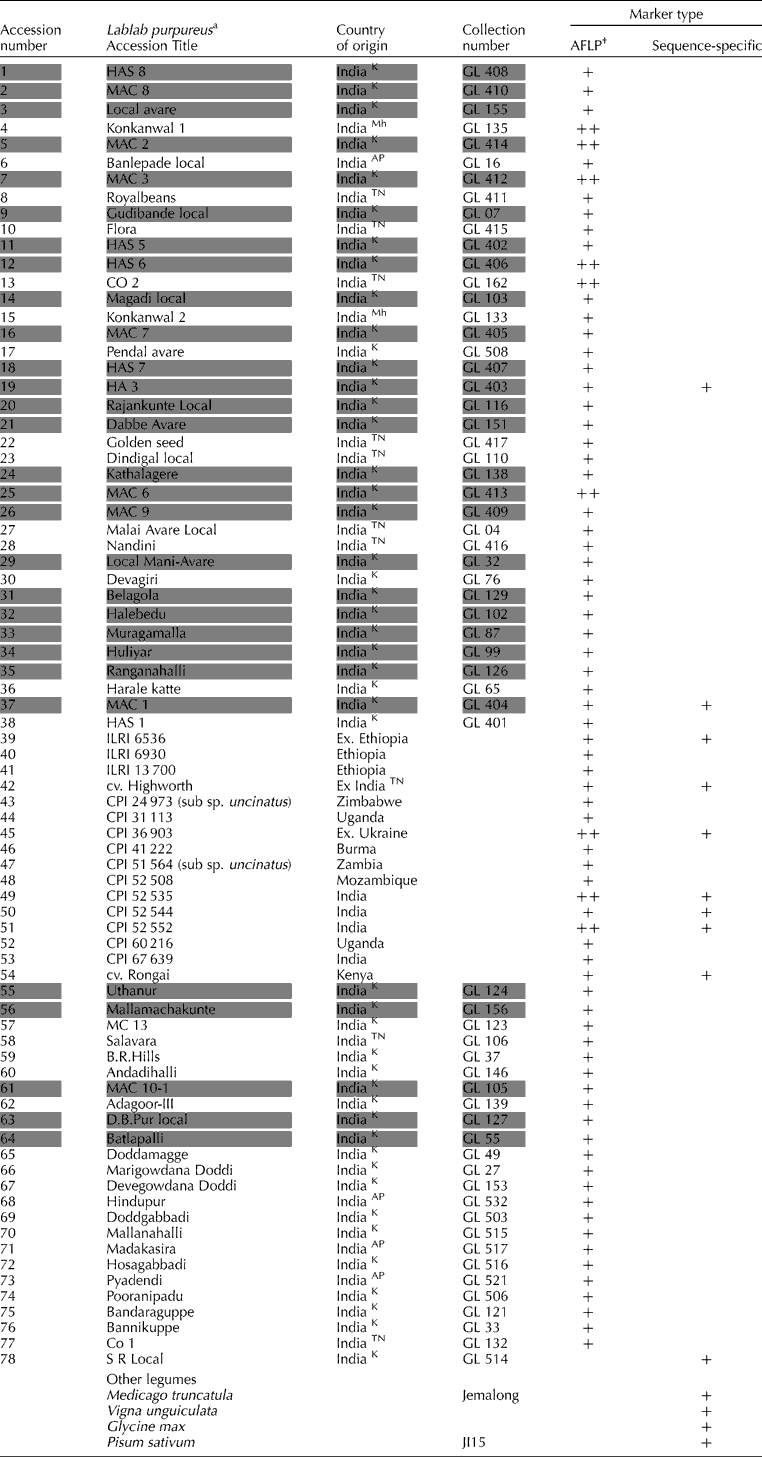
Experiments in this study involved 78 L. purpureus accessions (Table 1) from various sources: (1) GL x, from the University of Agricultural Sciences (UAS), Bangalore, India, including those accessions collected from the southern Indian states of Karnataka, Andhra Pradesh and Tamil Nadu (Fig. 1); (2) accessions from international collections: those from the Australian Tropical Crops Genetic Resources Centre (ATCGRC), are prefixed with CPI, cv. Highworth and cv. Rongai were also obtained from ATCGRC; and those from the International Livestock Research Institute, Ethiopia, are prefixed with ILRI. Individuals from a range of legume species (Medicago truncatula Jemalong, Glycine max, Vigna unguiculata, and Pisum sativum JI15 from the John Innes Centre germplasm collection) were included where necessary for some experiments.
Legume accessions and the marker type tested

a All accessions are L. purpureus sub sp. purpureus except where indicated.
Shaded accession numbers were within the UAS collection pre-2003.
Indian collection sites: K Karnataka; TN Tamil Nadu; AP Andhra Pradesh; Mh Maharashtra.
† Single plus sign AFLP tested once; two plus signs AFLP tested twice.
Lablab purpureus collection sites: AP, Andhra Pradesh; K, Karnataka; TN, Tamil Nadu; Mh, Maharashtra (to the north-west of K). Circles are with, and squares are without, global positioning system (GPS) information.

DNA preparation
A standardized DNA preparation method (Ellis et al., Reference Ellis, Davies, Castleton and Bedford1984) was used for all legumes. L. purpureus DNA was prepared using the standardized method but included a heating step at 37°C for 10 min after addition of sodium dodecylsulphate (SDS), and nucleic acid was not spooled but recovered by pellet after each ethanol precipitation. All DNA preparations were assessed on agarose and were all taken to an approximate concentration of 0.5 μg/μl.
Diversity analysis: molecular markers
AFLP
AFLP using EcoRI and MseI digestion was carried out as described by Vos et al. (Reference Vos, Hogers, Bleeker, Reijans, Vandelee, Hornes, Frijters, Pot, Peleman, Kuiper and Zabeau1995) initially with three primer combinations: EcoRI+CAT/MseI+GTG, EcoRI+CAA/MseI+GTG, EcoRI+CAG/MseI+GTG and tested with accessions 1–53 (Table 1). A second AFLP series using six primer combinations – EcoRI+CAT/MseI+GCC, EcoRI+CAG/MseI+GTG, EcoRI+CAA/MseI+GTG, EcoRI+CAT/MseI+GTG, EcoRI+CAG/MseI+GCC, EcoRI+CAA/MseI+GCC was carried out on a further batch of accessions that included 12 accessions from the initial AFLP (those with two plus signs, Table 1). The reasoning behind the choice of primer combinations was that the results from the initial set of three primer combinations confirmed that there was limited genetic diversity within the UAS accessions. As there were constraints on the number of accessions/gel (limited to a maximum of 60), and many more accessions to test, the second set of six primer combinations was tested using accessions that included a few from the previous test plus an additional set. This strategy tested whether or not the limited genetic diversity within the UAS accessions observed initially was primer combination specific.
The unlabelled AFLP products were run out on 4.5% polyacrylamide gel electrophoresis (PAGE) at 1550 V for 1.5 h and silver stained (Bassam and Caetano-Anollés, Reference Bassam and Caetano-Anollés1993). Bands were scored by four individuals per gel.
Sequence-specific PCR markers
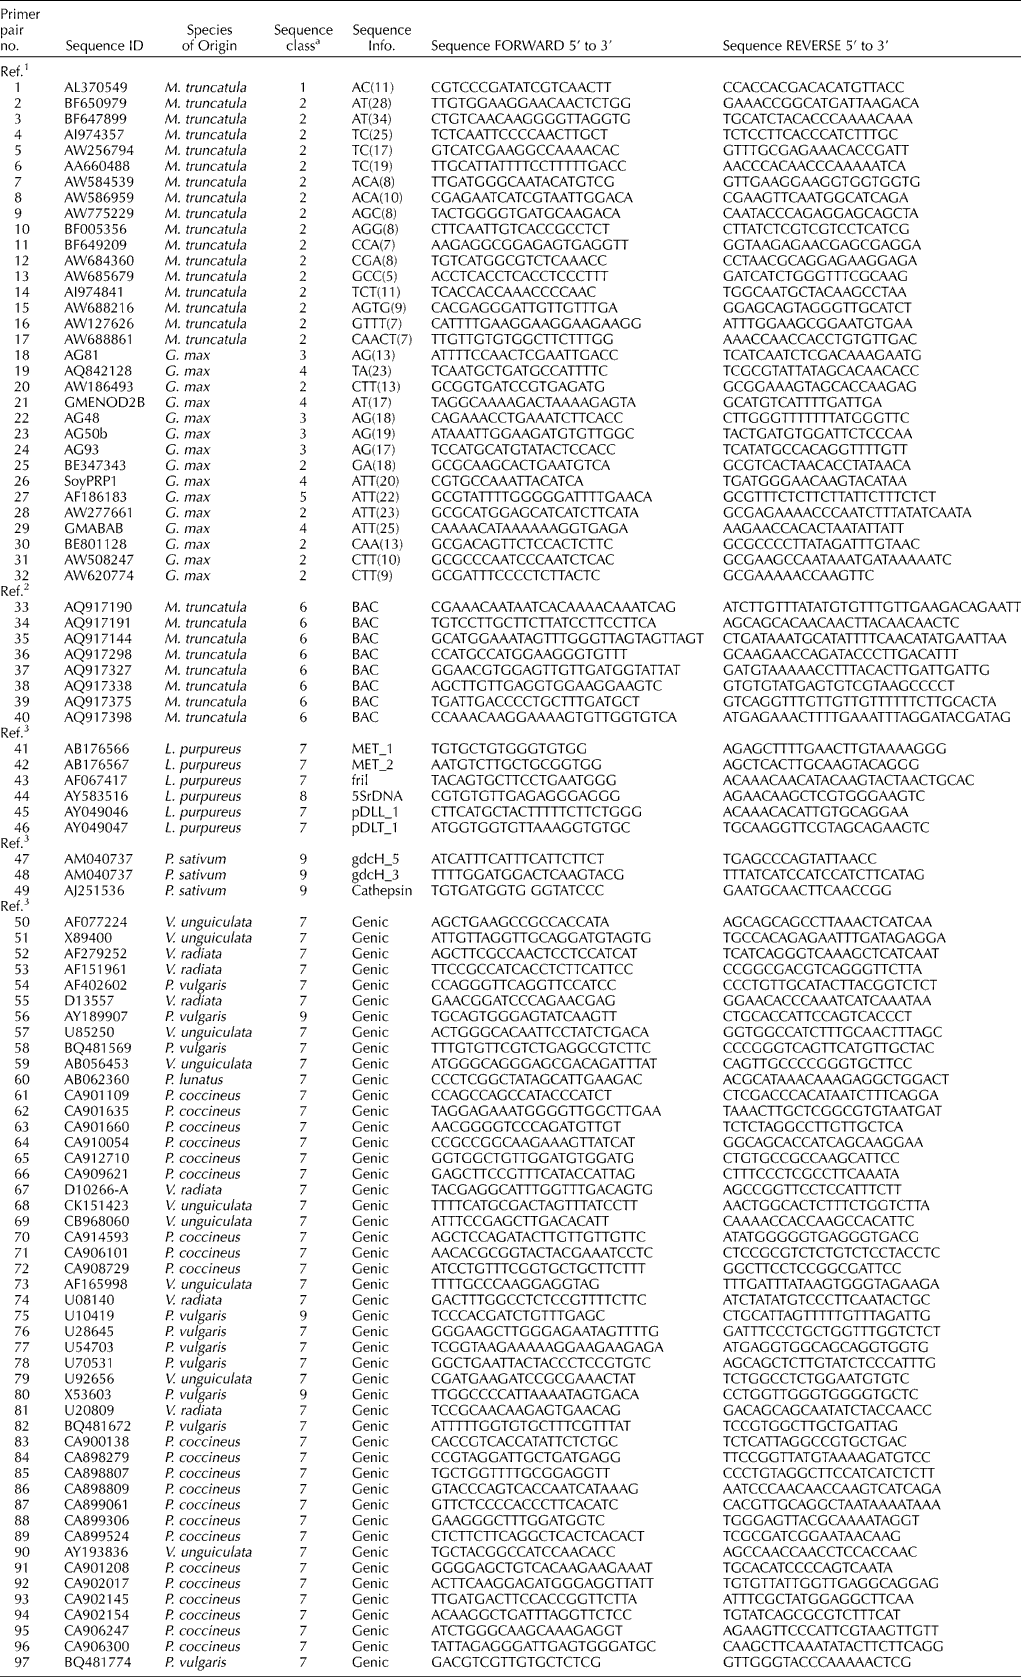
The primer pairs for sequence-specific markers were designed from a range of legume species and are listed in Table 2 as follows: (1) a set of 32 SSR markers (primer pairs 1–32) from EST or gene sequences (Wang et al., Reference Wang, Gillaspie, Newman, Dean, Pittman, Morris and Pederson2004), 17 of the 32 were designed from M. truncatula and 15 from G. max; (2) a set of primers designed from eight M. truncatula BAC (bacterial artificial chromosome) genomic sequences (primer pairs 33–40, Choi et al., Reference Choi, Kim, Uhm, Limpens, Lim, Mun, Kalo, Penmetsa, Seres, Kulikova, Roe, Bisseling, Kiss and Cook2004a). A set of 57 primer pairs were designed from nucleotide sequences from database searches as follows (Table 2): six primer pairs (41–46) from L. purpureus sequences, five of which were EST and one spanned the 5.8S rRNA transcription unit; three (primer pairs 47–49) were P. sativum gene sequences; primer pairs 50–97 comprise 45 EST and 3 genomic sequences, designed from a range of legumes within the Phaseoleae tribe.
Primer information: species of origin, sequence type and primer sequence

Ref.1 Wang et al., Reference Wang, Gillaspie, Newman, Dean, Pittman, Morris and Pederson2004; Ref.2 Choi et al., Reference Choi, Kim, Uhm, Limpens, Lim, Mun, Kalo, Penmetsa, Seres, Kulikova, Roe, Bisseling, Kiss and Cook2004a; Ref.3 this study, nucleotide database search.
a Sequence class description:
1, cDNA EST-derived: containing an SSR portion adjacent to but not spanned by the primers.
2, cDNA EST-derived: containing an SSR portion that is spanned by the primers.
3, Genomic DNA: known SSR-repeat region from other studies.
4, Genomic DNA: SSR in proximity to a gene is spanned by the primers, marker fragment is >500 bp upstream of the ATG start site.
5, Genomic DNA: Calypso retroelement SSR.
6, BAC genomic DNA: end-sequence-tagged.
7, cDNA EST-derived: aiming for intron spanning from genomic DNA template.
8, Nuclear DNA: rDNA repeat.
9, Genomic DNA: gene where the exon and intron positions are known, primers amplify across an intron.
PCR conditions were as follows: 0.1 μmol/l of each forward and reverse primer, 200 μmol/l each dNTP, 1 U of Taq DNA polymerase (Invitrogen, Paisley, UK) and the appropriate reaction buffers, 20–50 ng of DNA, in a 20 μl volume. For all species and all primer combinations the following touch-down cycling regime was used: 94°C/3 min; (94°C/30 s; 50°C/30 s; 72°C/60 s) repeat for 10 cycles reducing the annealing temperature by 0.5°C/cycle; (94°C/30 s; 45°C/30 s; 72°C/60 s) repeat 30 cycles; 72°C/10 min; 12°C/30 min. PCR products (10 μl of each) were visualized on 1.5% agarose for amplification. In the search for polymorphic differences, unlabelled PCR products from a few primer pairs were visualized from 4.5% PAGE gels after silver staining, as above for AFLP.
Data analysis
All gels were scored manually, independently by more than one individual and data were input into Excel (Microsoft) spreadsheets. The band data, for both marker types, was scored as a 1/0 (presence/absence) matrix. Genetic diversity was assessed using the PHYLIP version 3.5 package (http://evolution.gs.washington.edu.phylip.html) within which GENDIST was used for the calculation of distance matrices using Nei's genetic distance (D); these distance matrices were used as the basis for calculating the principal component analyses with Minitab version 13. (www.minitab.com).
Results
AFLP diversity analysis
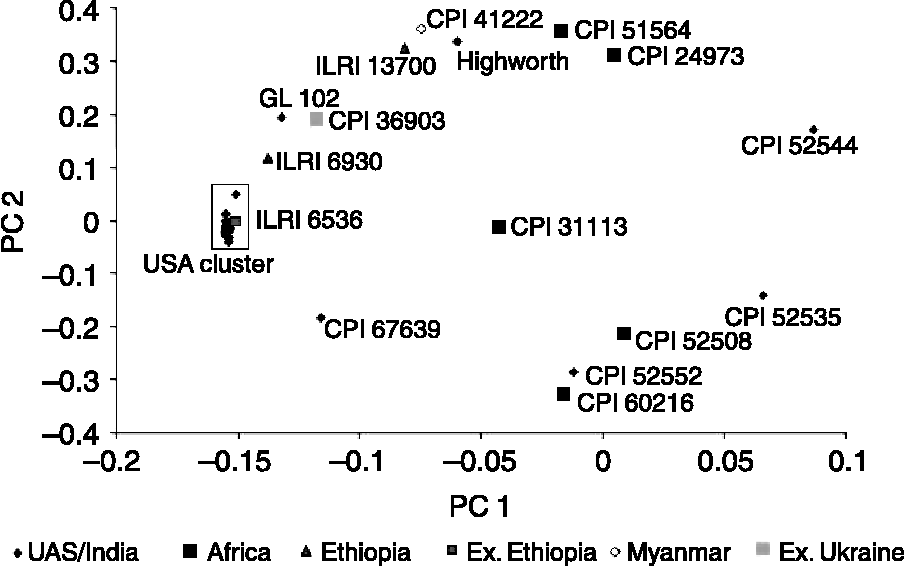
The genetic diversity of 53 L. purpureus accessions (Table 1, 1–53) assessed from 151 AFLP markers from three primer combinations can be seen as a principal component analysis (PCA) plot (Fig. 2). This figure shows that there is very little genetic diversity within a set of 38 UAS L. purpureus accessions from the UAS germplasm collection in Bangalore (24 previously within the collection plus 14 new additions from more recent plant collection expeditions) compared to a more diverse set of 15 accessions (Table 1, 39–53), that included some from Africa. The more diverse set of 15 CPI and ILRI accessions, from the two International collections, were chosen on the basis of the widest genetic distance from a RAPD marker study (Liu, Reference Liu1996). The principal component analysis of Fig. 2 showed that the first principal component accounts for 78% of the variance of the AFLP scoring data; the second and third components account for 11% and 4% of the variance. The limited diversity within the UAS L. purpureus accessions, captured in the first two dimensions of the data, can be seen as a tight cluster of points (within the small rectangle, Fig. 2); in contrast there is generally a wide scatter of the CPI and ILRI accessions. There are a couple of exceptions: UAS line GL 102 sits just outside the tight UAS cluster and the line ILRI 6536, originally from Ethiopia, clusters within the rectangle of UAS lines. It should be emphasized that the CPI lines 52544, 52535, 52552 and cv. Highworth are all from India and are peripheral within the PCA, along with other accessions from Africa and Myanmar that are scattered away from the main UAS cluster. The accessions CPI 51564 from Zambia and CPI 24973 from Zimbabwe cluster together, both are classified as sub-species uncinatus (Maass et al., Reference Maass, Jamnadass, Hanson and Pengelly2005). This suggests that the molecular variation, based on the AFLP data, within the UAS collection set of 38 is very limited compared to the species as a whole.
Principal component analysis (PCA) of the molecular genetic diversity of 53 Lablab purpureus accessions with 151 amplified fragment length polymorphism (AFLP) markers. Figure symbols apply also to Reference Boutin, Young, Olson, Yu, Shoemaker and VallejosFigs 3a and b.

These observations were generally reinforced from the second study with 253 AFLP markers from a different set of six primer combinations, based on 33 accessions (numbers 54–77, Table 1), 19 of which were collected more recently from the southern states of India, and five already existing within the UAS germplasm collection. A subset of nine from the previous study (Table 1, those nine with two plus signs in the AFLP column) were also included.
Sequence-specific markers from a range of legume species
The sequence-specific markers from 97 primer pairs comprise nine classes of sequence type from a range of legumes, and Table 2 lists the species of origin, sequence class, primer sequences and the references from which the primers were obtained. These markers were derived from various sequence classes: cDNA ESTs some of which included SSR (simple sequence repeats) motifs, gene-related sequence information, and genomic BAC sequence.
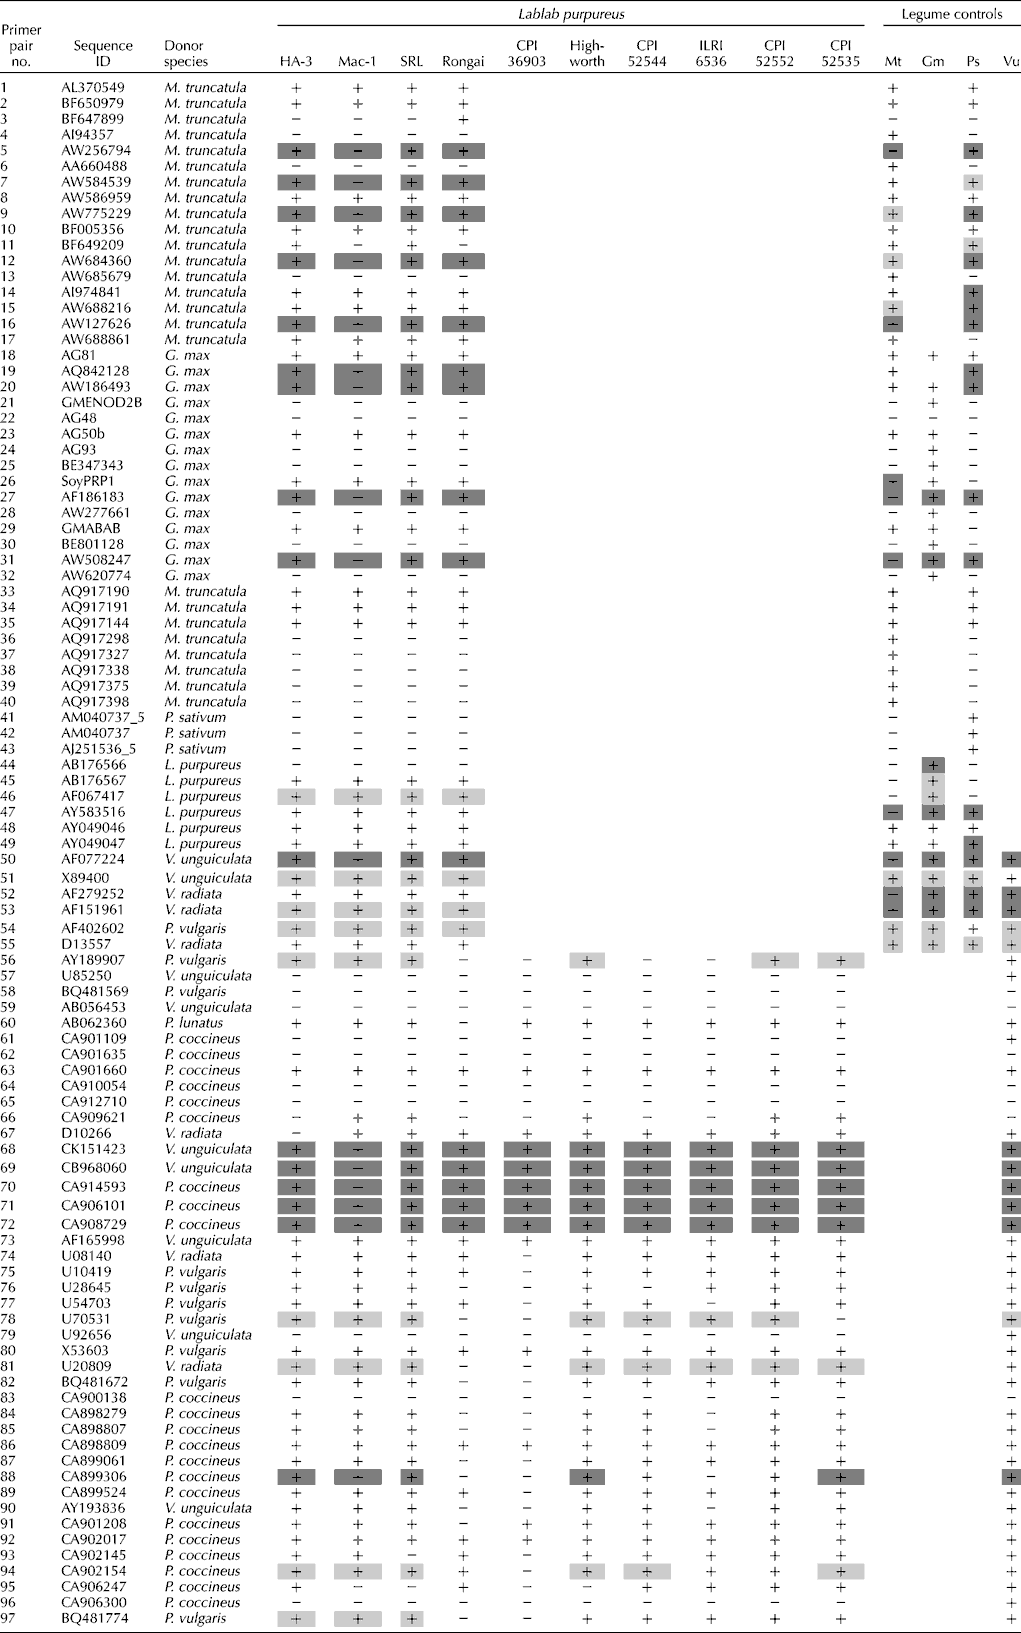
The first 55 primer pairs (1–55, Table 3) were tested (in duplicate as controls for reproducibility) using L. purpureus lines, HA 3, SR L and MAC 1. For each primer pair products were reproducible and generally the same size across the genus. Control DNA, of the species or genus from which primers were designed, was used for these 55 markers (Table 3).
Amplification success of the sequence-specific markers

Blank, not tested; +, band amplified; − , line tested but no amplification.
Where there was amplification: no shading, only one band amplified; light shading, double bands; dark shading, multi-bands ≥ 3.
A sub-set of 10 L. purpureus accessions along with a range of legume species (Table 1) was tested using a further set of 42 primer pairs (56–97, Table 3). Control DNA was not always available but other legumes were always tested in addition to L. purpureus (Table 3). From the AFLP analysis it was clear that the most diverse L. purpureus lines were the CPI and ILRI accessions from the two international collections; so a subset of these, which included some lines from India, were chosen as representative (Table 1). The accessions comprised three UAS parental breeding lines, HA 3, SR L and MAC 1; plus seven more diverse lines: ILRI 6536, cv. Rongai, cv. Highworth, CPI 52535, CPI 52544, CPI 52552, and CPI 36903.
L. purpureus amplification success using primer pairs from a range of legume species
Sequence information from a diverse range of legume species was used to design the 97 primers pairs which were then tested against L. purpureus and a range of other legumes; a negative PCR should be treated as failure, either from technical PCR problems but more than likely mis-matching at priming sites, rather than sequence absence.
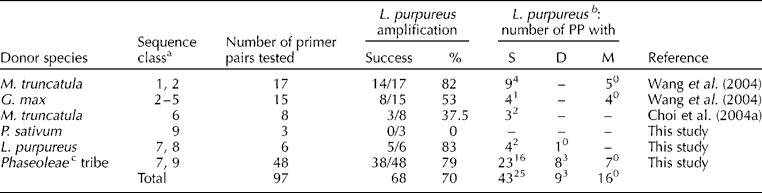
The band scoring data can be seen in Table 3, and Table 4 summarizes the amplification success rate; generally, this is high, with 68 of the 97 primer pairs tested giving products. L. purpureus DNA was amplified by 22 of the 32 primer pairs generating SSR-related markers (Table 3 primer pairs 1–32); there was 82% amplification success from M. truncatula compared to 53% of the G. max primer pairs (Table 4). Table 3 shows that none of the three P. sativum primer pairs (numbers 41–43) amplified L. purpureus DNA and 3/8 of the primers from Choi et al. (Reference Choi, Kim, Uhm, Limpens, Lim, Mun, Kalo, Penmetsa, Seres, Kulikova, Roe, Bisseling, Kiss and Cook2004a) successfully amplified L. purpureus DNA (primer pairs 33–40); in both these cases the control species P. sativum and M. truncatula were amplified, and the expected band size obtained, with all the primer pairs tested (Table 3). For the 48 primer pairs from sequence classes 7 and 9 (Table 2), designed from a variety of legumes of the Phaseoleae tribe (primer pairs 50–97, Table 3), 79% gave amplification products with L. purpureus: 48% being single and 17% double band amplifications (Table 4).
Summary of amplification success of the sequence-specific markers

a See bottom of Table 2 for the sequence class from which the marker is derived.
b The L. purpureus banding pattern obtained per primer pair (PP): S = single band; D = double band; M = multi-band (≧ 3); superscripts in this column refer to the number of primer pairs where the amplified L. purpureus band is shared with a control or another legume species; in the case of the six L. purpureus sequence primers, band sharing is with M. truncatula.
c See Table 2, primer pairs 50–97, for the list of legumes tested from the Phaseoleae tribe.
There are only a few L. purpureus sequences in the nucleotide databases. Of the six L. purpureus primer pairs tested (44–49, Table 3), four produced a single band, one a doublet, and one failed to amplify from L. purpureus DNA. The one failure may have been due to the region chosen for primer design coinciding with an exon/intron boundary, and this may also explain some of the failed amplifications from other primer sets. Amplification of G. max using the set of six L. purpureus-derived primer pairs resulted in two cases each of single, doublet or multi-band patterns (Table 3); four of the six gave either the same size band on 1.5% agarose or a reasonably strong band of a similar size as L. purpureus. This corresponds to 67% of L. purpureus primer sequences able to amplify G. max. Similarly, in the other two species where a single band of the same size was produced, as assessed on 1.5% agarose, 33% of L. purpureus primer pairs amplified M. truncatula (48 and 49, Table 3) and 17% amplified P. sativum (48, Table 3). The L. purpureus DNA primer pair 47 (Table 3) amplified a fragment that corresponds to 5.8S rRNA sequence flanked by internal spacer sequences, and produced a multiple band pattern from the three other legumes tested (Table 3).
One assumption from scoring the agarose gels was that similar band sizes across those legumes tested were amplifications from orthologous genomic sequences. Where there was amplification with L. purpureus DNA (Table 4) 43/68 (63%) primer pairs produced a single band and each of these was regarded as allelic to the others. From examination of 1.5% agarose gels, in 25 of the 43 cases the amplification product was the same band size with at least one of the other legumes tested. Double bands were found in 9 of the 68 and in three cases this doublet was shared with at least one other legume (Table 4). Sixteen primer pairs gave a multi-band pattern (Table 4) and in all cases the L. purpureus pattern was generally identical but on occasion a band was sometimes missing/gained from one or other of the four lines tested. The multi-band pattern generated with L. purpureus was never the same as any of the other legumes. This suggests a degree of non-specific amplification and any polymorphic marker from this type of reaction is much like a RAPD (Williams et al., Reference Williams, Kubelik, Livak, Rafalski and Tingey1990).
In one case the G. max AF186183 (number 27, Table 3) primer pair gave a multi-band/smear pattern over the size 150–500 bp range in L. purpureus, M. truncatula, P. sativum and G. max. From the database, AF186183 contains sequence related to (but incomplete) the Calypso-2-1 retroelement (normally c. 11 kb) found in abundance in G. max (Wright and Voytas, 2002). This primer pair spans a region within the polyprotein of Calypso; the smear very likely comes about from the repetitive nature of the retroelement amplified from AF186183, so generating many copies. This sequence information could be adapted to obtain SSAP (sequence specific amplified polymorphism) markers (Ellis et al., Reference Ellis, Poyser, Knox, Vershinin and Ambrose1998) as a valuable addition to molecular marker types transferable between legumes.
Polymorphism within L. purpureus from sequence-specific markers
Single or a few base changes would not be obvious from 1.5% agarose and further testing using more stringent conditions (3% agarose), the use of PAGE or SSCP (single strand conformational polymorphism), or sequencing would be required to resolve polymorphisms. Where a single band only was amplified with L. purpureus and that was also shared with the control legume or another legume, i.e. the same size assessed on agarose (Table 3), about one-third (5/13, Table 4) were from primer pairs generating SSR-containing markers (sequence classes 1–4, Table 2) compared to two-thirds (20/30, Table 4) from the non-SSR containing EST and genomic DNA sources (sequence classes 6–9, Table 2).
From the primer pairs that did amplify L. purpureus DNA (Table 3) there were no obvious polymorphic differences, i.e. no co-dominant markers, between the three L. purpureus parental lines, HA 3, MAC 1 and SR L used in crosses for breeding purposes, and cv. Rongai on agarose gels (primer pairs 1–55). However, there were a few cases within the primer pairs 56–97 where at least one L. purpureus failed to amplify (Table 3), this could be technical failure of PCR but these were consistent observations. These dominant polymorphisms correspond to mismatch at the primer binding sites, in which case SNPs or length variants could be pursued as markers. Some of the successful primer combinations gave a multi-band pattern with L. purpureus and a number have been tested on PAGE and visualized using silver stain. There were few polymorphic differences, but these also appear to be dominant markers: much like those generated using AFLP. The five L. purpureus specific primers (Table 3, 45–49) that successfully amplified were tested using both 1.5% and 3% agarose; all band sizes were identical in the four lines.
Diversity of L. purpureus in relation to cowpea as an outgroup
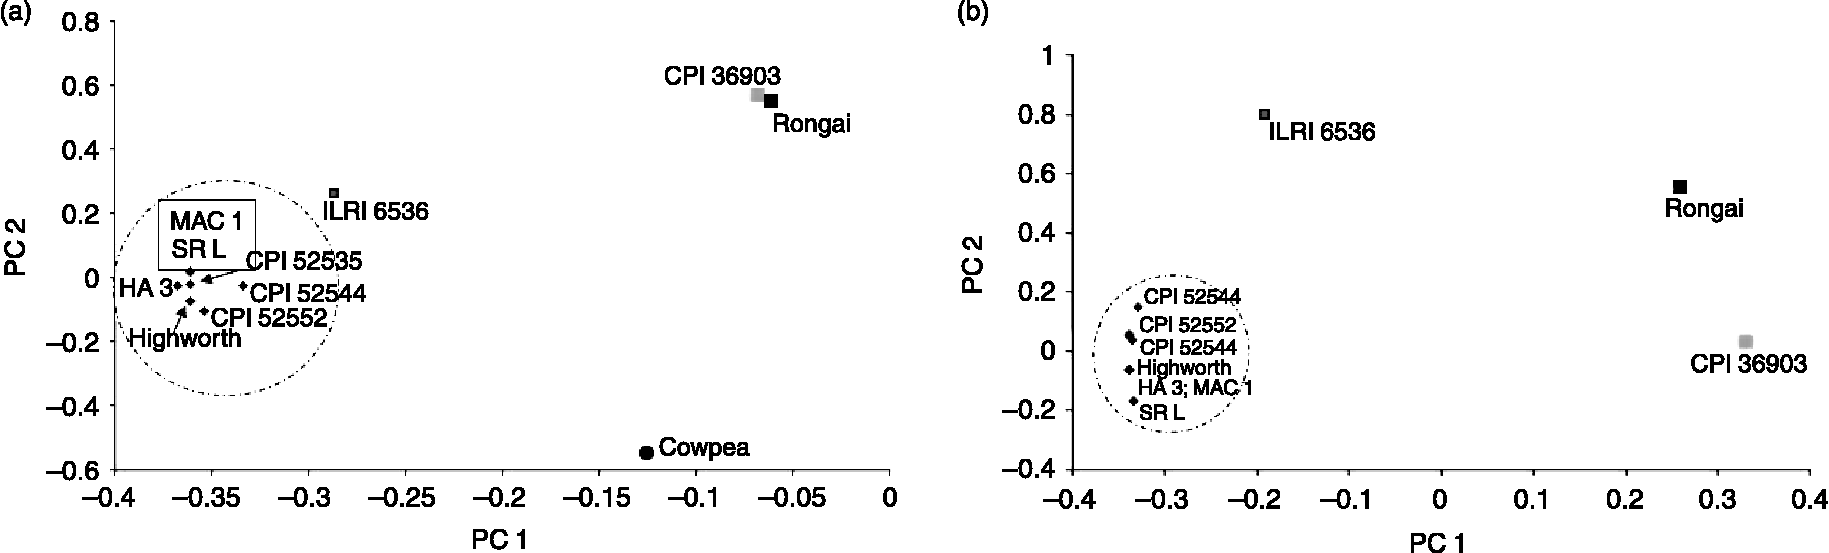
For 18 primer pairs (56–97, Table 3) there were 21 amplification products from cowpea (Vigna unguiculata) DNA which had the same mobility in agarose gels as at least one of the amplification products from L. purpureus DNA, with an additional ten products being unique to cowpea (Table 3). The genetic distance matrix of these 31 marker band scores is shown as a PCA (Fig. 3a) where there are three distinct groupings. The outgroup cowpea constitutes one group near to the x-axis, the seven Indian-derived L. purpureus cluster within the hashed oval, close to this comes ILRI 6536 Ex. Ethiopia; the African line cv. Rongai from Kenya and CPI 36 903 Ex. Ukraine cluster together at the top right. This spread of variation based on Nei's genetic distance (D) is as expected from a data set that includes an outgroup from a differing but related species. The genetic distance between L. purpureus and cowpea is probably an underestimate in this assay because differences between the two species were based on the presence and absence of a band rather than nucleotide differences. This explains why there appears to be just as much variation between cowpea and either of the two L. purpureus groupings as there is between the cluster of eight L. purpureus at the extreme left of the PCA (Fig. 3a) and the two non-Indian L. purpureus at the top right.
Principal component analysis (PCA) of the molecular diversity obtained from the sequence-specific markers: (a) based on 18 primer pairs and 21 amplification products from cowpea (Vigna unguiculata) DNA having the same mobility in agarose gels as at least one of the ten Lablab purpureus. It must be noted that the genetic divergence of cowpea in relation to L. purpureus is underestimated in this PCA as it is strongly biased by scoring amplification products without regard to sequence variation. (b) The PCA for ten L. purpureus based on 32 primer pairs and 35 marker bands (Table 3 data, primer pairs 56–97).

This overall pattern of diversity within L. purpureus from Fig. 3a is maintained for the L. purpureus data alone without cowpea (Fig. 3b). The PCA for the ten L. purpureus (Fig. 3b) taken from Table 3 data comprises 35 markers from 32 primer combinations with information content (pairs 56–97). This PCA shows a similar pattern of diversity within the L. purpureus set of Fig. 3a and with the AFLP phylogeny (Fig. 2): the three UAS parental lines HA 3, MAC 1 and SR L all cluster closely. However, cv. Highworth (Ex. India, introduced to Australia via Kenya) – a cultivar that has adapted to Australian conditions, is widely used for forage (Liu, Reference Liu1996; Pengelly and Maass, Reference Pengelly and Maass2001) and is not known to be cultivated in India – clusters very closely with the UAS lines in this sequence-specific marker analysis, compared to more distantly in the AFLP analysis (Fig. 2). The three other Indian accessions, CPI lines 52535, 52552 and 52544 cluster in this Indian section of the plot (Fig. 3b). The Ex. Ethiopian line ILRI 6536 tends to be consistently within or just peripheral to the major L. purpureus cluster in all the tests (Figs 2 and 3a, b); in contrast, the Ex. Ukraine line CPI 36 903 tends to be distant to the Indian accessions. The three UAS parental breeding lines, SR L, HA 3 and MAC 1, always cluster tightly together regardless of the marker assay.
Discussion
AFLP and sequence-specific markers: general overview
Two marker types were used in this study, AFLP and sequence-specific markers. These different approaches address variation in different components of the genome, so differences in their behaviour may be informative.
Many plant phylogenetic studies have been carried out using AFLP (Mba and Tohme, Reference Mba and Tohme2005), and this marker method provides a rapid and reproducible banding pattern that gives an indication of relatedness and diversity within a species. The AFLP marker analysis provides genotypically distinct groupings within related species; molecular data from this type of marker are described by Karp et al. (Reference Karp, Seberg and Buiatti1996) as ‘arbitrary indicators of diversity’. AFLP, however, is not the ideal marker for diversity analyses, mostly because AFLP polymorphic bands are generally dominant markers; where for each marker only one allele is apparent. Also, co-migration of coincident rather than allelic bands may introduce errors; these difficulties have not deterred its use in phylogenetics (Karp et al., Reference Karp, Seberg and Buiatti1996; Mba and Tohme, Reference Mba and Tohme2005).
Many of the markers from the 97 sequence-specific primer pairs (Table 2), on the other hand, are from coding regions of known conserved genes. When gene-related markers are co-dominant they indicate allelic variation providing information not unlike RFLPs. As they generally represent conserved coding regions, gene-related markers are transferable within and between species and genus (Karp et al., Reference Karp, Seberg and Buiatti1996); when mis-matching at the priming site occurs, these will be dominant markers.
Diversity analysis of L. purpureus from the two marker types
All of the genera studied here are within the Papilionoideae sub-family that contains most of the cultivated crop legumes (Young et al., Reference Young, Mudge and Ellis2003). L. purpureus along with Vigna spp. and Phaseolus spp. are in the Phaseoleae tribe (Lackey, Reference Lackey, Polhill and Raven1981), a member of the Millettoid clade (Cronk et al., Reference Cronk, Ojeda and Pennington2006). This clade also includes the sub-tribe Glycinineae, of which G. max is a member (Lackey, Reference Lackey, Polhill and Raven1981). Pea, which is within the Vicieae tribe, and Medicago within the Trifolieae tribe (Doyle, Reference Doyle, Crisp and Doyle1995; Wojciechowski, Reference Wojciechowski, Klitgaard and Bruneau2003), are members of the Galegoid clade (Cronk et al., Reference Cronk, Ojeda and Pennington2006). In this study sequence-specific markers from species representing the three tribes, Phaseoleae (including sub-tribe Glycinineae), Vicieae and Trifolieae were tested for L. purpureus DNA amplification.
Assessments of relatedness within a species would be expected to have broad agreement of groupings no matter which marker type is employed, provided it is reliable and reproducible. In fact, the two marker types, AFLP and sequence-specific, used in this diversity analysis resulted in broad agreement even though differing genomic regions were examined and fewer L. purpureus accessions were tested with the gene-related markers.
The diversity analysis using AFLP markers clearly showed that there was limited genetic variation within the UAS and locally collected L. purpureus germplasm from the southern states of India compared to the genus as a whole. Limited genetic diversity at the molecular level is not uncommon within some germplasm stocks of legumes (chickpea: Udupa et al., Reference Udupa, Sharma, Sharma and Pai1993; Winter et al., Reference Winter, Benko-Iseppon, Hüttel, Ratnaparkhe, Tullu, Sonnante, Pfaff, Tekeoglu, Santra, Sant, Rajesh, Kahl and Muehlbauer2000; pigeonpea: Rao et al., Reference Rao, Reddy and Bramel2003; peanut: Kochert et al., Reference Kochert, Halward, Stalker, Pickersgill and Lock1996). However, the AFLP did manage to distinguish between Indian cultivars and breeding stock held within the UAS collection, and the other Indian accessions held within the Australian (ATCGRC) collection (Fig. 2: accessions CPI 52544, CPI 52535, CPI 52552). But the sequence-specific primer pairs failed to do this (Fig. 3b), all seven Indian accessions that comprised UAS and CPI/ILRI lines, clustered together with this marker type.
In both diversity analyses the non-Indian accessions were more distinct (Figs 2 and 3a, b), and this was quite marked, but dependent on the markers used to score the data – see differences between Figs 3a and 3b for cv. Rongai and CPI 36903. Compared to AFLP, the sequence-specific marker type seems to be assessing diversity within more conserved regions of the genome.
Apart from the commonly cultivated accessions, more genetically diverse lines within L. purpureus species do exist and are available for integration of exotic alleles.
Amplification success of sequence-specific markers from a range of legume species
The sharing of markers within the legumes for comparative and quantitative trait loci (QTL) mapping have been documented (Young et al., Reference Young, Mudge and Ellis2003; Zhu et al., Reference Zhu, Choi, Cook and Shoemaker2005) and considerable conservation and synteny between model and crop genomes have been found (Young et al., Reference Young, Mudge and Ellis2003; Choi et al., Reference Choi, Mun, Kim, Zhu, Baek, Mudge, Roe, Ellis, Doyle, Kiss, Young and Cook2004b; Kalo et al., Reference Kalo, Seres, Taylor, Jakab, Kevei, Kereszt, Endre, Ellis and Kiss2004; Zhu et al., Reference Zhu, Choi, Cook and Shoemaker2005). In QTL-mapping, RFLP markers within the QTL regions, conferring the greatest effect on seed weight, in both cowpea and mungbean, had the same order (Fatokun et al., Reference Fatokun, Menanciohautea, Danesh and Young1992). In a further QTL analysis, an orthologous seed weight gene of soybean was found to be shared with cowpea and mungbean (Maughan et al., Reference Maughan, Maroof and Buss1996). Similarly, Timmerman-Vaughan et al. (Reference Timmerman-Vaughan, McCallum, Frew, Weeden and Russell1996) found the genomic regions containing seed weight QTLs in cowpea, mungbean and pea, to be highly conserved. Together these three studies suggest conservation of orthologous genes within these four species for the polygenic seed weight trait. RFLP linkage mapping showed mungbean and common bean (P. vulgaris) to have a high degree of synteny compared to either of these two species with soybean (Boutin et al., Reference Boutin, Young, Olson, Yu, Shoemaker and Vallejos1995). A study of co-linearity between mungbean and L. purpureus (Humphry et al., Reference Humphry, Konduri, Lambrides, Magner, McIntyre, Aitken and Liu2002), using a common set of 65 RFLP, showed there was a high degree of conservation in marker order across 10 of the 11 linkage groups of mungbean, corresponding to 15 L. purpureus groups.
This study centred on L. purpureus diversity, and the potential use of sequence-specific markers from species related to L. purpureus. The results suggest that there is a good source of legume-related sequences in databases readily available for L. purpureus diversity and genome analysis. The data presented here also agree with recent primer transferability studies involving L. purpureus (Wang et al., Reference Wang, Gillaspie, Newman, Dean, Pittman, Morris and Pederson2004). The transferability of EST-based SSR markers from M. truncatula to G. max was 55%, compared to 28% the other way round. Wang et al. (Reference Wang, Gillaspie, Newman, Dean, Pittman, Morris and Pederson2004) attributed this to the twofold genome size difference between these species, which are distantly related and are within differing legume tribes (Doyle, Reference Doyle, Crisp and Doyle1995). Similarly, in our study, 67% of L. purpureus primer pairs amplified G. max compared to 53% in the other direction. The G. max genome is substantially duplicated (Young et al., Reference Young, Mudge and Ellis2003), and it is thought that it has undergone considerable rearrangement during its diploidization from an ancient polyploid (Boutin et al., Reference Boutin, Young, Olson, Yu, Shoemaker and Vallejos1995). These factors, coupled with the degree of relatedness and genome size differences, may explain the lower amplification rate of G. max sequence-specific primer pairs to Medicago and L. purpureus.
In this study, 82% of M. truncatula and 53% of G. max (Table 4) amplified L. purpureus. The figure of 82% amplification success is biased, as the 17 Medicago EST-based SSR primer pairs (Table 4) tested in this study were chosen at the suggestion of the authors of the Wang et al. (Reference Wang, Gillaspie, Newman, Dean, Pittman, Morris and Pederson2004) paper and known to previously amplify L. purpureus. Amplification of L. purpureus from 3/8 (37.5%) primer pairs (all M. truncatula sequences) from Choi et al. (Reference Choi, Kim, Uhm, Limpens, Lim, Mun, Kalo, Penmetsa, Seres, Kulikova, Roe, Bisseling, Kiss and Cook2004a), gives a figure consistent with the 36% reported by Wang et al. (Reference Wang, Gillaspie, Newman, Dean, Pittman, Morris and Pederson2004). This degree of amplification success using heterologous primer pairs is also in agreement with other studies using genic SSRs from M. truncatula, the success rates for amplification of pea, faba bean and chickpea were 37.6%, 40% and 36.6%, respectively (Gutierrez et al., Reference Gutierrez, Patto, Huguet, Cubero, Moreno and Torres2005).
The same set of 15 G. max primers was used in both this study and that of Wang et al. (Reference Wang, Gillaspie, Newman, Dean, Pittman, Morris and Pederson2004). In this study 53% of G. max primer pairs amplified L. purpureus (Table 4) compared to 23% in Wang et al. (Reference Wang, Gillaspie, Newman, Dean, Pittman, Morris and Pederson2004); single bands were amplified in 26.5% (4/15, Table 4) of cases – more in keeping with the Wang et al. (Reference Wang, Gillaspie, Newman, Dean, Pittman, Morris and Pederson2004) result – and 26.5% gave multiple bands; there were no cases of double bands (Table 4).
The P. sativum primers failed in L. purpureus. These plants are from distantly related genera and differ markedly in genome size, so this lack of success with a small sample of primers is not surprising, given the success rate of the Medicago primers. Though L. purpureus and M. truncatula are from different tribes, their haploid genome size is similar, 3.68 × 10⁸ and 4.66 × 10⁸ bp, respectively (http://www.rbgkew.org.uk/cval).
The 48 sequence-specific primer pairs 50–97 (Table 3) successfully generated amplification products from L. purpureus in 79% of cases, with 65% being single/double band amplifications: the donor species were Vigna unguiculata, V. radiata, Phaseolus vulgaris, P. lunatus and P. coccineus (Table 3). All of these species have genomes of a similar size (c. 5 × 10⁸–8 × 10⁸ bp; http://www.rbgkew.org.uk/cval) and all are relatively closely related within the Phaseoleae tribe. This high rate of amplification success between L. purpureus and these closely related species is of a similar order to that found by Eujayl et al. (Reference Eujayl, Sledge, Wang, May, Chekhovskiy, Zwonitzer and Mian2004) where 74% of EST-derived SSR primer pairs from M. truncatula gave amplification of the expected band size in at least one other Medicago species.
The amplification success of the six sequence-specific markers from L. purpureus to G. max, M. truncatula and P. sativum was 67%, 33% and 17%, based on single band amplification.
Molecular marker analyses, genotyping and phenotyping of germplasm, together with the incorporation of exotic and underutilized germplasm into breeding programmes, offers new potential for enhancing desired traits in breeding programmes. In this study we have shown that molecular markers can be used successfully to understand the genetic structure of the germplasm of L. purpureus, and identified a series of sequence-specific markers that potentially could be used in L. purpureus genetic mapping analyses.
Acknowledgements
The authors thank the participants of the 2003 course, Molecular Marker Techniques for Crop Improvement, who obtained the AFLP data for the diversity analysis and whose names can be found at: http://www.kirkhousetrust.org/projects/2003_10_Bangalore/course_participants.
We thank: B. Pengelly, B. Maass and R. Koebner for their active participation during the 2003 course; B. Maass for helpful comments on this manuscript; M. L. Wang for useful information regarding primer choice for part of the sequence-specific analysis; the Kirkhouse Trust for funding the project with collaboration from the John Innes Centre, which is supported by a grant in aid from the Biotechnology and Biological Sciences Research Council, UK; and the University of Agricultural Sciences, Bangalore. N. Ellis acknowledges the support of FP6 EU project, Grain Legumes (FOOD-CT-2004-506223).