Introduction
Bipolar disorder
The factors contributing to relapse in bipolar disorder (BD) are not yet clearly understood, but it has been suggested that there is an association with dysregulation of circadian rhythmReference Alloy, Ng, Titone and Boland1, Reference Murray and Harvey2 and sleep,3–7 where BD has been reported to be associated with a later chronotype.Reference Gershon, Kaufmann and Depp8, Reference Kaufmann, Gershon, Depp, Miller, Zeitzer and Ketter9 Circadian rhythm dysregulation appears both in acute episodes and in euthymic periods of BD. Therefore, measurements of circadian rhythm via motor activity profiles may provide a valid trait marker of BD,Reference Milhiet, Etain, Boudebesse and Bellivier10 and a deeper understanding of this dysregulation may contribute to improved management of the disease.Reference Merikangas, Swendsen and Hickie11, Reference Scott, Murray and Henry12
Actigraphy studies in BD patients
Actigraphy is a convenient way to study motor activity patterns. Existing findings from actigraphy studies suggest that circadian rhythm and sleep are disrupted in patients with BD, even in the remitted state. Current evidence, including reviews (meta-analyses),Reference Alloy, Ng, Titone and Boland1, Reference Geoffroy, Scott and Boudebesse4, Reference Scott, Murray and Henry12, Reference Scott13 documents lower overall activityReference St-Amand, Provencher, Bélanger and Morin7, Reference Scott, Murray and Henry12, 14–16 and longer and more disrupted sleep in remitted BD patients than in healthy controls (HCs).Reference Geoffroy, Boudebesse and Bellivier5, Reference Millar, Espie and Scott6, 17–19 Similar observations have been found also in unaffected child and adolescent offspring of parents with BD.Reference Sebela, Kolenic, Farkova, Novak and Goetz20 Although previous studies have improved the understanding of motor activity in BD patients, most existing studies are based on a limited period of actigraphy monitoring and therefore miss the opportunity to assess and account for intraindividual temporal variations in actigraphy parameters. Variability in sleep and in circadian parameters, obtained from actigraphy, suggests lower levels of synchronization of BD patients with the day and night rhythmReference Geoffroy, Boudebesse and Bellivier5, Reference Scott13, Reference Harvey, Schmidt, Scarnà, Semler and Goodwin16, Reference Gershon, Thompson, Eidelman, McGlinchey, Kaplan and Harvey17, Reference Bei, Wiley, Trinder and Manber21 and may be closely connected with the symptomatic periods.Reference Scott, Murray and Henry12, Reference Krane-Gartiser, Henriksen, Morken, Vaaler and Fasmer22 The short duration of the studies (mostly < 14 days, the longest being 50 days—see Supplementary Material) is a limitation for variability assessment.Reference Millar, Espie and Scott6, Reference Gershon, Thompson, Eidelman, McGlinchey, Kaplan and Harvey17, Reference Mullin, Harvey and Hinshaw23 In order to overcome these issues, we increased the observation period in the actigraphy study presented here to 90 days, aiming to focus on intraindividual long-term temporal variability (LTTV) in circadian rhythm and sleep parameters.
Contrary to statistical evaluation, the machine-learning techniques provide a means to quantify between-group differences by evaluation classification power of a set of features (biomarkers), considering complex nonlinear relationships and correction among features. There are at least two recent actigraphy studies employing this approach for actigraphy-based BD–HC classification. The first was done by Faedda et al.Reference Faedda, Ohashi and Hernandez24 who reached 83% accuracy with 64% sensitivity and 92% specificity, using 3 to 5 days of actigraphy and diary data from children (5-18 years old). There was no medication used, and all data were recorded during a similar regime (school days). The second recent study by Krane-Gartiser et al.Reference Krane-Gartiser, Scott and Nevoret25 applied classification algorithms to a set of 61 HCs and 61 remitted BD patients, with stable medication, resulting in 78% accuracy (75% sensitivity and 80% specificity) using selected actigraphy features and MADRS scores, resulting in 70% accuracy using actigraphy alone. The main advantages were the use of matched groups (including employment status) and strict remission criteria (MADRS and YMRS ≤ 8 for ≥3 months).
Literature-based differences between BD patients and HCs
Following the available literature, we expected lower overall motor activityReference St-Amand, Provencher, Bélanger and Morin7, 14–16, Reference Janney, Fagiolini, Swartz, Jakicic, Holleman and Richardson26 and also lower peak activityReference Gonçalves, Adamowicz, Louzada, Moreno and Araujo27 in BD patients vs HCs. Based on diminished adaptability to changes in circadian rhythm, lower rhythm robustness was expected.Reference Gonzalez, Suppes and Zeitzer28 Additionally, due to greater mood instability, higher fragmentation of activity profiles within a day and instability between days was expected, including higher variability in most of the actigraphy parameters, both motor activity based or time based.Reference Kaufmann, Gershon, Depp, Miller, Zeitzer and Ketter9
Reduction in sleep quality has been reported in BD patientsReference Scott13, Reference De Crescenzo, Economou, Sharpley, Gormez and Quested29; therefore, higher motor activity and longer awake or mobile periods were expected during night sleep. Further, since BD is associated with longer sleepReference Alloy, Ng, Titone and Boland1, Reference Geoffroy, Scott and Boudebesse4, Reference Millar, Espie and Scott6, Reference Ritter, Marx and Lewtschenko18, Reference Ng, Chung, Ho, Yeung, Yung and Lam30 (though some reports did not confirm this findingReference St-Amand, Provencher, Bélanger and Morin7, Reference Jones, Hare and Evershed14, Reference Kaplan, Talbot, Gruber and Harvey31), we expected sleep time to be longer and more variable. Moreover, since longer sleep latency is associated with BD,Reference Geoffroy, Boudebesse and Bellivier5, Reference Millar, Espie and Scott6, Reference Gershon, Thompson, Eidelman, McGlinchey, Kaplan and Harvey17, Reference Ritter, Marx and Lewtschenko18 we expected lower activity before sleep onset and greater activity (restless sleep [RSL]) after sleep onset, with higher variability in both sleep latency and RSL. Finally, BD is associated with later chronotype,Reference Alloy, Ng, Titone and Boland1, Reference Gershon, Kaufmann and Depp8, Reference Kaufmann, Gershon, Depp, Miller, Zeitzer and Ketter9 represented as a later activity peak and a later sleep midtime.
Variability measurements and primary objectives
This work is focused on motor activity and intraindividual temporal changes in motor activity during waking hours and during sleep. Motor activity was measured using a wrist-worn actigraphy device, an instrument specifically tailored for use in psychiatry (MINDPAX). Temporal variability is connected to changes in daily routine and in circadian rhythm synchronization. Temporal variability may, therefore, be a more straightforward way to measure the assumed triggers/predictors of BD symptomsReference Alloy, Ng, Titone and Boland1, Reference Milhiet, Etain, Boudebesse and Bellivier10 than a standard comparison of average activity levels. We also expected the variability measurements to be comparatively insensitive to basic differences in daily routine between BD patients and HCs.
Aims of the study were: (a) to evaluate the motor activity profiles of interepisode BD patients vs HCs, (b) to use machine learning to distinguish between BD patients and HCs using actigraphy-derived features with a focus on variability measurements, and (c) to evaluate the effect of employment status on the results (post hoc).
Data and Method
Participants
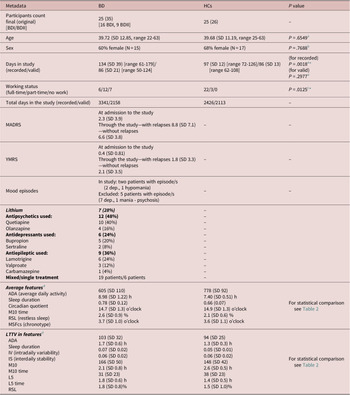
Actigraphy data were recorded for more than 90 days in 35 BD patients mainly with BD type I diagnosis, recruited from the outpatient BD clinic at the National Institute of Mental Health (NIMH), in Klecany, Czech Republic, and in 26 HCs, matched for age and sex, who were recruited by advertisement in the community. All BD patients underwent a baseline psychiatric examination by a trained institutional psychiatrist, confirming euthymic state or low levels of depressive/manic symptoms, using the Montgomery–Asberg Depression Rating Scale (MADRS)Reference Montgomery and Åsberg32 and the Young Mania Rating Scale (YMRS).Reference Young, Biggs, Ziegler and Meyer33 Inclusion criteria: all BD patients were diagnosed according to Diagnostic and Statistical Manual of Mental Disorders, fifth edition (DSM-5) criteria.34 At the study entry, all patients had to be euthymic or be in a remitted stateReference Tohen, Frank and Bowden35 (ie, YMRS ≤ 12 and MADRS ≤ 9, see Table 1) with no reported mood episodes for ≥ 60 days prior to study entry.
Demographic, Health and Activity Characteristics in Patients and Controls Groups

Abbreviations: ADA, average daily activity; BD, bipolar disorder; IS, interdaily stability; IV, intradaily variability; LTTV, long-term temporal variability; MADRS, Montgomery–Asberg Depression Rating Scale (MADRS); RSL, restless sleep; SD, standard deviation; YMRS, Young Mania Rating Scale.
a Mann–Whitney test.
b Fisher exact test.
c χ 2 test (Chi-square = 8.77).
d Selected features, for all see Supplementary Material.
* P < .05.
** P < .01.
*** P < .001.
Exclusion criteria for BD patients were the presence of an acute depressive episode, dysthymia, suicidal thoughts, a (hypo)manic episode or diagnosis of schizoaffective disorder at enrolment.
HC exclusion criteria were: past or acute presence of a moderate depressive or (hypo)manic episode or suicidal thoughts, diagnosed neurological, sleep or mood disorders, or a first-degree family history of mood or psychotic disorder among their first-order relatives.
The study was approved by the ethical committee of the NIMH, Czech Republic, and all BD patients and HCs signed written informed consent.
Procedure
On enrolment into the study, all participants answered a demographic questionnaire. The HC pool was contacted through an email screening questionnaire that asked for basic information (age, sex, and employment status) and family disease history (neurological: epilepsy, Parkinson’s disease, etc., sleep disorders: insomnia, sleep apnea, narcolepsy, etc.). Subjects who fulfilled the screening criteria were further evaluated using the M.I.N.I. structured questionnaireReference Lecrubier, Sheehan and Weiller36 for neuropsychiatric disorders.
All participants were equipped with a wrist-worn actigraphic monitoring device (MINDPAX) and were instructed to remove it only when necessary.
During follow-up (the period when the data were recorded), BD participants were assessed monthly by their treating psychiatrist via in-person visits and/or a telephone interview to identify their current psychiatric state. We allowed for some minor increase of symptoms during follow-up (ie, YMRS < 15 and MADRS < 15). The criteria for clinical episodes included psychiatric hospitalizations, work incapacity, MADRS ≥ 15, YMRS ≥ 15,Reference Macfadden, Alphs and Haskins37 suicidal ideation, and/or substantial deterioration of the patient’s clinical state. The relapse episodes were omitted from the data, and, thus, we used only patient data from interepisode periods, therefore, the results were not affected by motor activity changes due to clinical episodes. The rating scales were not used in any of the models. In order to reduce possible seasonal effects, the data were collected in both groups during a similar time period from December 2016 to May 2017.
Actigraphy data and feature extraction
The actigraphy wearable was set to capture motor activity aggregated over 30-second epochs. The data were transferred wirelessly through a base station at the subject’s home to a server for storage and offline evaluation. Missing data, detected wearable lay-off periods, and segments starting 1 week before and ending 1 week after an episode of mania or depression were excluded from the trait-focused analysis. Data from mood episodes (mania/depression) were excluded in order to minimize contamination of the data, which might lead to increased differences between BD patients and HCs. For feature estimation, 80% of valid samples within a given time frame were required; otherwise, they were marked as a missing value. All calculations were performed in local time, using weekends and national holidays as free days.
In order to perform the statistical and machine-learning analyses, we derived a set of standard features from the raw actigraphy recordings, based on cosinor, nonparametric and sleep analysis. All actigraphy features were calculated for each day, while a 7-day sliding time window was used for some features (see below). Chronotype and social jetlag (SJL) were estimated using the whole actigraphy recording.Reference Juda, Vetter and Roenneberg38
Circadian analysis
Cosinor analysisReference Gonzalez, Suppes and Zeitzer28, Reference Cornelissen39 estimated regular activity patterns by fitting a cosine function with a fixed 24-hour period. The resulting features are the acrophase (the time of the activity peak), the mesor (the offset of the fitted cosine function), the amplitude, the circadian quotient (CQ) (the amplitude and mesor ratio, that is, the robustness of the daily activity rhythm), and the goodness of fit (GOF) (the sum of absolute residuals from fitted cosine function).
Nonparametric analysisReference Jones, Hare and Evershed14, Reference Gonçalves, Adamowicz, Louzada, Moreno and Araujo27, Reference Witting, Kwa, Eikelenboom, Mirmiran and Swaab40 estimated activity patterns for each day, without assuming an underlying analytical function. The estimated features are M10 (average activity during the most active 10 hours), L5 (average activity during the least active 5 hours), timings of M10 and L5 (midwindow daytime), and RA (relative amplitude: (M10 − L5)/(M10 + L5)). Additional features estimated for each day include ADA (average daily activity) and AQA1–4 (average activity in quarters of a day).
The nonparametric features, based on the 7-day sliding window, were IV (intradaily variability, describing rhythm fragmentation) and IS (interdaily stability). For an estimate of IV and IS, the signal was aggregated into 20-minute segments, according to previously reported more favorable properties.Reference Gonçalves, Adamowicz, Louzada, Moreno and Araujo27
Sleep analysis
Sleep epochs were detected using the MINDPAX algorithm.Reference Vostatek41 To reduce overestimation of sleep duration (SDur) based on algorithmic analysis, as observed by Boudebesse et al.,Reference Boudebesse, Leboyer and Begley42 the results were manually checked and corrected. The distinction between sleep and wake time using actigraphy is generally considered reliable.Reference Kaplan, Talbot, Gruber and Harvey31, Reference Kosmadopoulos, Sargent, Darwent, Zhou and Roach43 The main SDur, that is, the longest SDur on a given day, with minor interruptions, was used for the analyses.
In order to cope with issues connected with sleep parameters requiring a sleep diary (eg, efficiency, latency), we decided to use actigraphy features only. The extracted features were SDur, sleep onset, sleep offset, midsleep (MS), RSL (the percentage of minutes within the main sleep, above preset inactivity threshold), and immobile parts of sleep (ISL: the percentage of minutes within the main sleep, below preset activity threshold), sleep instability (RMSSD: Root mean square of successive differences—based on raw actigraphy during detected sleep), and average activity 2 hours prior to sleep onset (APSO), and 2 hours after sleep onset (AASO).
Chronotype and social jetlag
Circadian chronotype and SJL are commonly evaluated by the Munich Chronotype Questionnaire (MCTQ),Reference Juda, Vetter and Roenneberg38 estimated as the mid-sleep on free days corrected for sleep debt on work days (MSFsc). In the analysis presented here, we estimated both MSFcs and SJL using actigraphy-derived sleep starts and sleep endsReference Santisteban, Brown and Gruber44 and calendar free days, using the whole follow-up period. The nonparametric M10 and L5 times were used for the LTTV evaluation.
Statistical analysis
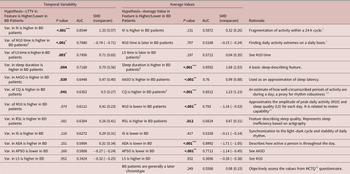
The LTTV and average values were calculated from all available daily values, using the standard deviation and the mean, respectively. Between-group statistical comparison was performed on an a priori selected subset of features (Table 2), based on the available literature.
Group Differences Between Patients and Controls

Significance after Holm’sReference Holm45 (n = 25) *P < .05, **P < .01, ***P < .001.
Abbreviations: AASO, activity 2 hours after to sleep onset; ADA, average daily activity; APSO, activity 2 hours prior to sleep onset; AUC, area under the curve; BD, bipolar disorder; CQ, circadian quotient; IS, interdaily stability; IV, intradaily variability; LTTV, long-term temporal variability; MCTQ, Munich Chronotype Questionnaire: RSL, restless sleep; SD, standard deviation; SMD, standardized mean difference.
‡tested using Wilcoxon rank-sum test (non-normally distributed data).
The features were checked for normality using Q–Q plots and were normalized on the basis of skewness and kurtosis (for details see Supplementary Material). When normality was not disproved in the transformed values (Jarque–Bera test, α = 5%), a student t test was used; otherwise, the Wilcoxon rank-sum test was used for non-normally distributed data. One-sided tests were used, based on an a priori hypothesis from the existing literature (“Literature-based differences between BD patients and HC” section). See the supplement for details on existing studies and feature normality. See the data processing scheme in Figure 1.
Preprocessing and machine-learning classification scheme. The left side shows the estimation of individual values (average and long-term temporal variability [LTTV]) from features, based on all valid days for each patient. In the right part, the machine-learning cross-validation process is shown, where the same number of bipolar disorder (BD) patients and healthy controls (HCs) is repetitively left out from the learning dataset for results.

The results were corrected for multiple comparisons using the HolmReference Holm45 procedure (n = 25). The corrected results are marked as “corr” after each result in the “Results” section. The effect size was calculated as the standardized mean difference (SMD). The area under the receiver operating characteristic (AUC) was computed to measure the classification power of individual actigraphy features.
All data processing and statistical analyses were conducted with Matlab 2015b, The MathWorks, Inc.
Classification
In order to illustrate the discriminatory power of the entire feature set combined (as opposed to the statistical analysis, which was aimed at individual features/biomarkers), we designed a set of classifiers for discriminating between BD patients and HCs. In total, we used three models differing by the features that were employed: (a) a model with all the features presented above, (b) a model based only on temporal variabilities, and (c) a model using only features with low dependency on employment status (see details below).
The models were trained using a random forest (RF) classifier,Reference Breiman46 commonly used for heterogeneous biomedical data including actigraphy,Reference Faedda, Ohashi and Hernandez24 and the out-of-sample performance was estimated using fivefold cross-validation. In each fold, data from 20 BD patients and 20 HC participants were used for training the classifier, the rest were used for evaluating the classification performance. In subsequent folds, the data from 5 + 5 different subjects were used for validation, until all patients were iterated. The entire fivefold procedure was repeated 100 times to estimate the uncertainty of the results, caused by the random division of the patients into folds and random feature selection in RF. See the supplement for more details on RF structure and evaluation. See the data processing scheme in Figure 1.
Post hoc analysis of employment status
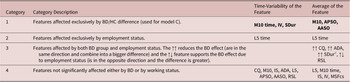
An analysis of the classification results revealed a strong association between the misclassification of individual subjects and employment status. We, therefore, investigated the association between employment status, group membership (BD patients or HCs), and individual actigraphy feature values. A set of linear models was built that the parameter value was a linear combination of BD patients/HC group status, employment status, and intercept:
 $$ \mathrm{feature}\sim 1+\mathrm{BD}/\mathrm{HC}+\mathrm{employment}\ \mathrm{status}. $$
The model was fitted using a least-square means approach with robust bi-square weights, and the significance of the coefficient values was evaluated using standard T-statistic. Based on the results, the identified features independent of employment status were used for training classification model C.
Results
Subject characteristics
The BD patients and HC group characteristics, after exclusions, are shown in Table 1. Ten (29%) of the 35 BD patients enrolled in the study were excluded: five subjects were excluded due to insufficient length of recorded interepisode data (≤50 days—four for depression episodes and one for psychosis after childbirth), four for an excessive amount of missing actigraphy data (due to wearable removal or malfunction of the wearable device), and one resigned from the study upon personal request, resulting in 25 DB patients in the final set. All of the subjects were attending a standard BD treatment program and were using clinician’s choice medication. Among 26 HCs, one subject was excluded due to an excessive amount of missing data, resulting in 25 HCs in the final set. The HC set was recruited after the BD set, when deterioration in the same patient’s state was observed. A lower dropout rate in HCs was expected.
Statistical comparison
In terms of LTTV, compared with HCs, BD patients showed significantly greater variation in the IV feature (t(48) = −4.71, P corr = .0005, AUC = 0.85), greater variability in the activity-peak-time (M10-time; z = 3.24, P corr = .0107, AUC = 0.77), and greater variability in the L5 time (t(48) = −2.88, P corr = .0500, AUC = 0.75). In the IS feature, the variability had higher predictive capacity than the mean value (both nonsignificant). For actual differences, see Table 1, and for effect sizes see, Table 2.
When evaluating individual averages (Tables 1 and 2), compared to HCs, BD was associated with lower ADA (t(48) = 6.06, P corr < .0001, AUC = 0.90), longer sleep duration (z = −4.35, P corr = .0002, AUC = 0.86), and lower CQ (z = −4.25, P corr = .0002, AUC = 0.85). However, in some features, mainly the overall averages, the observed differences were highly associated with BD employment status. For more details and posthoc analysis on the effect of employment status, see “Effect of employment status” section.
Classification of BD and HCs
The full actigraphy-based model (model A) was successful in distinguishing between people with interepisode BD and HCs. Accuracy was around 88% with specificity 91%—see Table 3.
Random Forest Classifier Model Results in Participants Whose Data Were Not Used During Model Training

Abbreviations: SD, standard deviation; BD, bipolar disorder.
a The number of bipolar disorder (BD) patients working full-time was 6 (therefore, 1 patient corresponds to 16.7%) part-time working n = 12 (1 patient ~ 8.3%) and unemployed n = 7 (1 patient ~ 14.3%).
When only time variability of the actigraphy features were used (model B), the classification accuracy dropped, mainly due to a higher HC misclassification rate (ie, a drop in specificity). The accuracy drop in the B model was apparently also due to the removal of the strongest feature, which was the average SDur (BD 8.97 ± 1.22 hours vs HC 7.40 ± 0.51—this corresponds to adult sleep duration).Reference Roenneberg, Kuehnle and Juda47 Most of the misclassifications were in full-time-/part-time-working BD patients (see the last column in Table 3). For model A, in the working patients, 1.7 out of 6 were on average misclassified; in the part-time-working patients, 2.1 out of 12 were misclassified, while there were no misclassifications in the unemployed/pensioned patients. For model B, 0.2 out of 7 unemployed/pensioned patients were misclassified. (For model C, which uses features that do not show dependency on employment status, see “Effect of employment status” section.)
Based on the out-of-bag estimation (see Supplementary Material), we assessed the importance of each feature in the classification task. Figure 2 shows features ordered by their average classification strength, depicting their approximate effect sizes based on model A. Models B and C differ by not including the unused features (the order of classification strength does not change).
All features used in classification the (Model A) ordered by their classification strength, showing the effect size for each feature (non-normalized data), LTTVs in blue, average values in orange, and global features in gray. The effect size (with a 95% confidence interval) is an approximation because the distribution was not always normal. The grey diamond shows the effect size estimated by the median values and shows how precise the blue approximation is.

Effect of employment status
Using linear models, we identified four types of features based on their association with employment status (see Table 4). We trained a new random forest distinguishing BD patients and HCs, using exclusively the variables that were most affected by the BD patients/HC group difference and not by employment status. Model C, which used only type 1 features LTTV in M10 time, IV, and SDur and averages of M10, and activities prior and after sleep onset reached 78.7% accuracy, for details see Table 3—model C.
Categories of Features Based on Employment Status Effects

Abbreviations: AASO, activity 2 hours after sleep onset; ADA, average daily activity; APSO, activity 2 hours prior to sleep onset; BD, bipolar disorder; CQ, circadian quotient; HC, healthy control; IS, interdaily Sstability; IV, intradaily Vvariability; RSL, restless sleep; SDur, sleep duration.
a For sleep duration, the effect of the disease is twice as strong, resulting in the finding that even working BD patients differed significantly from HCs.
Discussion
This study shows that a machine-learning model using only actigraphic recording was capable of distinguishing between interepisode BD patients and HCs with 88% accuracy on the test data. In addition, when the effect of working status was suppressed by empirically derived feature selection, our results indicated that actigraphic data on motor activity patterns in BD may contain a clinically informative and scalable biosignal that differentiates between BD patients and HCs. In an article, Ortiz et al.Reference Ortiz, Bradler and Hintze48 used machine learning for forecasting a clinical episode based on patient-perceived energy during the evening. The motor activity is associated with future mood and energyReference Merikangas, Swendsen and Hickie11; therefore, long-term actigraphy may be promising for relapse forecasting.
When compared to existing actigraphy-based machine-learning studies Krane-Gartiser et al.Reference Krane-Gartiser, Scott and Nevoret25 and Faedda et al.,Reference Faedda, Ohashi and Hernandez24 our model using all features is more accurate than both. When only features with low dependency on employment status are used, the results are slightly better than the results by Krane-Gartiser (acc. 79% vs 78%) and lower than Faedda’s (acc. 83%) with higher sensitivity (76% vs 64%) and lower specificity (81% vs 92%). These results have to be considered bearing in mind that our remission criteria were more lenient than in the Krane-Gartiser paper, whose dataset was matched for employment status. Faedda used children with a similar daily regimen (school) and without any medication treatment but also cleaned noisy data based on additional information obtained from parents. In addition to actigraphy, the Krane-GartiserReference Krane-Gartiser, Scott and Nevoret25 employed MADRS as an additional predictor variable as well. Post hoc analyses demonstrated that the inclusion of this psychopathology score contributed critically to the overall efficacy of the model. When MADRS was excluded, the accuracy-based selectively on motor activity dropped to 70%,Reference Krane-Gartiser, Scott and Nevoret25 which is lower than our results.
Matching the BD patients and HC groups based on employment status, Krane-Gartiser et al.Reference Krane-Gartiser, Scott and Nevoret25 reduced the confounding effect of differences in social engagement. This approach has been substantiated by the identification of employment status as a significant confounder. The fact that HCs are typically employed and, at the same time, many BD patients are either unemployed or pensioned, may itself introduce a significant bias, due to the systematic effect of the dissimilar social clock and demands in the two groups. To address this problem at least partially, some studies have used shift work as an exclusion criterion.Reference Millar, Espie and Scott6, Reference St-Amand, Provencher, Bélanger and Morin7, Reference Bullock and Murray49 Only a small number of actigraphy studies have attempted to match HCs on employment status.Reference Jones, Hare and Evershed14, Reference Gershon, Thompson, Eidelman, McGlinchey, Kaplan and Harvey17, Reference Krane-Gartiser, Scott and Nevoret25, Reference Gershon, Ram, Johnson, Harvey and Zeitzer50 Unfortunately, even using age-matched HC groups with a similar rate of unemployment may introduce a different type of bias,Reference Millar, Espie and Scott6 due to the reasons causing a healthy person of productive age to be unemployed.
To control specifically for these potential biases, we identified and modeled a set of actigraphic features with low dependency on employment status and possibly also other aspects affecting motor activity during the day, such as family status and type of employment. The contribution of these different factors to the BD-specific characteristics of motor activity patterns is beyond the presented dataset and has to be evaluated in a separate study. According to our analysis, LTTV in interdaily variability feature, LTTV in M10 time, LTTV in SDur and average M10, and average activity before sleep onset and after sleep onset fulfil these requirements. In a post hoc analysis, the model incorporating exclusively features with low dependency on employment status achieved predictive accuracy of 79% in discriminating between BD patients and HCs.
Long-term temporal variability
Recent evidence suggests that not only previously reported changes in the sleep and activity of BD patients but also, in particular, the temporal variability of these parameters may be a disease-specific trait marker.Reference Shou, Cui and Hickie51 Despite this promising report, only a few studies have been able to specifically address time variation features in actigraphy. The reasons for this situation are mainly technical, as the analysis typically requires long-term continuous actigraphy. These limited number of studies found for BD: (a) increased standard deviation and RMSSD in actigraphy,Reference Krane-Gartiser, Henriksen, Morken, Vaaler and Fasmer22 (b) a positive correlation between mood variability and variability in activity,Reference Carr, Saunders and Tsanas52 and (c) greater variability in afternoon activity (BDI) and in nighttime activity (BDII), without differences in peak time variation,Reference Shou, Cui and Hickie51 but (d) greater variability in peak activity time.Reference Kaufmann, Gershon, Depp, Miller, Zeitzer and Ketter9 For a review of variability in actigraphy, see Bei.Reference Bei, Wiley, Trinder and Manber21
Consistently, our analysis of the long-term time variability of actigraphy and sleep features revealed a significantly higher variability in the IV feature and in day-peak and day-trough activity times (M10 time and L5 time) in BD patients vs HCs. In sleep features, we observed a difference in SDur time variability (although not significant after correcting for multiple comparisons P < .1, see the limitation of the power analysis in the Supplementary Material).
Average actigraphy and sleep
As in previous studies, a lower overall activity (ADA) and flattening in rhythmicity (CQ) were detected in BD patients vs HCs. Lower activity is a widely reported trait-marker of BD, even in remitted cases.Reference St-Amand, Provencher, Bélanger and Morin7, 14–16, Reference McKenna, Drummond and Eyler19, Reference Janney, Fagiolini, Swartz, Jakicic, Holleman and Richardson26, Reference Bullock and Murray49, Reference Grierson, Hickie, Naismith, Hermens, Scott and Scott53 Unfortunately, ADA also showed significant dependency on employment status. A lower daily activity peak was observed by prior studies,Reference McKenna, Drummond and Eyler19, Reference Grierson, Hickie, Naismith, Hermens, Scott and Scott53 where it was connected with worsening of the disease.
In contrast to previous studies,Reference Alloy, Ng, Titone and Boland1, Reference Kaufmann, Gershon, Depp, Miller, Zeitzer and Ketter9, Reference Scott13 we did not observe a between-group difference in chronotype based on motor activity, although all subjects were evaluated at approximately the same time of year. Similarly, we did not observe any later activity onset in BD patients vs HCs, as had been observed previously.Reference Kaufmann, Gershon, Depp, Miller, Zeitzer and Ketter9, Reference Salvatore, Ghidini and Zita15, Reference Gershon, Ram, Johnson, Harvey and Zeitzer50, Reference Shou, Cui and Hickie51, Reference Grierson, Hickie, Naismith, Hermens, Scott and Scott53
Prolonged SDur (in our study for >1 hour) has been observed by someReference Geoffroy, Boudebesse and Bellivier5, Reference Millar, Espie and Scott6, Reference Ritter, Marx and Lewtschenko18 but not other studies.Reference St-Amand, Provencher, Bélanger and Morin7, Reference Jones, Hare and Evershed14, Reference Gershon, Thompson, Eidelman, McGlinchey, Kaplan and Harvey17 It is possible that the observed difference may be caused (a) by persistent subdepressive symptoms because even between-episodes BD patients show more depression-related symptoms,Reference Geoffroy, Boudebesse and Bellivier5, Reference Judd54 (b) by medication, whereby especially atypical antipsychotics are related to hypersomnia,Reference Ng, Chung, Ho, Yeung, Yung and Lam30 and/or (c) by the difference in employment status, as already has been mentioned.
Other commonly observed differences in BD are lower sleep efficiencyReference Millar, Espie and Scott6, Reference Harvey, Schmidt, Scarnà, Semler and Goodwin16 and prolonged sleep latency.Reference Geoffroy, Boudebesse and Bellivier5, Reference Millar, Espie and Scott6, Reference Gershon, Thompson, Eidelman, McGlinchey, Kaplan and Harvey17, Reference Ritter, Marx and Lewtschenko18 These values cannot be estimated without the use of sleep diaries or patient markings of sleep time, which were not collected in our study. Our fully automatic approximation of these features are RSL, for sleep efficiency, and decline in activity on sleep onset, measured by APSO and AASO, for sleep latency. The between-group difference in RSL was not significant after corrections for multiple comparisons. Further, a slower decline in activity was observed in BD vs HCs during sleep onset was observed (APSO was lower and AASO was higher in BD patients vs HCs).
Limitations
Results of this study need to be interpreted considering the following limitations. First, the relatively small sample size can reduce the power of the statistical tests (see the Supplementary Material for a power analysis). Although the sample size was small, it is in line with many previous actigraphy studies, each of which had a much shorter follow-up duration than our 90-day period.
Second, we had a relatively high dropout/exclusion rate of about 29% in BD patients, due to loss of interest in participating in the study, occurrence of a relapse, or due to technical difficulties. However, a comparable dropout rate is not exceptional in this type of study. For example, Krane-Gartiser et al.Reference Krane-Gartiser, Scott and Nevoret25 had a dropout rate of 54% in the BD patients group, as a consequence of very strict exclusion criteria.
Third, BD patients and HCs were not matched for employment status. There are reasons that might cause unemployment in “healthy” productive age individuals. However, contaminating the HC group with the risk of morbidity might add a different type of bias as the oversampling employed BD patients. To address this issue, we did not select the sample on the basis of employment status. Instead, we conducted a sensitivity analysis, creating a model, whereby actigraphy features that were highly correlated with employment status were removed, showing the robustness of our discrimination/prediction models.
Fourth, all BD patients should have been using their prescribed medication. There are reported effects of medication on sleep,Reference Monti55 and effects on activity can also be expected, although Jones et al.Reference Jones, Hare and Evershed14 stated that “no evidence was found for a significant association between medication use and any of the circadian activity measures” and Shou et al.Reference Shou, Cui and Hickie51 did not observe any association between psychotropic medication and levels of activity. It has been shown that mood stabilizers can affect several circadian parameters.Reference Hwang, Choi, Kang, Hwang, Kim and Lee56 The assumed major mechanism is through the regularization (normalization) of the sleep and circadian rhythm as it has been shown for lithium (seven patients in our study) and valproate (three patients in our study).Reference Geoffroy, Boudebesse and Bellivier5 Considering the combination of medications, Gonzalez et al.Reference Gonzalez, Suppes and Zeitzer28 observed that individual medication type (mood stabilizers, antidepressants, antipsychotics, etc.) had higher association with motor activity changes than the number of medications from each type. The medications may nonetheless impact the results and therefore present a limitation of the study. However, withdrawal from medication during the follow-up period is unjustified due to the risk of relapse and related ethical issues.
Fifth, the BD subjects were not fully euthymic, and residual symptoms may have affected the results. Our relapse threshold allowed the presence of subclinical symptoms in the examined sample, for example, residual depression.Reference Judd54 Monthly clinical assessments may also miss, or may underestimate, briefer but clinically relevant mood shifts.
Sixth, there are findings of high prevalence of comorbidities in BD.Reference Hossain, Mainali, Bhimanadham, Imran, Ahmad and Patel57 Although many are hard to distinguish from symptoms of BP itself (sleep disorders, anxiety disorders, borderline personality disorder), there are other diseases that have higher prevalence in the BD group such as drug/alcohol abuse, asthma, hypothyroidism migraine, etc., which may also affect circadian rhythm and motor activities throughout the day. These were not matched with the HC group and thus present a possible confounder and a limitation of the study.
Finally, we did not include patients with psychiatric disorders other than BD in order to evaluate the degree to which the identified actigraphic biosignature is specific to BD or is more globally a marker of mental illness. Thus, future studies should include psychiatric control groups to investigate this issue.
Conclusions
There are significant differences in activity patterns between BD patients and HCs. A clinically applicable, cost-effective, and scalable classifier-based approach was able to distinguish BD patients from HCs with approximately 88% accuracy, which is better than previous studies by a large margin. Some of the strongest discriminants, for example, ADA and SDur, could be closely associated with differences in employment status and also with differences in the use of medications. The time variance in some features (intradaily variability, peak activity time, SDur) showed lower dependency on employment status and may therefore be a preferable actigraphy biomarker candidate. When only features that are less dependent on employment status were used, the model was still able to distinguish BD patients from HCs with approximately 79% accuracy, which is still comparable with the best results obtained by other groups.Reference Faedda, Ohashi and Hernandez24, Reference Krane-Gartiser, Scott and Nevoret25 Future studies are needed in order to identify actigraphy features that are global trait-markers of mental illness from those that are more specific to BD and, eventually, to identify features (state-markers) that may be associated with an impending relapse.
Financial support
The research presented here was supported by the Ministry of Health of the Czech Republic (grant number IGA NT 14387). The work at NIMH was supported by the Ministry of Education Youth and Sports of the Czech Republic (project number LO1611—NPU I program). The work of JS has been supported by the student grant agency of the Czech Technical University in Prague (grant number SGS19/171/OHK3/3 T/13). The sponsors of the study had no role in the design or conduct of this study; in the collection, management, analysis, and interpretation of the data; or in the preparation, review, or approval of the manuscript.
Disclosures
The authors, Ing. Jakub Schneider, Ing. Eduard Bakštein, PhD., Ing. Pavel Vostatek, PhD., and doc. Ing. Daniel Novák, PhD. are associated, as consultants, advisors and/or data analysts, with MINDPAX, the company that focuses on management of bipolar and schizophrenia disorder and mental health data analyses. The companies that Dr. Correll has been a consultant and/or advisor to, or has received honoraria from: Alkermes, Allergan, Angelini, Boehringer-Ingelheim, Gedeon Richter, Gerson Lehrman Group, Indivior, IntraCellular Therapies, Janssen/J&J, LB Pharma, Lundbeck, MedAvante-ProPhase, Medscape, Merck, Neurocrine, Noven, Otsuka, Pfizer, Recordati, Rovi, Servier, Sumitomo Dainippon, Sunovion, Supernus, Takeda, and Teva. He has provided expert testimony for Bristol-Myers Squibb, Janssen, and Otsuka. He served on a Data Safety Monitoring Board for Boehringer-Ingelheim, Lundbeck, Rovi, Supernus, and Teva. He received royalties from UpToDate and grant support from Janssen and Takeda. He is also a shareholder in LB Pharma.
Authorship Contributions
All authors met the ICMJE criteria for authorship. Especially, J.S., E.B., F.S., and D.N. contributed to the design of the study. J.S., E.B., and P.V. contributed to the statistical analysis and checking the integrity of the data. J.S., M.K., and F.S. contributed to data collection. J.S., E.B., M.K., F.S., and C.C., contributed to the interpretation of the results. All authors contributed to writing the manuscript and approved the final version.
Supplementary Materials
To view supplementary material for this article, please visit http://dx.doi.org/10.1017/S1092852920001777.