1. Introduction
The Indian subcontinent is amongst the most densely populated regions of the world, and the monsoon is the lifeline of a majority of people residing in the Indian subcontinent. The agriculture on the Indian subcontinent largely depends on monsoon precipitation. Hence, a change in monsoon intensity and distribution severely affects the Indian subcontinent (Gadgil, Reference Gadgil2003). The Indian monsoon system has a distinct summer and winter phase. The summer monsoon brings the bulk of the precipitation on the Indian subcontinent (Webster et al. Reference Webster, Magaña, Palmer, Shukla, Tomas, Yanai and Yasunari1998). The strong winds during the summer monsoon season also cause extensive upwelling, especially in the western Arabian Sea (Izumo et al. Reference Izumo, Montegut, Luo, Behera, Masson and Yamagata2008). The cold, nutrient-rich upwelled water enhances surface productivity in the western as well as the northern Arabian Sea. Additionally, very high productivity is also observed during the late winter monsoon season in the northeastern Arabian Sea, making it one of the most productive regions of the world (Banse & McClain, Reference Banse and McClain1986; Madhupratap et al. Reference Madhupratap, Prasannakumar, Bhattathiri, Kumar, Raghukumar, Nair and Ramaiah1996). The very high surface productivity modulates dissolved oxygen concentration and is one of the major factors responsible for the perennial intermediate depth oxygen minimum zone in the Arabian Sea (Naqvi, Reference Naqvi1991). The oxygen minimum zones are the main drivers of the global nitrogen cycle, and any change in its intensity and extent severely affects the marine biota (Levin et al. Reference Levin, Gage, Martin and Lamont2000). Recent studies, based on instrumental data, suggest a contrasting response of the monsoon and associated biological productivity to global warming (Gomes et al. Reference Gomes, Goes, Matondkar, Buskey, Basu, Parab and Thoppil2014; Roxy et al. Reference Roxy, Modi, Murtugudde, Valsala, Panickal, Prasanna Kumar, Ravichandran, Vichi and Lévy2016). Therefore, it is important to understand the factors governing both the summer and winter phases of the Indian monsoon and associated changes in marine productivity. The sediments deposited in the northeastern Arabian Sea can, therefore, help to understand factors affecting seasonal changes in the monsoon, especially during contrasting palaeo-boundary conditions.
The strong seasonal changes in surface hydrographic conditions in the northeastern Arabian Sea affect the marine biota. The remains of organisms, especially planktonic foraminifera, respond well to the seasonally changing hydrographic conditions (Bé & Hutson, Reference Bé and Hutson1977; Kroon, Reference Kroon, Brummer and Kroon1988) and thus can be used to reconstruct past hydrographic conditions. The monsoon variability and its influence on marine productivity in the eastern Arabian Sea has been studied by various workers (Naidu & Malmgren, Reference Naidu and Malmgren1996; Gupta et al. Reference Gupta, Anderson and Overpeck2003, Reference Gupta, Mohan, Sarkar, Clemens, Ravindra and Uttam2011 Chodankar et al. Reference Chodankar, Banakar and Oba2005; Tiwari et al. Reference Tiwari, Ramesh, Somayajulu, Jull and Burr2005; Anand et al. Reference Anand, Kroon, Singh, Ganeshram, Ganssen and Elderfield2008; Nigam et al. Reference Nigam, Prasad, Saraswat, Garg, Mazumder and Henriques2009; Banakar et al. Reference Banakar, Mahesh, Burr and Chodankar2010; Govil & Naidu, Reference Govil and Naidu2010; Singh et al. Reference Singh, Jung, Darling, Ganeshram, Ivanochko and Kroon2011; Naik et al. Reference Naik, Naidu, Foster and Martínez-Botí2015, Reference Naik, Saraswat, Lea, Kurtarkar and Mackensen2017; Tripathi et al. Reference Tripathi, Tiwari, Lee, Khim, Pandey, Clift, Kulhanek, Ando, Bendle, Aharonovich, Griffith, Gurumurthy, Hahn, Iwai, Kumar, Kumar, Liddy, Lu, Lyle, Mishra, Radhakrishna, Routledge, Saraswat, Saxena, Scardia, Sharma, Singh, Steinke, Suzuki, Tauxe, Xu and Yu2017). Several factors, including regional seawater temperature, ice sheet extent in the northern and southern polar regions, and ocean–atmospheric processes in the equatorial Pacific Ocean affect the Indian monsoon (Clemens et al. Reference Clemens, Prell, Murray, Shimmield and Weedon1991; Webster et al. Reference Webster, Magaña, Palmer, Shukla, Tomas, Yanai and Yasunari1998; Gadgil, Reference Gadgil2003; Clift & Plumb, Reference Clift and Plumb2008). The monsoon also responds to orbital variability, and the relationship is often attributed to high-latitude climatic variations (Sirocko et al. Reference Sirocko, Garbe-Schönberg, McIntyre and Molfino1996; Schulz et al. Reference Schulz, von Rad and Erlenkeuser1998; Kudrass et al. Reference Kudrass, Hofmann, Doose, Emeis and Erlenkeuser2001; Gupta et al. Reference Gupta, Anderson and Overpeck2003; Clemens et al. Reference Clemens, Prell and Sun2010). The summer monsoon was weaker during the last glacial interval and the winter monsoon was relatively stronger (Tiwari et al. Reference Tiwari, Ramesh, Somayajulu, Jull and Burr2005; Gupta et al. Reference Gupta, Mohan, Sarkar, Clemens, Ravindra and Uttam2011; Saraswat et al. Reference Saraswat, Lea, Nigam, Mackensen and Naik2013). The abrupt decrease in productivity in the northeastern Arabian Sea during glacial cold intervals (Singh et al. Reference Singh, Jung, Darling, Ganeshram, Ivanochko and Kroon2011) suggests a strong link between temperature, the monsoon and productivity. The glacial–interglacial change in productivity is, however, regionally inconsistent (Naik et al. Reference Naik, Saraswat, Lea, Kurtarkar and Mackensen2017).
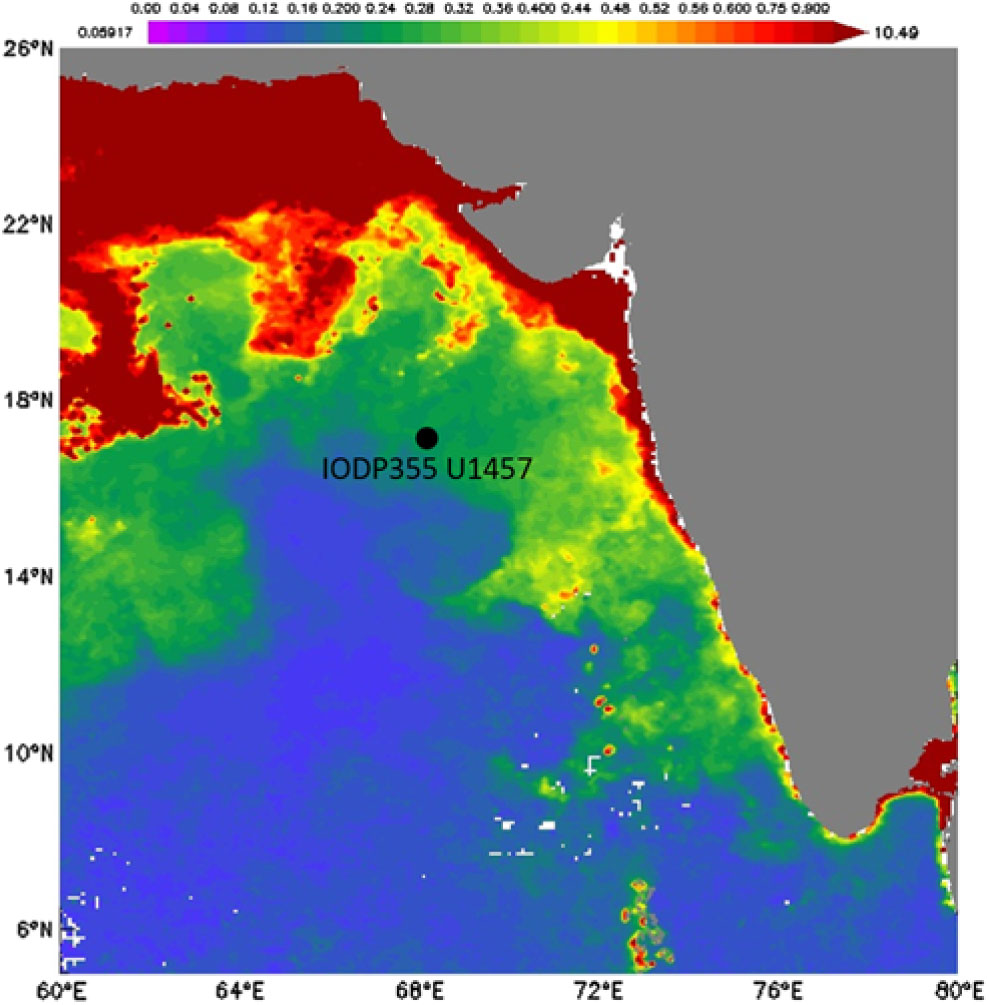
A majority of these studies covered only a part of the last glacial–interglacial interval. Therefore, we used the sediments from the holes drilled during the International Ocean Discovery Program Expedition 355 (IODP355 Site U1457) (Pandey et al. Reference Pandey, Clift, Kulhanek, Andò, Bendle, Bratenkov, Griffith, Gurumurthy, Hahn, Iwai, Khim, Kumar, Kumar, Liddy, Lu, Lyle, Mishra, Radhakrishna, Routledge, Saraswat, Saxena, Scardia, Sharma, Singh, Steinke, Suzuki, Tauxe, Tiwari, Xu, Yu, Pandey, Clift and Kulhanek2016) (Fig. 1) to reconstruct the surface hydrographic conditions of the eastern Arabian Sea during the past 350 kyr covering the last four glacial–interglacial transitions.
Location of Site U1457, cored during IODP Expedition 355 in the northeastern Arabian Sea, is marked by a black filled circle. The background is chlorophyll concentration (mg/m3) during March, when the highest productivity is observed at the drill site during the later phase of the winter monsoon season.

2. Regional setting
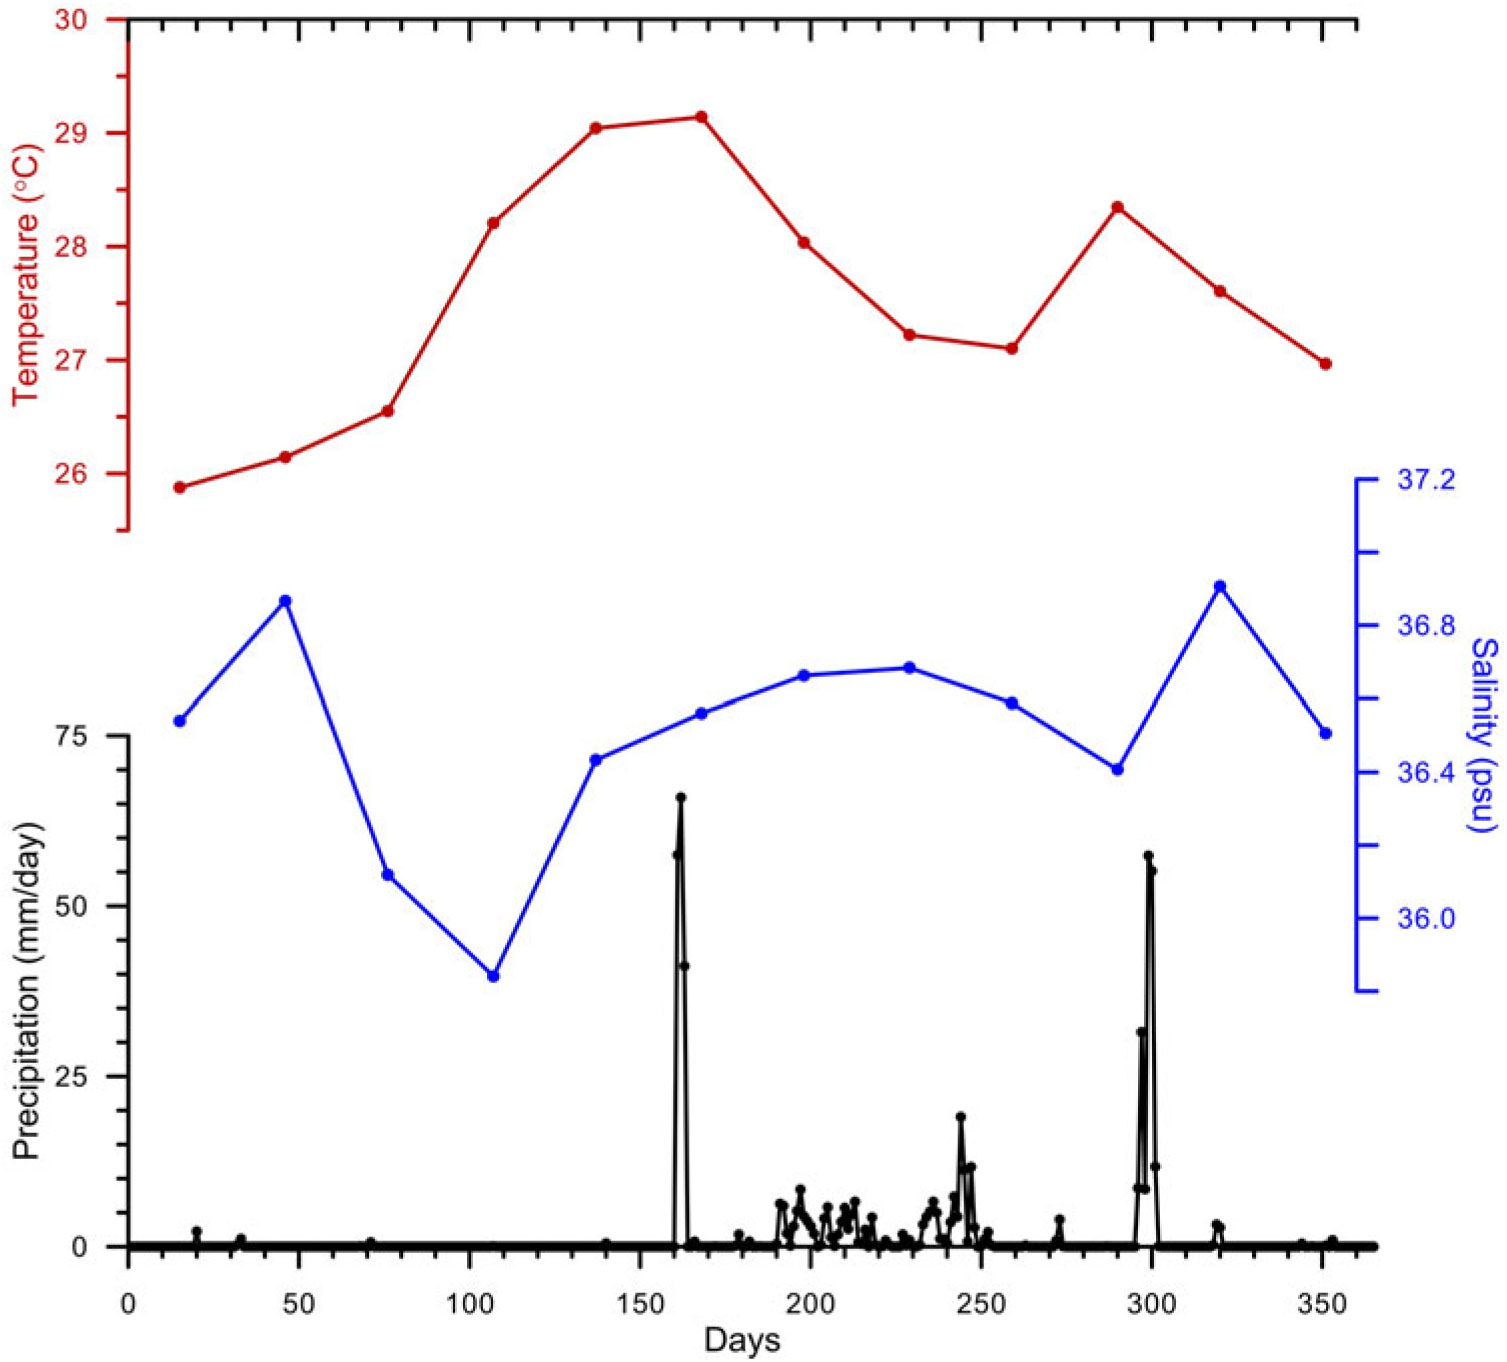
The eastern Arabian Sea is unique as it is influenced by both the summer and winter monsoons. The advection of upwelled water during the summer monsoon season and convective mixing during the winter monsoon affects the northeastern Arabian Sea, making it one of the most biologically productive oceanic regions (Madhupratap et al. Reference Madhupratap, Prasannakumar, Bhattathiri, Kumar, Raghukumar, Nair and Ramaiah1996; Prasanna Kumar et al. Reference Prasanna Kumar, Ramaiah, Gauns, Sarma, Muraleedharan, Raghukumar, Dileep Kumar and Madhupratap2001). The high productivity during the late winter is modulated by predominantly dry northeasterly winds, which cool the surface, and the subsequent convection increases nutrient availability in the mixed layer (Madhupratap et al. Reference Madhupratap, Prasannakumar, Bhattathiri, Kumar, Raghukumar, Nair and Ramaiah1996). The region receives huge freshwater (100 km3/yr) and sediment (100 × 106 t/yr) influx from the glacier-fed Indus River (Karim & Veizer, Reference Karim and Veizer2002). The Narmada (24 km3/yr water and 34 × 106 t/yr sediments) and Tapti, the two major westward-flowing rivers of India, also drain into the northeastern Arabian Sea (Gupta & Chakrapani, Reference Gupta and Chakrapani2005). The high primary productivity and restricted ventilation results in a perennial intermediate depth oxygen minimum zone, a distinct feature of the northeastern Arabian Sea (Naqvi, Reference Naqvi1991). The monsoon also modulates the seawater temperature and salinity. The warmest sea surface temperature (SST) (29.14 °C) is in the pre-summer monsoon season and the coldest (25.88 °C) is during the winter (Locarnini et al. Reference Locarnini, Mishonov, Antonov, Boyer, Garcia, Baranova, Zweng, Paver, Reagan, Johnson, Hamilton, Seidov, Levitus and Mishonov2013). The sea surface salinity varies from a minimum of 35.84 psu (practical salinity unit) during the pre-summer season to a maximum of 36.87 psu during the month of February (Fig. 2) (Zweng et al. Reference Zweng, Reagan, Antonov, Locarnini, Mishonov, Boyer, Garcia, Baranova, Johnson, Seidov, Biddle, Levitus and Mishonov2013). The surface water flow is mainly equatorward during the summer monsoon season and reverses to become poleward during the winter. The surface currents bring high saline Red Sea and Persian Gulf water into the northeastern Arabian Sea during the summer monsoon season. The surface currents are driven by seasonal wind reversal (Shankar et al. Reference Shankar, Vinayachandran and Unnikrishnan2002). The seasonally reversing winds also modulate the mixed layer depth, being >100 m during the winter and decreasing to <10 m during the inter-monsoon season (Banse, Reference Banse, Haq and Milliman1984). The pre-summer monsoon weak winds and increased insolation form a highly stratified water column in the northeastern Arabian Sea with a very thin mixed layer (Madhupratap et al. Reference Madhupratap, Prasannakumar, Bhattathiri, Kumar, Raghukumar, Nair and Ramaiah1996).
The monthly sea surface temperature (SST) and salinity (SSS) at the drilled site. A large difference is observed in SST as well as SSS during different months. The precipitation is mainly during the summer monsoon season.

Site U1457 was drilled on the western edge of the Lakshmi Basin, along the western margin of India. The site is on the distal margin of the Indus fan, ∼750 km away from the modern Indus River discharge region. The studied section of Site U1457 lies in the topmost part of Unit 1, comprising foraminifera-rich nannofossil ooze interbedded with silty clay and silty sand. The sediments are characteristic of the intermediate to very deep-water environment. Unit 1 is dominated by pelagic deposits with a lesser contribution from clastic sediments, indicating increased productivity and reduced clastic input (Pandey et al. Reference Pandey, Clift, Kulhanek, Andò, Bendle, Bratenkov, Griffith, Gurumurthy, Hahn, Iwai, Khim, Kumar, Kumar, Liddy, Lu, Lyle, Mishra, Radhakrishna, Routledge, Saraswat, Saxena, Scardia, Sharma, Singh, Steinke, Suzuki, Tauxe, Tiwari, Xu, Yu, Pandey, Clift and Kulhanek2016).
3. Materials and methodology
A total of 224 samples from the top ∼20 m spliced section of IODP Site U1457 (17° 9.95′ N, 67° 55.80′ E, water depth 3534 m) (Fig. 1) were processed following the standard procedure for processing of sediments for foraminiferal studies (Naik et al. Reference Naik, Saraswat, Lea, Kurtarkar and Mackensen2017). An appropriate aliquot of sediment was freeze-dried, weighed and soaked overnight. The soaked sediments were wet-sieved using a 63 µm sieve. The residue retained on the sieve (>63 µm, coarse fraction) was dried, weighed and stored in plastic vials. A part of the coarse fraction was dry-sieved using a 125 µm sieve. A representative aliquot of the fraction >125 µm was taken after coning and quartering, weighed and uniformly spread in a tray to pick planktonic foraminifera (a minimum of 300 specimen) from each sample using a stereo-zoom microscope (Olympus SZX12). Additionally, a part of the coarse fraction was dry-sieved using 250 µm and 350 µm sieves. A total of 40–50 specimens of the surface-dwelling planktonic foraminifera Globigerinoides ruber (white variety) were picked from the 250 to 350 μm size fraction. For stable oxygen isotopic analysis (δ18O), 10–15 clean specimens of G. ruber from the 250 to 350 μm size fraction were used. The stable isotopic ratio was measured at the Alfred Wegener Institute for Polar and Marine Research, Bremerhaven, Germany, using a Finnigan MAT 253 isotope ratio gas mass spectrometer, coupled to an automated carbonate preparation device (Kiel IV) and calibrated via NBS 19 to the Vienna Pee Dee Belemnite (VPDB) scale. The precision of δ18O was better than 0.08 ‰ based on the repeat analysis of an in-house standard (Solnhofen limestone) measured with the samples over a one-year period. To understand the effect of regional processes, δ18OG. ruber was converted to seawater oxygen isotopic ratio (δ18Osw) using the low-light palaeotemperature equation (Bemis et al. Reference Bemis, Spero, Bijma and Lea1998) and SST as estimated for the core MD90-0963 collected from the southeastern Arabian Sea (Tachikawa et al. Reference Tachikawa, Sépulcre, Toyofuku and Bard2008). The ice-volume contribution (Waelbroeck et al. Reference Waelbroeck, Labeyrie, Michel, Duplessy, McManus, Lambeck, Balbon and Labracherie2002) was then removed and the corrected data (δ18Osw-ivc) was plotted.
4. Chronology
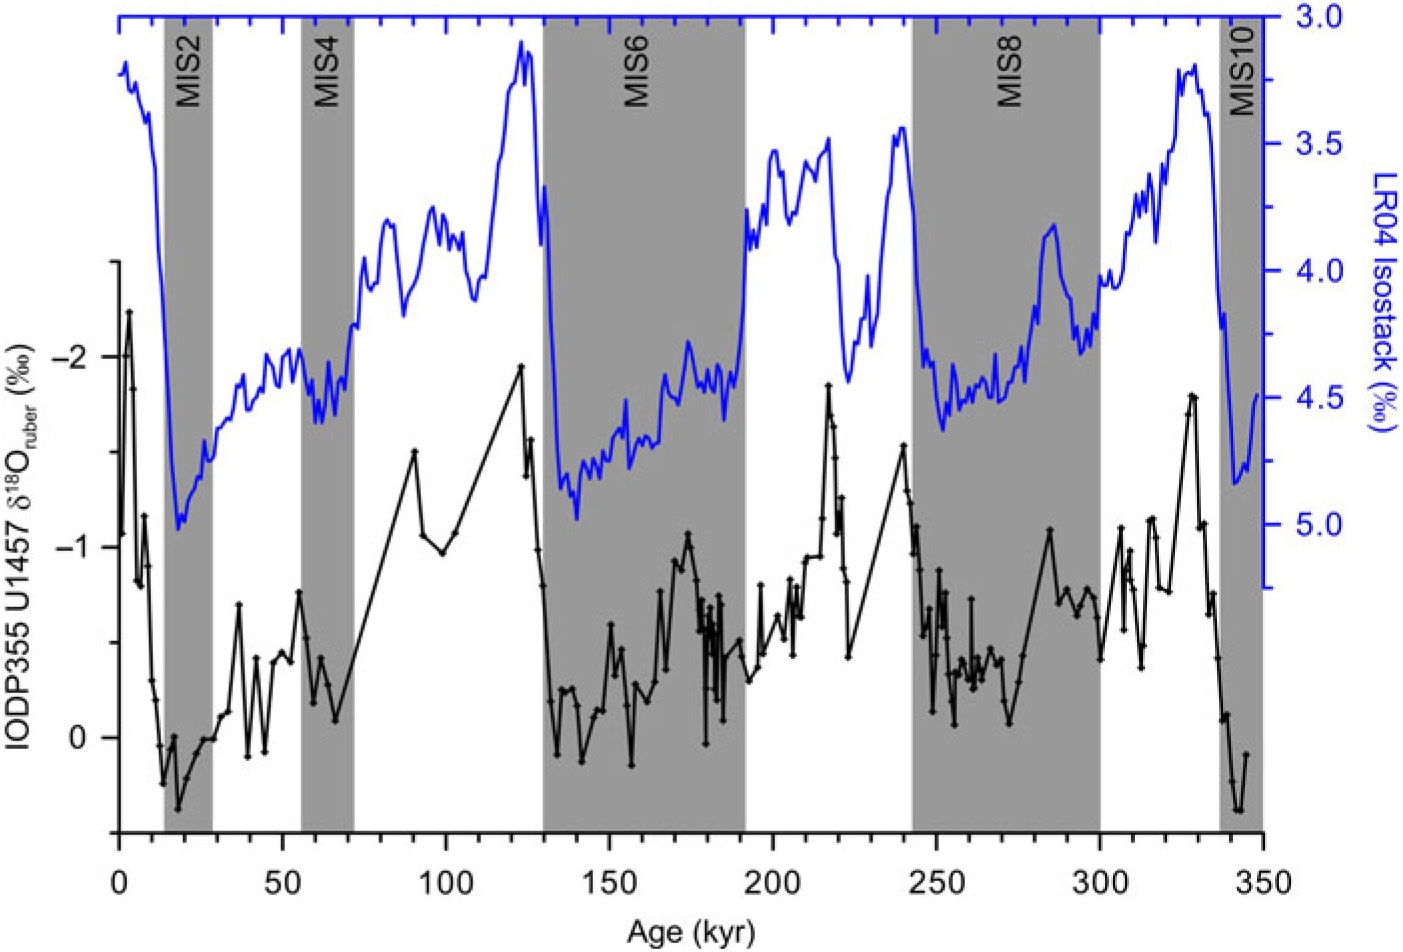
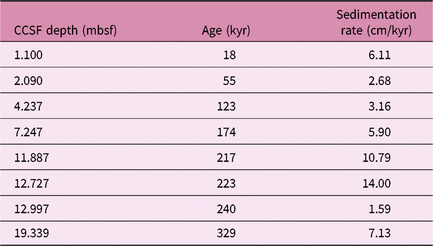
The chronology of the core was established by comparing δ18OG. ruber with the global isostack (Lisiecki & Raymo, Reference Lisiecki and Raymo2005) (Fig. 3). δ18OG. ruber was tuned to the global isostack by eight tie-points (Table 1). The error in the age model of Site U1457 is ∼4 kyr as introduced from the global isostack record (LR04) for the last 1 Ma. The top ∼20 m spliced section covers the last ∼350 kyr. The robustness of the chronology based on comparison of δ18OG. ruber with the global isostack is confirmed by a few independent biostratigraphic markers, including the disappearance of Globigerinoides ruber (pink) at the MIS6/5 boundary. The disappearance of G. ruber pink is the only biostratigraphic marker in the studied top 20 m section. The exact range of the next available marker, Emiliania huxleyi, recovered between U1457A-2H-CC, 12–17 cm and U1457A-3H-CC, 11–16 cm (Routledge et al. Reference Routledge, Kulhanek, Tauxe, Scardia, Singh, Steinke, Griffith and Saraswat2019) is poorly constrained and thus is not considered here. The average sedimentation rate in the studied section is 6.4 cm kyr−1, varying from 1.6 cm kyr−1 to 14.0 cm kyr−1.
The stable oxygen isotopic ratio of surface-dwelling planktonic foraminifera Globigerinoides ruber plotted with global isostack LR04 (Lisiecki & Raymo, Reference Lisiecki and Raymo2005) to establish the chronology of the top ∼20 m spliced section of Site U1457. The boundaries between prominent transitions in Site U1457 δ18OG. ruber were matched with LR04 and used as tie-points. The studied section covers the last 350 kyr. The alternate marine isotopic stages are marked by grey bands.

Tie-points obtained by comparing the stable oxygen isotopic ratio of Globigerinoides ruber with the LR04 global isostack (Lisiecki & Raymo, Reference Lisiecki and Raymo2005) used to develop the chronology of the top ∼20 m spliced section of Site U1457

5. Results
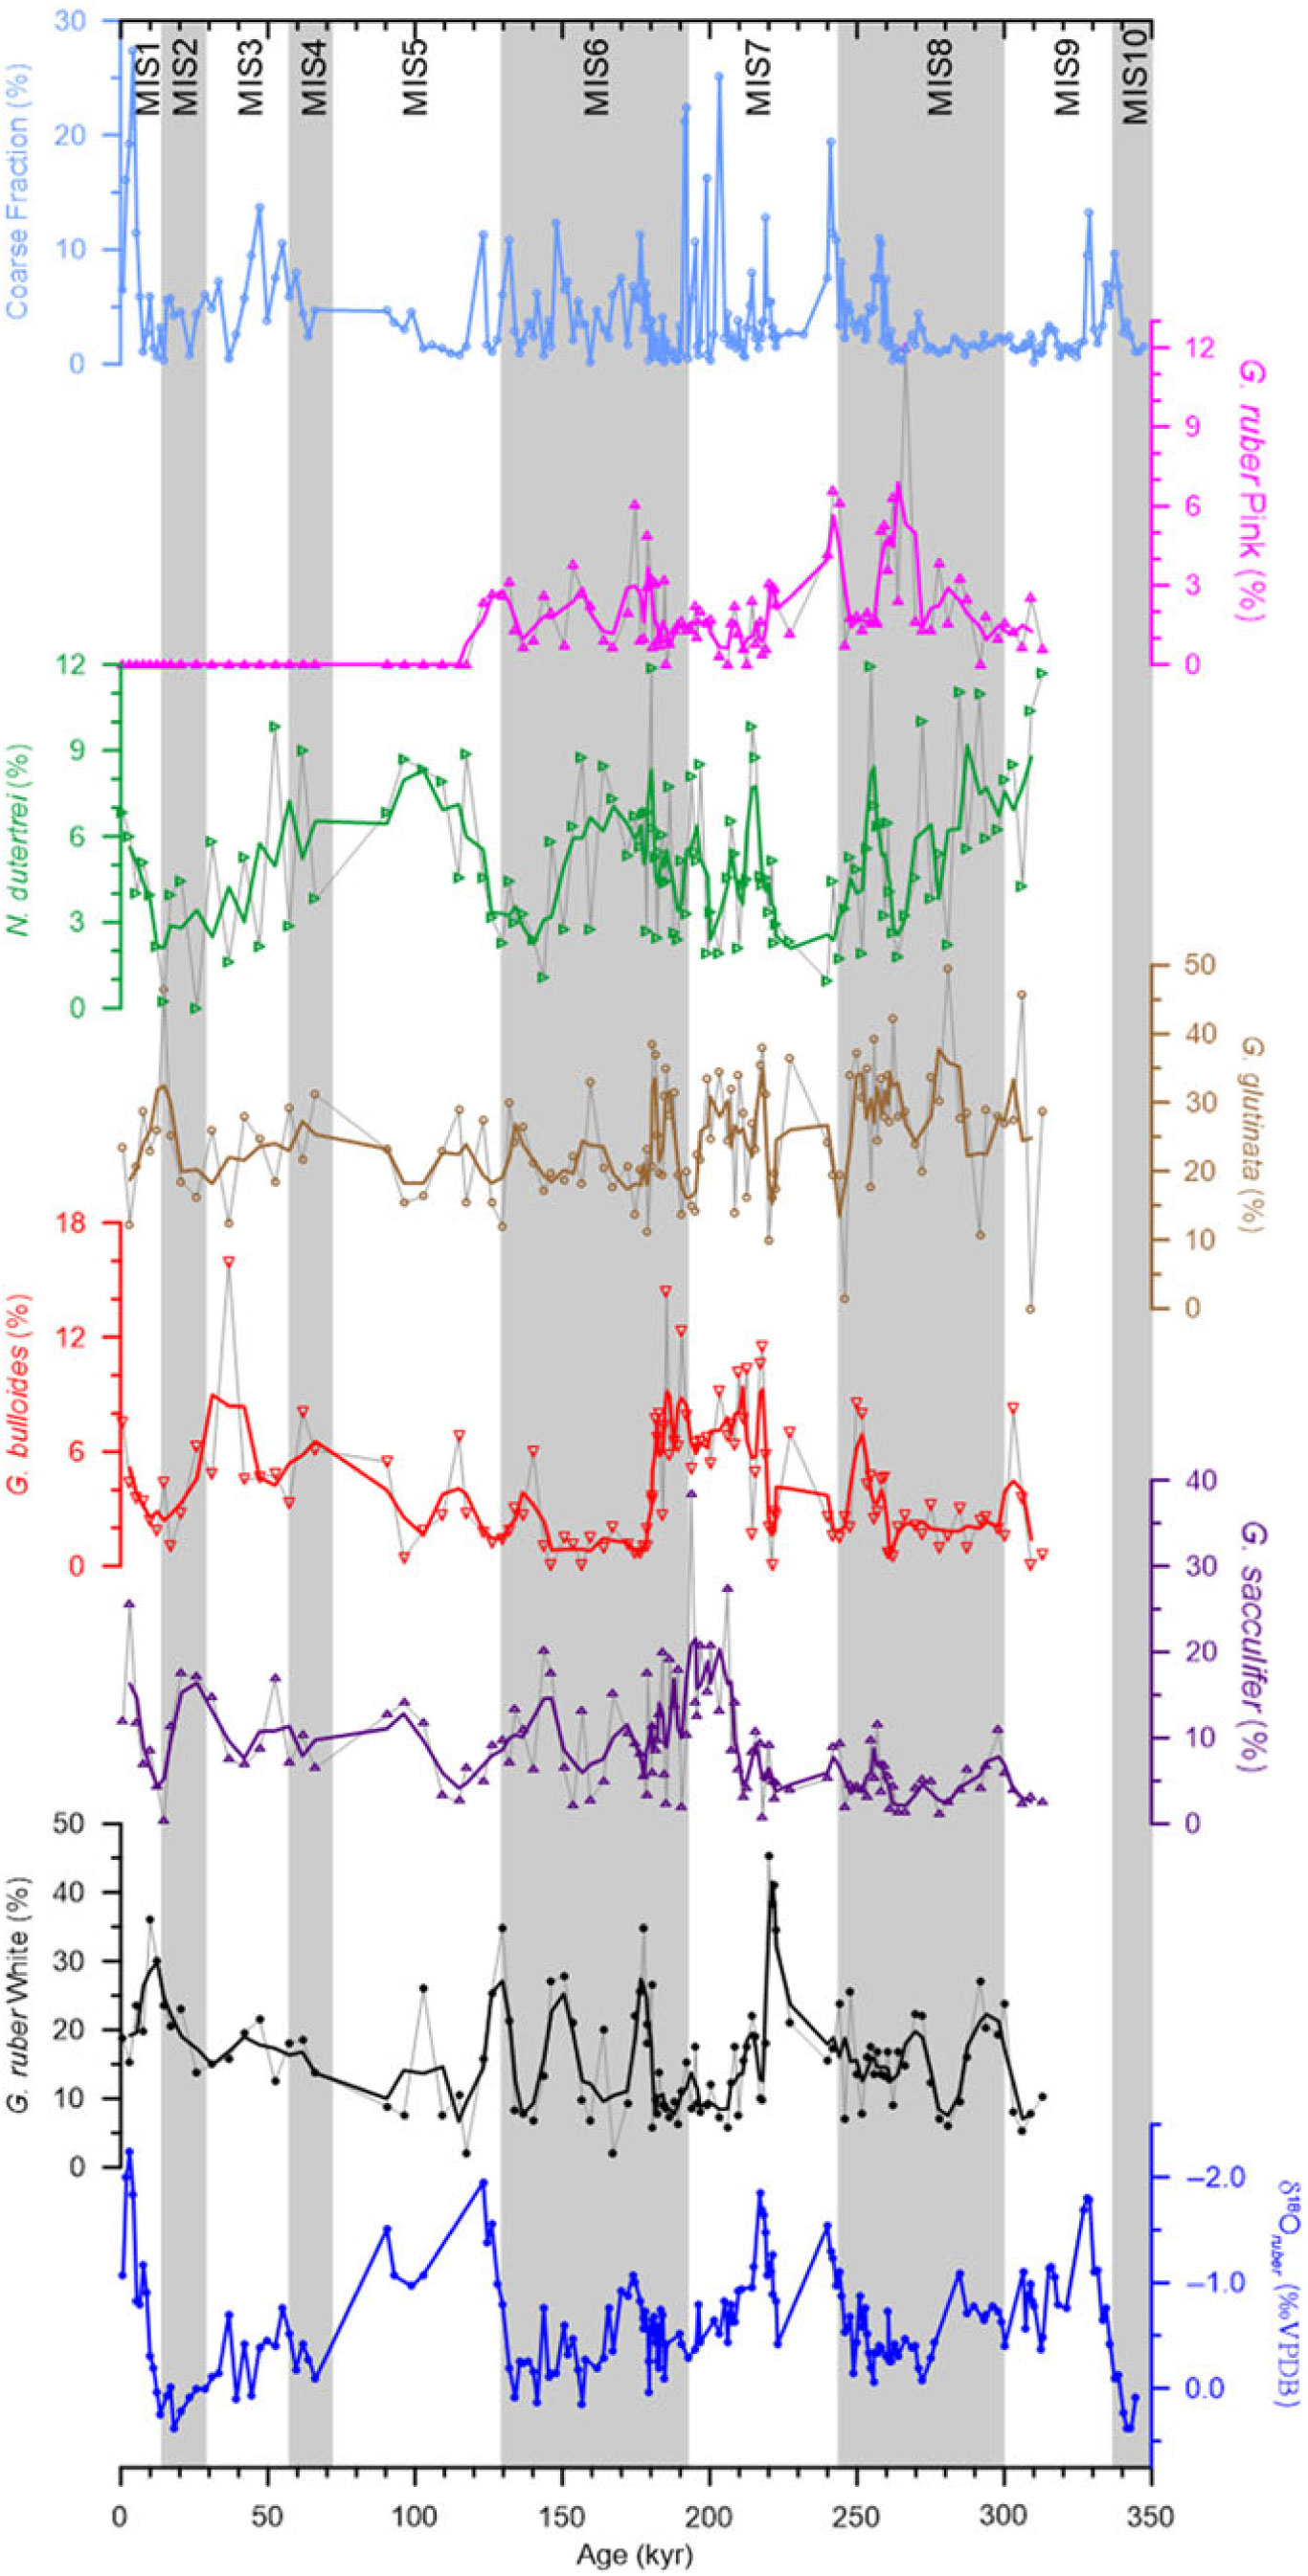
The coarse fraction is <10 % in a majority of the samples (Fig. 4). Only a few samples in the top section of the hole and MIS7 have a >10 % coarse fraction. The coarse fraction mainly comprises biogenic remains towards the top and terrigenous material in the latter half of the studied section. Globigerinoides ruber (white variety), together with Globigerinoides sacculifer and Globigerinita glutinata dominate the planktonic foraminiferal assemblage. Other dominant species include Neogloboquadrina dutertrei, Globigerinoides ruber (pink variety) and Globigerina bulloides. The relative abundance of Globigerinoides ruber (pink variety) is comparable to that of N. dutertrei. The pink variety of G. ruber is, however, present only up to MIS6. Globigerinoides ruber (white variety) is relatively more abundant during warm intervals, except MIS6. The relative abundance of G. ruber (white variety) is very high in all the interglacials during the last 350 kyr. The highest relative abundance of G. ruber (white variety) was during MIS7. In contrast to that, G. ruber (pink variety) was more abundant during MIS6 and MIS8, as compared to MIS7. The relative abundance of G. bulloides is also high during the warm intervals. The lowest relative abundance of G. bulloides was during MIS6. On a shorter time-scale, the relative abundance of G. bulloides is opposite to that of G. ruber. Globigerinita glutinata is the most abundant species, with the highest relative abundance during the beginning of MIS6. Neogloboquadrina dutertrei relative abundance was high during cold intervals, although the trend is not very clear. The relative abundance of G. sacculifer, both with and without the terminal sac-like chamber, shows a similar trend. Therefore, the total relative abundance of G. sacculifer is plotted. The highest relative abundance of G. sacculifer is towards the end of MIS7 and beginning of MIS6 (Fig. 4). A continuous increase in G. sacculifer, N. dutertrei and G. bulloides relative abundance is observed throughout the Holocene Epoch. The relative abundance of G. glutinata as well as G. ruber (white variety) decreases from early Holocene time to the present.
Down-hole variation in the coarse fraction (>63 µm) abundance, relative abundance of the dominant planktonic foraminifera species and the stable oxygen isotopic ratio in the top ∼20 m spliced section of Site U1457, representing the last 350 kyr. The alternate marine isotopic stages are marked with grey bands. The dark lines are the 3-point average.

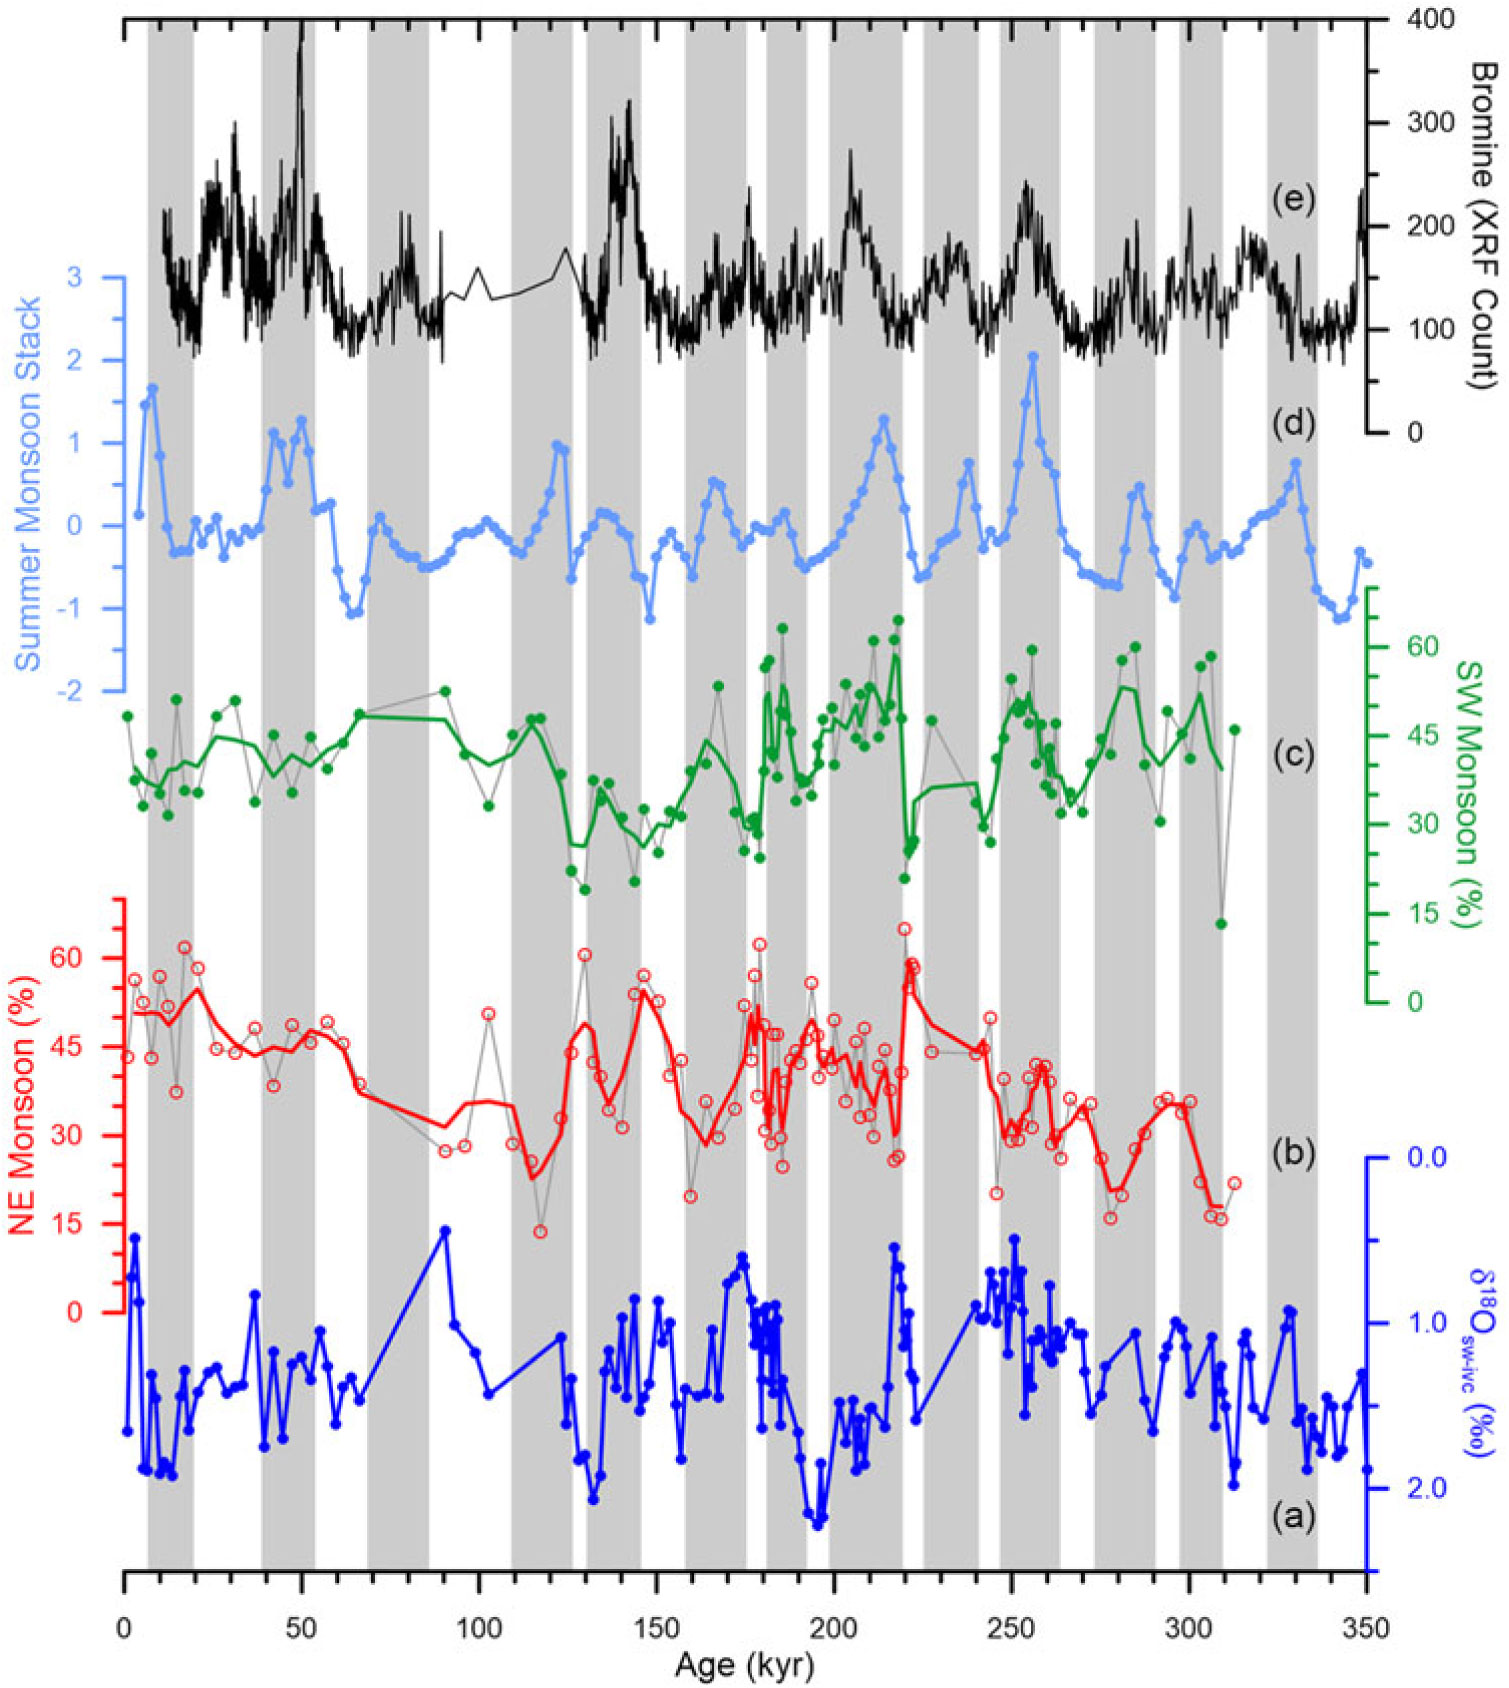
The summer and winter monsoon stack developed by combining the relative abundance of indicative planktonic foraminifera (G. bulloides, Globorotalia menardii, Pulleniatina obliquiloculata, Globigerinita glutinata and N. dutertrei for the summer monsoon; Globigerina falconensis, Globigerinoides tenellus, G. sacculifer, G. ruber and Globigerinella siphonifera for the winter monsoon) following Caley et al. (Reference Caley, Malaizé, Zaragosi, Rossignol, Bourget, Eynaud, Martinez, Giraudeau, Charlier and Ellouz-Zimmermann2011) matches well with the previous monsoon stack reconstructed from the Arabian Sea (Clemens & Prell, Reference Clemens and Prell2003) (Fig. 5). The changes in the relative strength of the summer monsoon also matched with the changes in productivity in the northern Arabian Sea, as inferred from the variation in bromine concentration (Ziegler et al. Reference Ziegler, Lourens, Tuenter and Reichart2010).
A comparison of the temperature and ice-volume corrected oxygen isotopic ratio of (a) G. ruber (δ18Osw-ivc) with the (b) northeast and (c) southwest monsoon stack developed by combining the relative abundance of indicative planktonic foraminifera species in the top 20 m section of Site U1457, (d) the Arabian Sea summer monsoon stack (Clemens & Prell, Reference Clemens and Prell2003) and (e) bromine concentration in a core collected from the northern Arabian Sea (Ziegler et al. Reference Ziegler, Lourens, Tuenter and Reichart2010). The dark lines are the 3-point average. The intervals of prominent change are marked by grey bands.

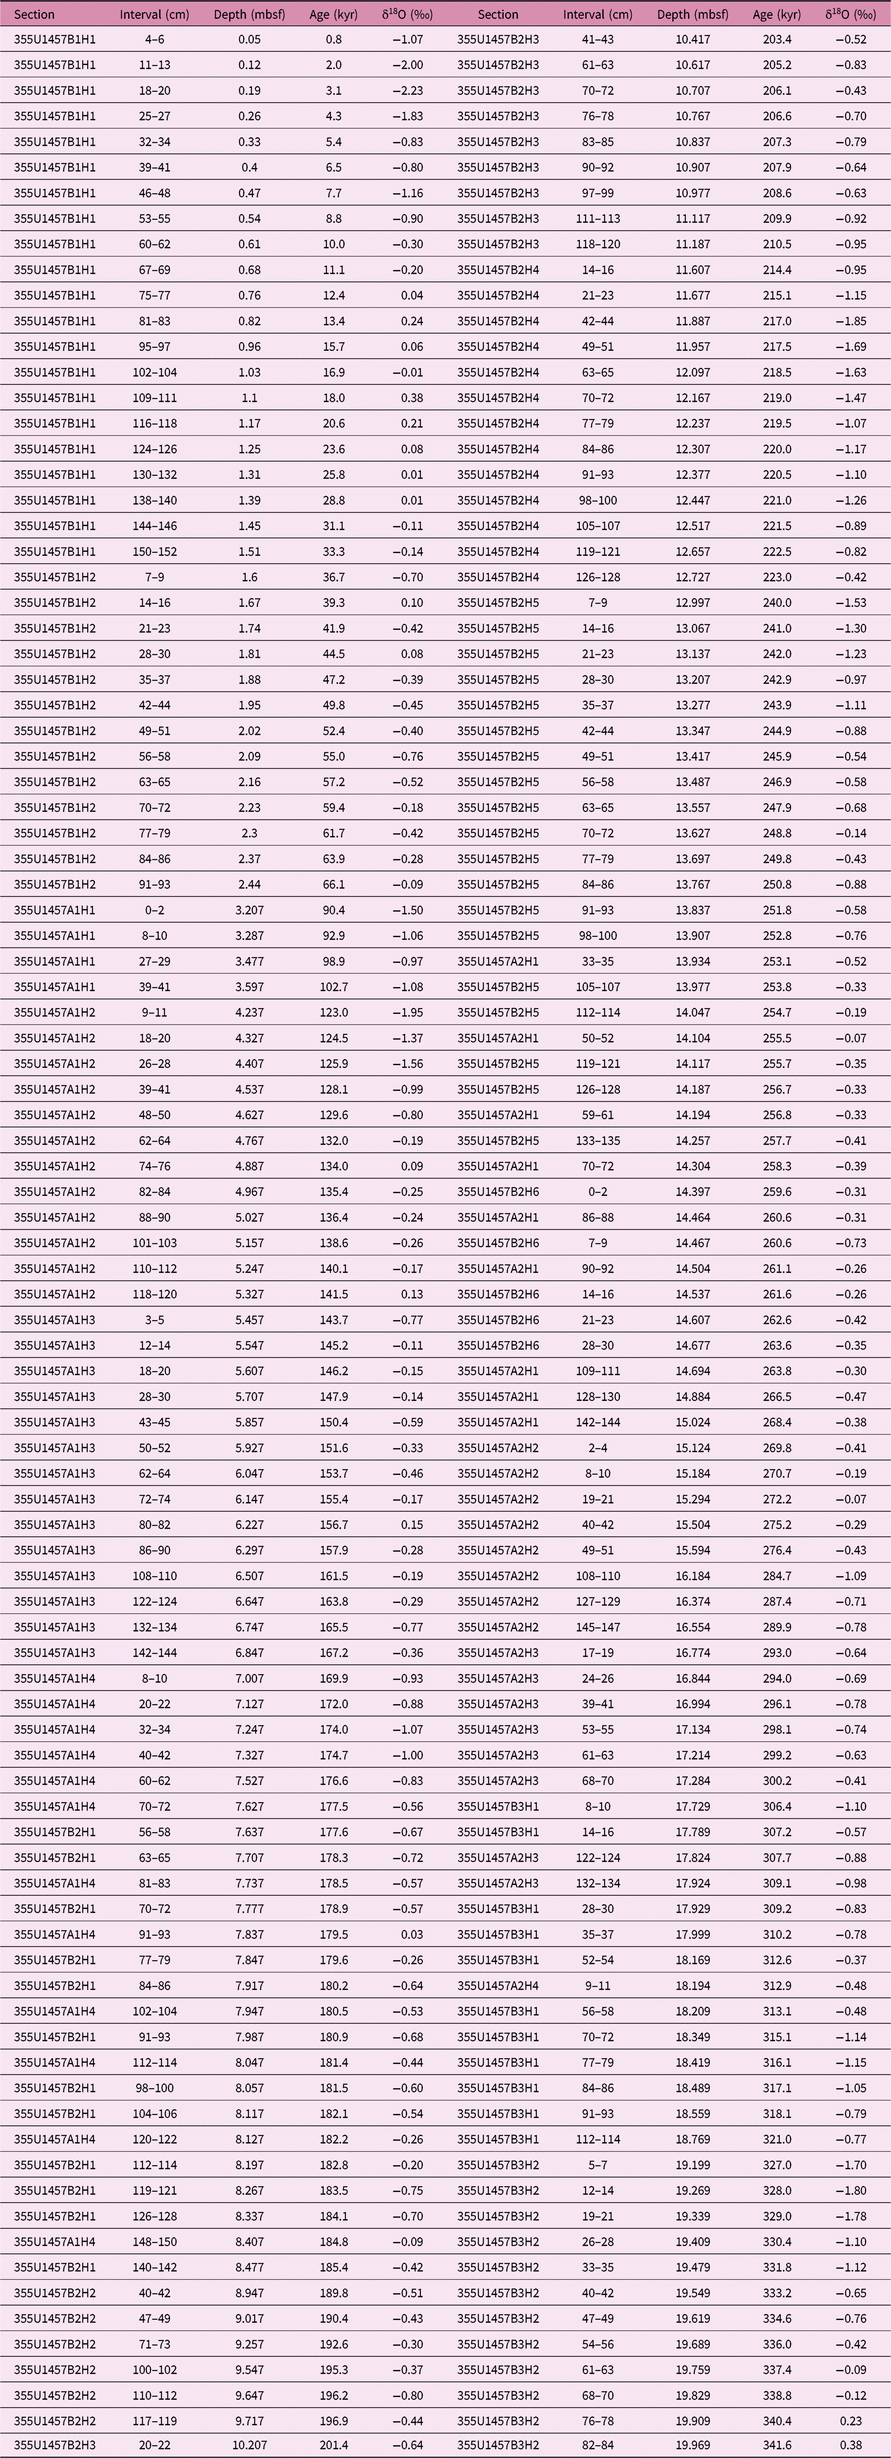
The stable oxygen isotopic ratio follows a clear glacial–interglacial pattern (Fig. 4; Table 2). The most positive δ18OG. ruber was during the last glacial maximum, and the most negative values are during early Holocene time. The sample coverage during MIS5 is scarce. The poor resolution during MIS5 is owing to a large sampling gap between 2.44 metres below seafloor (mbsf) and 3.21 mbsf, and non-availability of a sufficient number of Globigerinoides ruber specimens for stable oxygen isotopic analysis between 3.70 mbsf and 4.06 mbsf. The difference in δ18OG. ruber during glacial–interglacial transitions varies from ∼1.71 ‰ during Transition 3 (T3) to 2.61 ‰ during Transition 1 (T1). Incidentally, δ18OG. ruber during MIS5e is lower than the Holocene, a pattern differing from the majority of the previous records from the northern Indian Ocean. The lower δ18OG. ruber during MIS5e than during the Holocene is most likely due to the lack of close-grid samples during MIS5e.
Details of the sample intervals with their spliced depth, age and δ18OG. ruber

6. Discussion
A remarkable change in the relative abundance is observed in G. ruber (pink variety), with its complete absence post the MIS6/5 boundary. The disappearance of G. ruber (pink) at the MIS6/5 boundary is a well-established biostratigraphic marker (Thompson et al. Reference Thompson, Bé, Duplessy and Shackleton1979). We provide further evidence for its application as a stratigraphic marker in the northeastern Arabian Sea, as it is completely absent in the top younger than the isotopically defined MIS6/5 boundary section of Hole IODP355 U1457. The relative abundance of Globigerina bulloides in Hole IODP355 U1457 is <6 % in most of the samples, except MIS7. Globigerina bulloides is abundant in cold, nutrient-rich upwelled water (Auras-Schudnagies et al. Reference Auras-Schudnagies, Kroon, Ganssen, Hemleben and Van Hinte1989), thus making it an efficient proxy to reconstruct past upwelling history (Prell & Curry, Reference Prell and Curry1981; Kroon et al. Reference Kroon, Steens, Troelstra, Prell, Niitsuma, Emeis, Al-Sulaiman, Al-Tobbah, Anderson, Barnes, Bilak, Bloemendal, Bray, Busch, Clemens, de Menocal, Debrabant, Hayashida, Hermelin, Jarrard, Krissek, Kroon, Murray, Nigrini, Pedersen, Ricken, Shimmield, Spaulding, Takayama, ten Haven and Weedon1991; Naidu & Malmgren, Reference Naidu and Malmgren1996; Gupta et al. Reference Gupta, Anderson and Overpeck2003). The sediment traps deployed in the Arabian Sea help considerably in understanding the planktonic foraminiferal response to changing hydrographic conditions during the southwest and northeast monsoon. In the eastern Arabian Sea, the highest G. ruber abundance is during the summer monsoon season. A similar pattern is also observed in G. bulloides and N. dutertrei flux, but with an increased abundance during the winter monsoon season, as well. The highest abundance of both G. glutinata and N. dutertrei was during the winter monsoon season (Curry et al. Reference Curry, Ostermann, Gupta, Ittekkot, Summerhays, Prell and Emeis1992). Therefore, the relatively low G. bulloides abundance suggests that the northeastern Arabian Sea was not influenced by strong upwelling during the last 350 kyr, except the later part of MIS7 and MIS3. The very low G. bulloidesabundance during the cold intervals clearly indicates minimal upwelling in the northeastern Arabian Sea, and thus decreased summer monsoon intensity during cold intervals (Singh et al. Reference Singh, Jung, Darling, Ganeshram, Ivanochko and Kroon2011). However, it should be noted here that the core site is in a region with overall low relative abundance of G. bulloides (<20 %), as compared to the western Arabian Sea (e.g. ODP 723A with >15 % G. bulloides; Gupta et al. Reference Gupta, Anderson and Overpeck2003). Therefore, site IODP355 U1457 might be biased owing to a lower threshold of G. bulloides. In other words, episodic increase or decrease in upwelling might be masked owing to overall (absolute) low abundance of G. bulloides. As compared to the overall low relative abundance of G. bulloides, the abundant presence of G. glutinata throughout the last 350 kyr clearly indicates that winter convective mixing was the dominant physical forcing in the northeastern Arabian Sea during late Quaternary time.
The down-site variation in the relative abundance of G. sacculifer is often anti-correlated with that of G. ruber. Earlier, the opposite trend in the abundance of these two species was attributed to the large influence of salinity on their distribution in the Indian Ocean. Globigerinoides ruber is abundant in the high-salinity (>36 psu) subtropical waters, whereas G. sacculifer is predominantly found in relatively less saline (<36 psu) tropical waters (Bé & Hutson, Reference Bé and Hutson1977; Seears et al. Reference Seears, Darling and Wade2012). Thus, the increased abundance of oligotrophic G. sacculifer during the latter part of MIS7 and beginning of MIS6 as well as MIS2 and a concomitant decrease in the relative abundance of G. ruber would suggest a decrease in salinity during these intervals. The enriched δ18OG. ruber, however, suggests increased salinity during all of these intervals. The difference is attributed to a combined effect of ice volume, SST and regional freshwater runoff as well as precipitation–evaporation changes on δ18OG. ruber. Therefore, δ18OG. ruber has been corrected for the ice-volume contribution, and the variations in residual δ18O are discussed subsequently. The observed trend can also be attributed to the preference of G. sacculifer to highly oligotrophic nutrient-poor waters (Bijma & Hemleben, Reference Bijma and Hemleben1994; Seears et al. Reference Seears, Darling and Wade2012). Therefore, the latter part of MIS7 and the beginning of MIS6 as well as MIS2 can be inferred to be intervals of highly oligotrophic waters. The findings are further supported by the low abundance of N. dutertreiduring these intervals. The relative abundance of G. bulloides, was, however, higher during the latter part of MIS7 and beginning of MIS6, suggesting fertile waters with nutrient-enriched conditions. The relative abundance of G. bulloides was only moderately high (8–10 %). The increased relative abundance of G. sacculifer coupled with G. bulloides during the latter part of MIS7 and beginning of MIS6 thus indicates relatively cold waters with moderate nutrients to support increased abundance of G. bulloides. The cold, low-nutrient surface waters were detrimental to G. ruber (Bè & Tolderlund, Reference Bè, Tolderlund, Funnel and Riedel1971; Seears et al. Reference Seears, Darling and Wade2012) and thus led to a large drop in its abundance. The increased surface productivity in the northeastern Arabian Sea during the summer monsoon season is supported by the advection of upwelled water from the western Arabian Sea. We infer that the advection of upwelled water increased during the latter half of MIS7 and beginning of MIS6. The subsequent rare presence of G. bulloides during a large part of MIS6 suggests negligible upwelling and or advection of upwelled water from the western Arabian Sea. The simultaneous increased abundance of N. dutertrei suggests vigorous convective mixing. The early MIS5 was marked by an increased abundance of both G. bulloides and N. dutertrei, suggesting a combination of moderate upwelling and enhanced winter convection, the same as today. The subsequent drop in G. bulloides and still higher relative abundance of N. dutertrei is attributed to decreased upwelling and enhanced winter convection with the progress of the glacial interval. The highest relative abundance of G. bulloides during the latter half of MIS3 is inferred to be evidence of increased upwelling and high nutrient availability. The eutrophic condition is further supported by the drop in relative abundance of the oligotrophic G. sacculifer. MIS2 was an interval of significantly reduced upwelling and increased convective mixing in the northeastern Arabian Sea, as evident from the low relative abundance of G. bulloides and an increased abundance of N. dutertrei. The results support the earlier findings of reduced upwelling and low productivity during cold intervals (Singh et al. Reference Singh, Jung, Darling, Ganeshram, Ivanochko and Kroon2011). A further increase in the relative abundance of N. dutertrei and G. sacculifer and a moderate increase in G. bulloides suggests oligotrophic conditions with moderate upwelling and strong convective mixing during Holocene.
δ18OG. ruber during glacial–interglacial transitions is influenced by ice-volume contribution, seawater temperature and regional evaporation–precipitation, as well as the freshwater influx. The global ice-volume contribution during the past is well defined and is subtracted from δ18OG. ruber to understand local temperature and the precipitation–evaporation budget (Waelbroeck et al. Reference Waelbroeck, Labeyrie, Michel, Duplessy, McManus, Lambeck, Balbon and Labracherie2002). The temperature contribution to δ18OG. ruber has to be deducted to estimate the regional precipitation–evaporation budget or monsoon changes. SST in the eastern Arabian Sea was 3 °C cooler during the last glacial maximum (Saraswat et al. Reference Saraswat, Nigam, Weldeab, Mackensen and Naidu2005, Reference Saraswat, Lea, Nigam, Mackensen and Naik2013; Anand et al. Reference Anand, Kroon, Singh, Ganeshram, Ganssen and Elderfield2008). These records are, however, limited either to the last glacial–interglacial interval or only a part of the last glacial interval. The nearest and the only available long-term SST record covering the time span studied here is from the southeastern Arabian Sea. Therefore, we used the SST estimated from the Mg/Ca ratio of G. ruber in core MD90-0963, collected from the southeastern Arabian Sea, to remove the temperature contribution from δ18OG. ruber (Tachikawa et al. Reference Tachikawa, Sépulcre, Toyofuku and Bard2008). The annual average SST at site IODP355 U1457 (27.6 °C) is slightly cooler than that at MD90-0963 (28.7 °C) (Tachikawa et al. Reference Tachikawa, Sépulcre, Toyofuku and Bard2008). The ice-volume contribution was then removed from the temperature-corrected δ18OG. ruber (δ18Osw) to understand regional precipitation–evaporation changes (δ18Osw-ivc). The 1.0 ‰ decrease in δ18Osw-ivc is equivalent to a decrease in precipitation and or freshwater influx of 3–4 psu (Delaygue et al. Reference Delaygue, Bard, Rollion, Jouzel, Stievenard, Duplessy and Ganssen2001). We assume a temporally consistent δ18O–salinity relationship while estimating salinity. The relationship between seawater salinity and its oxygen isotopic ratio may, however, vary regionally and can also be different at the same location during various time intervals. The spatio-temporal variation in the relationship between salinity and δ18O, due to local change in freshwater influx, sea ice cover and ocean circulation may increase the uncertainty in palaeosalinity estimates. The coupled model simulations of the salinity–δ18O relationship during different boundary conditions, however, suggest a robust palaeosalinity reconstruction in the Indian Ocean (Holloway et al. Reference Holloway, Sime, Singarayer, Tindall and Valdes2016).
The change in δ18Osw-ivc was the same during Termination 2 (T2) and T3 (∼1.6 ‰) (Fig. 5). The difference in δ18Osw-ivc during both T1 and Termination 4 (T4), however, was lower by 0.2 ‰ and 0.6 ‰, respectively, as compared to T2 and T3. Thus, the change due to regional precipitation–evaporation and freshwater influx was comparatively lower during T1 and T4. The reduced regional contribution, therefore, suggests a less intense change in the monsoon during both T1 and T4. The interglacial intervals are marked by an increased relative abundance of warm water-preferring G. ruber, and the abundance decreased during glacial intervals, as suggested by modelling (Fraile et al. Reference Fraile, Schulz, Mulitza, Merkel, Prange and Paul2009). The decreased salinity during interglacials is also evident from the increased abundance of low-salinity preferring G. glutinata (Bé & Hutson, Reference Bé and Hutson1977).
The relative abundances of individual species were clubbed together to develop a representative summer and winter monsoon planktonic foraminiferal assemblage stack (Caley et al. Reference Caley, Malaizé, Zaragosi, Rossignol, Bourget, Eynaud, Martinez, Giraudeau, Charlier and Ellouz-Zimmermann2011). The change in representative assemblages was compared with the multi-proxy summer monsoon stack reconstructed from the northern Arabian Sea (Clemens & Prell, Reference Clemens and Prell2003). Additionally, the data were also compared with past productivity estimated from bromine in a core (MD04-2881) collected in the northeastern Arabian Sea at a water depth of 2387 m at the Murray Ridge (22º 12.5′ N, 63º 05.5′ E) (Ziegler et al. Reference Ziegler, Lourens, Tuenter and Reichart2010). A majority of the prominent weak or strong monsoon intervals as inferred from the stacked planktonic foraminiferal assemblages in site IODP355 U1457 match very well with the previous summer monsoon stack as well as changes in productivity as inferred from bromine. A good coherence between site IODP355 U1457 and the region further north as well as the western Arabian Sea (Fig. 5) suggests a coeval response of the entire northern Arabian Sea to the glacial–interglacial changes. Other records from the region also suggest a strengthened winter monsoon circulation during the glacial ice maxima and northern hemisphere sensible heat minima (Caley et al. Reference Caley, Malaizé, Zaragosi, Rossignol, Bourget, Eynaud, Martinez, Giraudeau, Charlier and Ellouz-Zimmermann2011). From the dominant eccentricity (100 kyr) and obliquity (41 kyr) cycles in the temperature and ice-volume-corrected local δ18O record it was inferred that the Asian monsoon is strongly modulated by both the atmospheric greenhouse gas concentration as well as the high-latitude ice sheet extent, as compared to direct insolation forcing (Clemens et al. Reference Clemens, Holbourn, Kubota, Lee, Liu, Chen, Nelson and Fox-Kemper2018). The prominent change during the glacial–interglacial transitions at site IODP355 U1457 also suggests a strong influence of high-latitudinal ice sheets, besides local insolation, on the monsoon in this region (Saraswat et al. Reference Saraswat, Nigam, Mackensen and Weldeab2012).
7. Conclusions
Based on the temporal changes in the relative abundance of planktonic foraminiferal species at Site U1457, we infer that the winter convective mixing was the dominant physical forcing in the northeastern Arabian Sea during late Quaternary time. The increased abundance of G. bulloides suggests that the advection of upwelled water increased during the latter half of MIS7 and beginning of MIS6. The subsequent interval of MIS6 is inferred to be marked by negligible upwelling and or advection of upwelled water from the western Arabian Sea, based on the rare presence of G. bulloides. The hydrographic conditions during the early part of MIS5 were the same as today. The upwelling decreased and winter convection increased with the progress of the last glacial interval. The difference in δ18Osw-ivc was at a maximum during Termination 2 and 3 (1.6 ‰) as compared to Termination 1 and 4. The δ18Osw-ivc difference of 1.6 ‰, suggests a 4–5 psu change in salinity during T2 and T3. The reduced regional contribution to the δ18Osw-ivc difference during T1 and T4 suggests a less intense change in the monsoon.
Acknowledgements
The authors are thankful to the Director, Council of Scientific and Industrial Research-National Institute of Oceanography, Goa, India for infrastructural support and the National Centre for Polar and Ocean Research, Ministry of Earth Sciences, India for providing the post-cruise funding (Grant No. NCAOR/IODP/2017/6). The International Ocean Discovery Program is acknowledged for the drilling and providing the samples. We thank Lisa Schönborn, Alfred Wegner Institute for Polar and Marine Science, Bremerhaven, Germany for the stable oxygen isotopic analysis and maintaining the Isotopic Ratio Mass Spectrometer.