

INTRODUCTION
Biofouling on submerged surfaces in the marine environment is a process initiated by the adhesion of bacteria and diatoms and is completed by the development of animal and plant communities (Holmstrom & Kjelleberg, Reference Holmstrom, Kjelleberg and Fingerman1999). It is one of the most important problems currently faced by marine technology. The settlement of fouling communities on submerged structures can lead to a reduction in their performance by causing damage to static structures and underwater equipment or reduced speed and increased fuel consumption in ships (Evans & Clarkson, Reference Evans and Clarkson1993; Yan & Yan, Reference Yan and Yan2003). The fouling process involves two important stages, the ‘microfouling’ and the ‘macrofouling’. The macrofouling may be classified into either ‘soft fouling’ or ‘hard fouling’ (Callow, Reference Callow and Fingerman1999). The soft fouling community comprises sponges, anemones, hydroids, ascidians and macro-algae. The hard foulers include invertebrates such as barnacles, mussels, bryozoans and tube worms.
To control the fouling on marine installations, consideration must be given to the larval settlement and recruitment pattern. While fouling has been found at all depths of coastal waters, the composition is not the same throughout the vertical column even in the same location (WHOI, 1952). The majority of epifaunal species depend on planktonic larval dispersal and in most circumstances the larvae are able to undergo active vertical movements in the water column. Hence, studies based on panel observation at one depth alone may not give a realistic picture of the fouling pattern as well as the abundance of the fouling organisms in a region under investigation (Sasikumar et al., Reference Sasikumar, Rajagopal and Nair1989). Despite the likely importance of depth in structuring epifaunal assemblages, it has received very little experimental attention (Rule & Smith, Reference Rule and Smith2007).
The settlement of fouling communities on submerged structures in the Indian marine environment has been documented in a number of studies (Anil & Wagh, Reference Anil, Wagh and Thompson1988; Sasikumar et al., Reference Sasikumar, Rajagopal and Nair1989; Rajagopal et al., Reference Rajagopal, Azariah and Nair1990, Reference Rajagopal, Nair, Van der Velde and Jenner1997; Srinivas et al., Reference Srinivas, Sawant and Wagh1992; Swami & Udhayakumar, Reference Swami, Udhayakumar and Abidi2004). Further, most of the previous studies on the east coast of India are mainly restricted to the Madras coast (Kalpakkam), and there is still a paucity of information on the nature and composition of the fouling complex and their spatial and temporal variability in the Gulf of Mannar region. This paper deals with the recruitment pattern of inter-tidal fouling communities on the Kudankulam coast with the hope that it can serve as baseline information. The term ‘recruitment’ used here includes the process leading to settlement and metamorphosis of larvae and their survival until observation (Rodriguez et al., Reference Rodriguez, Ojeda and Inestrosa1993).
MATERIALS AND METHODS
Study area
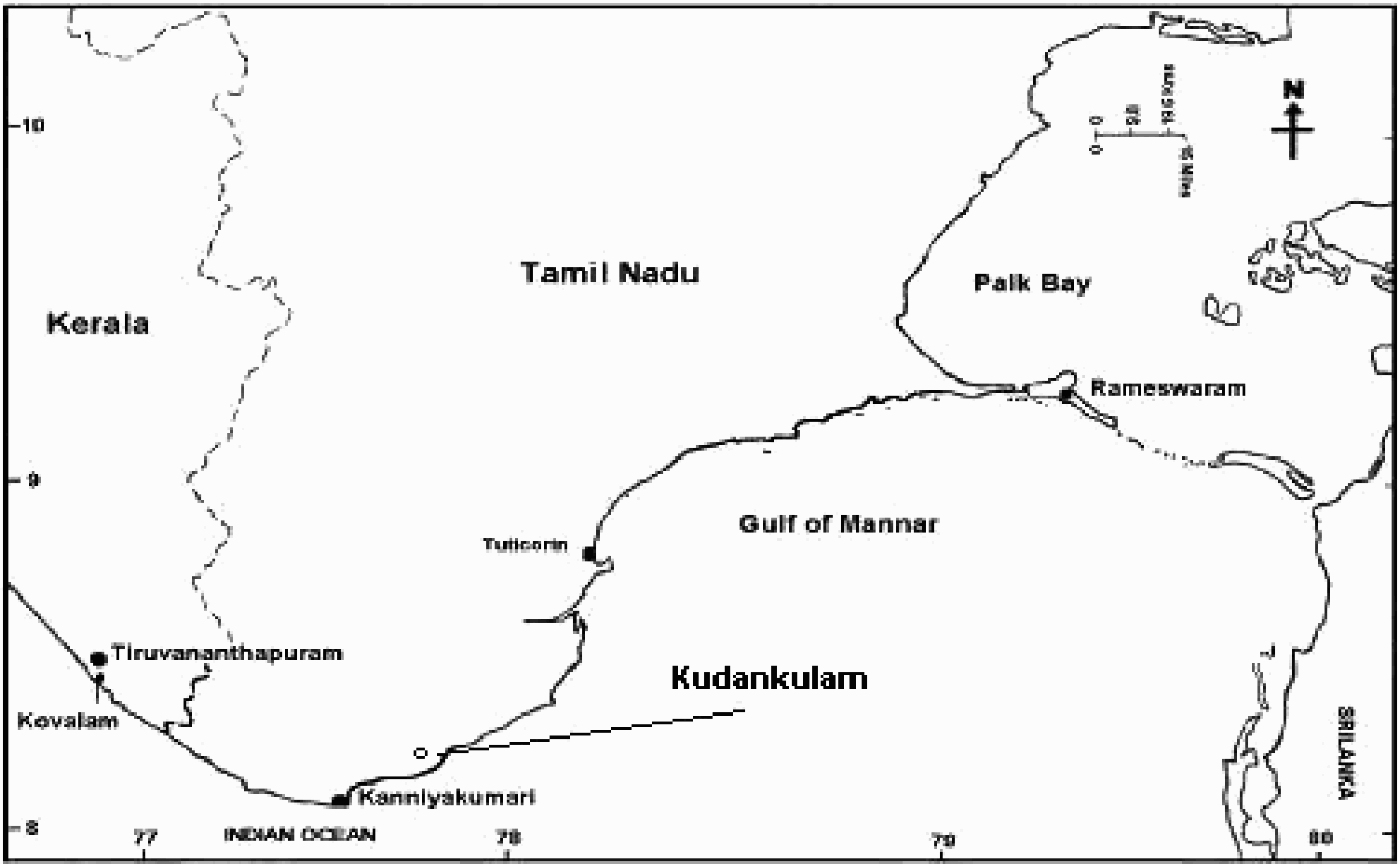
The investigation was carried out for a period of one year from January to December 2005 at Kudankulam coast (8°9′N 77°39′E), located about 25 km north-east of Kanyakumari on the east coast of India (Figure 1). The shore is sandy with soft substrata and a few rocky reefs. The economic activity of the region has increased in the recent past due to the emerging mega-nuclear power project and the seawater will be the source of condenser and auxiliary system coolant and also used as a source for potable water.
Map showing the study area.

Experimental design
The test panels made of teak wood with a size of 10 × 10 × 2 cm were vertically suspended in a suitably designed wooden raft with grooves to keep a 10 cm distance between panels. Teak wood was selected as substratum for the present study due to its strength, stability and resistance to harsh environmental conditions. The settlement pattern of biofoulers was studied by suspending test panels at three depths (1 m, 4 m and 7 m) on long-term and short-term bases. The short-term panels were of 15 days’ duration, suspended at the beginning of every month (two panels at each depth) and observed at the end of every fortnight when replacing with a new set of panels. The long-term panels (48 panels at each depth) were suspended together and retrieved at the rate of two panels every 15 days up to 300 days.
Panels retrieved in duplicate were studied (both sides) for biomass, species composition and numerical abundance of the fouling community. The total biomass of the fouling organisms was estimated after carefully scraping off the fouling materials and weighing them. Dry weight of the entire fouling assemblage from the panels was measured after drying at 60°C for about 24 hours (Nandakumar, Reference Nandakumar and Subramoniam1998) and expressed as dry weight in g.dm−2. The abundance of fouling organisms was assessed manually by counting the number of individuals after separating them into different species or groups. The mean density of fouling organisms observed from the long-term (i.e. an average of two panels at fortnightly intervals) and short-term panels in each month (i.e. an average of 2 × 2 = 4 panels in a month) was expressed as the number of individuals dm−2 (dm−2 15 d−1 for short-term panels) except for colonial forms and seaweeds. The area covered by colonial forms like ascidians was estimated using the random point sampling technique and expressed as percentage of coverage on test panels (Nandakumar, Reference Nandakumar and Subramoniam1998). For this purpose, a quadrat of the same size as the panel was marked with points at 1 cm intervals on a transparency sheet. This sheet was laid over the panel and the number of points overlapping each organism was counted. For seaweeds, the biomass (g.dm−2) was considered. The variation in the settlement of fouling community on panels suspended at the depths of 1 m, 4 m and 7 m was analysed by one-way analysis of variance (ANOVA).
RESULTS
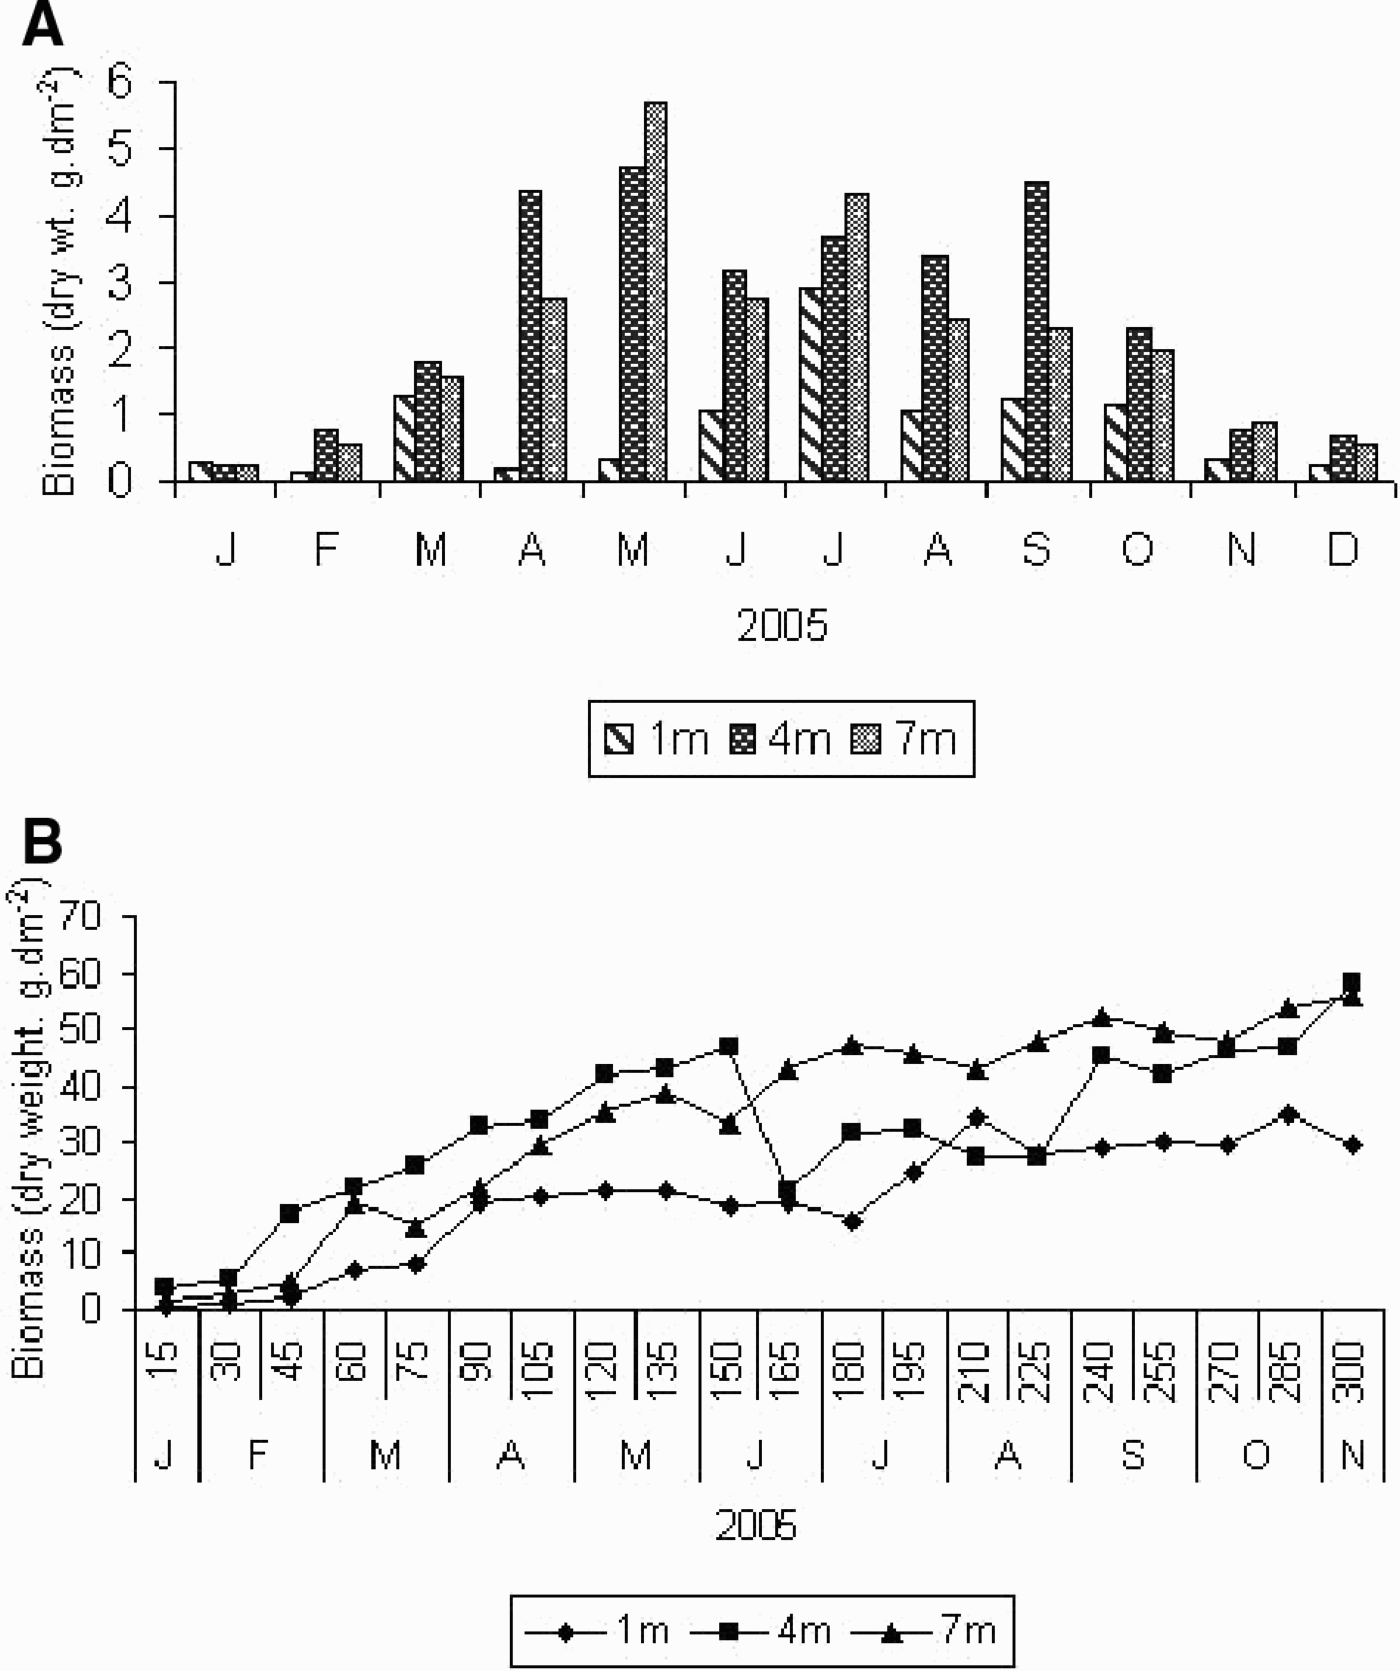
The test panels suspended at three depths indicated that the recruitment was higher at 4 m than at 1 m and 7 m. Fouling was observed throughout the year without any apparent preference of seasonality. On the short-term series, the total fouling biomass varied from 0.218 to 1.23 g.dm−2 at 1 m, 0.23 to 4.72 g.dm−2 at 4 m and 0.241 to 5.66 g.dm−2 at 7 m respectively. The biomass values were generally low within the period of January–February and November–December at all three depths. The maximum biomass value was observed at the depths of 4 m and 7 m in May 2005 (Figure 2A). On the long-term panels, the biomass of the fouling community ranged between 0.79 and 35 g.dm−2 at 1 m, 3.72 and 58.2 g.dm−2 at 4 m and 0.241 and 55.9 g.dm−2 at 7 m, respectively (Figure 2B). The total fouling biomass was variable with a significant difference between depths on short-term (F = 4.8; df = 2,33; P < 0.05) and long-term panels (F = 5.9; df = 2,57; P < 0.05).
Fouling biomass accumulation on (A) short-term and (B) long-term panels suspended at three depths.

Barnacles, ascidians, polychaetes, amphipods and seaweeds were the common fouling groups observed on the panels. Of the barnacles, Balanus amphitrite was the dominant species settling on the test panels throughout the year. The recruitment of barnacles on the short-term panels (Figure 3A) showed the highest value at 4 m (340 ind dm−2) and the lowest at 1 m (131 ind dm−2). The density of barnacles settled on the panels at 7 m depth varied between 2 and 263 ind dm−2. On the long-term panels, the abundance of barnacles varied from 26 to 170 ind dm−2 at 1 m depth, 59 to 217 ind dm−2 at 4 m depth and 98 to 203 ind dm−2 at 7 m depth (Figure 3B). In general, the recruitment of barnacles on short-term panels was very low in January–March, while highest in June–September at all the depths. However, the long-term panels did not reflect this pattern, in which a decrease in colonization was observed during June–August. The abundance of barnacles across the depth gradient showed a non-significant variation on the short-term panels (F = 0.27; df = 2,33; P > 0.05) and a significant variation on the long-term panels (F = 7.53; df = 2,57; P < 0.05).
Depth-associated distribution of barnacles. (A) Short-term panels; (B) long-term panels.

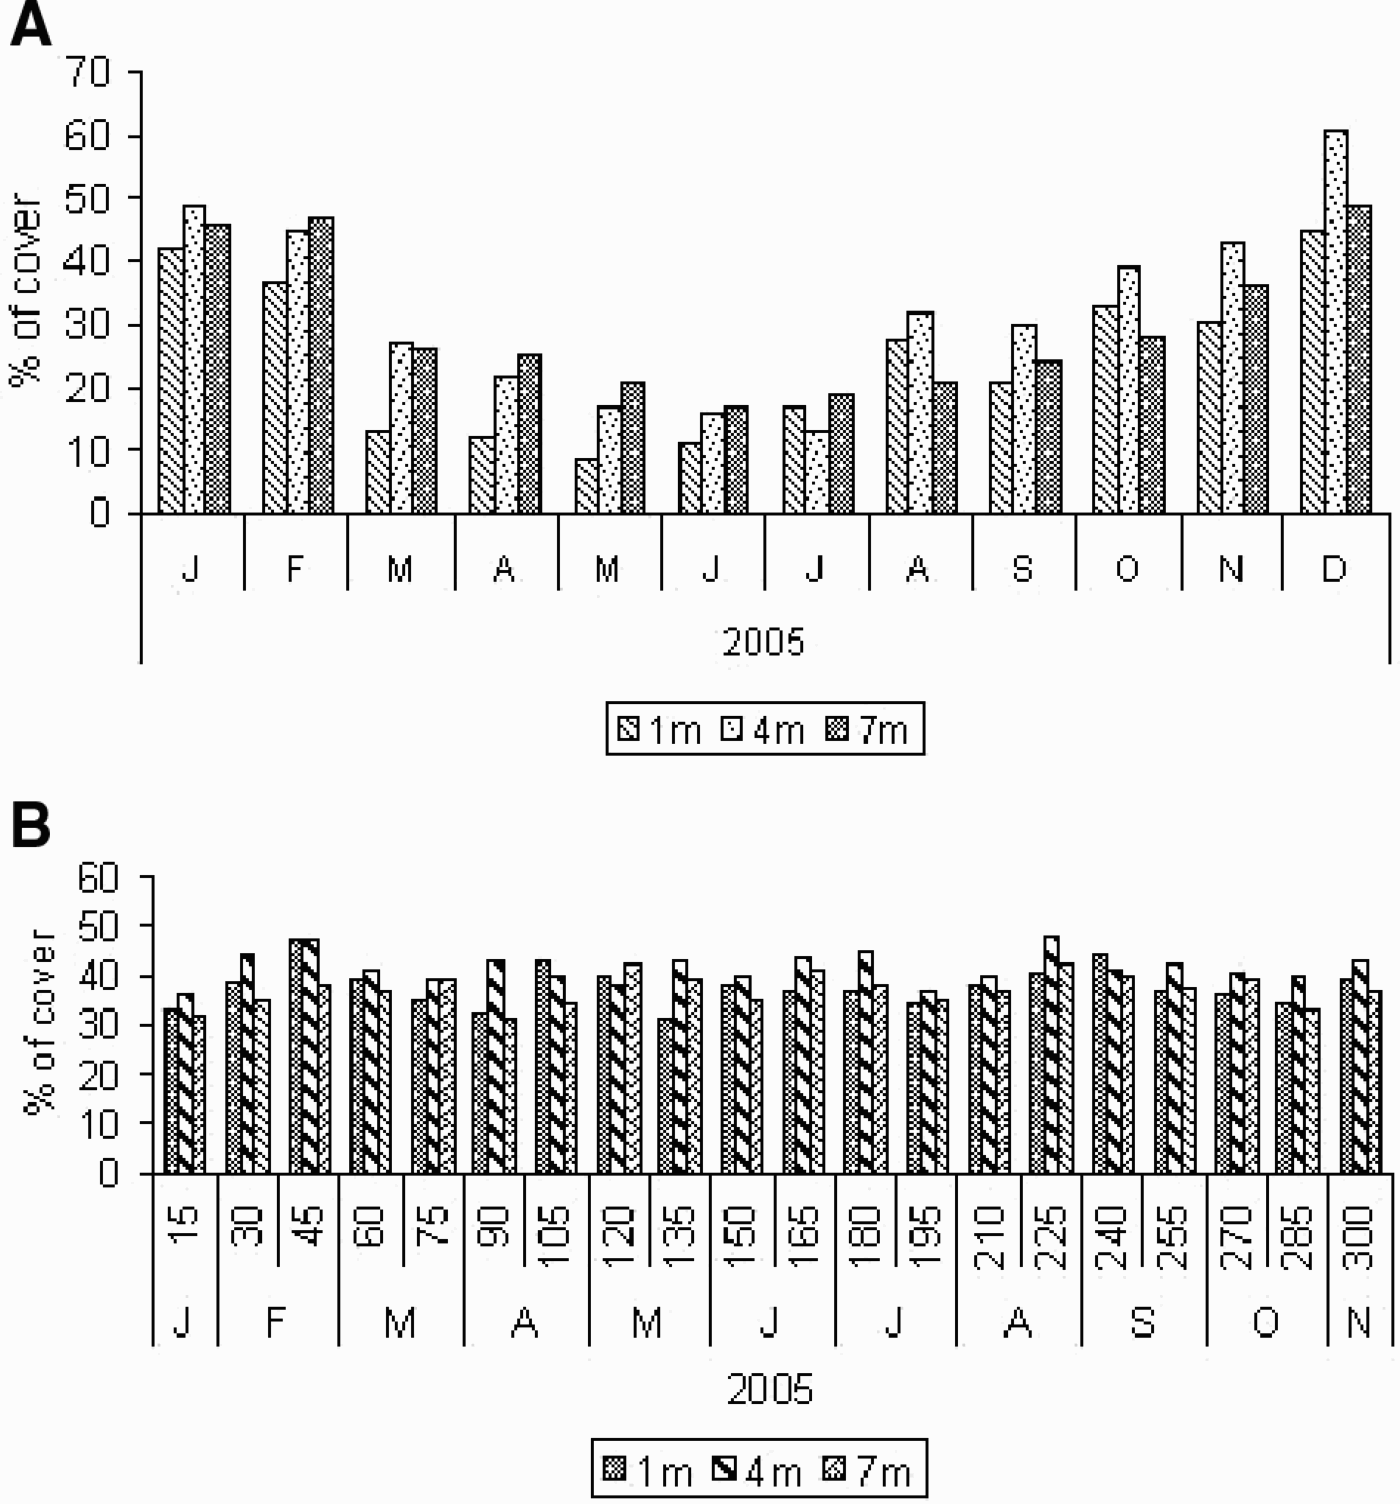
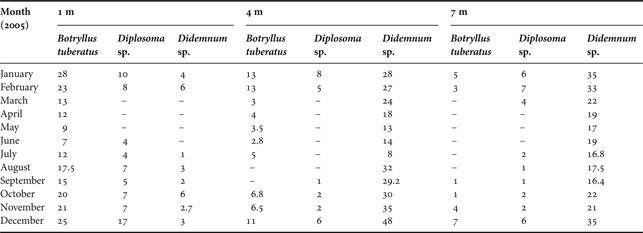
The recruitment of ascidians on the short-term panels varied from 13 to 61% at 4 m and 21 to 45% at 1 m. The percentage contribution of the ascidians on the panels suspended at 7 m varied from 17 to 49% (Figure 4A). On the long-term panels, the ascidian coverage varied from 31.2 to 47% at 1 m, 36 to 47% at 4 m and 31 to 42% at 7 m (Figure 4B). Ascidians were abundant on short-term panels in January–February and October–December at all the depths. While Botryllus tuberatus and Diplosoma sp. were the dominant species on panels suspended at 1 m depth, Didemnum spp. was dominant at 4 m and 7 m depth (Table 1). The percentage contribution of the ascidians on the panels suspended at three depths also showed a non-significant variation on the short-term panels (F = 1.12; df = 2,33; P > 0.05) and a significant variation on the long-term panels (F = 9.9; df = 2,57; P < 0.05).
Distribution of ascidians on (A) short-term and (B) long-term panels suspended at different depths.

Percentage cover of ascidians on short-term panels.

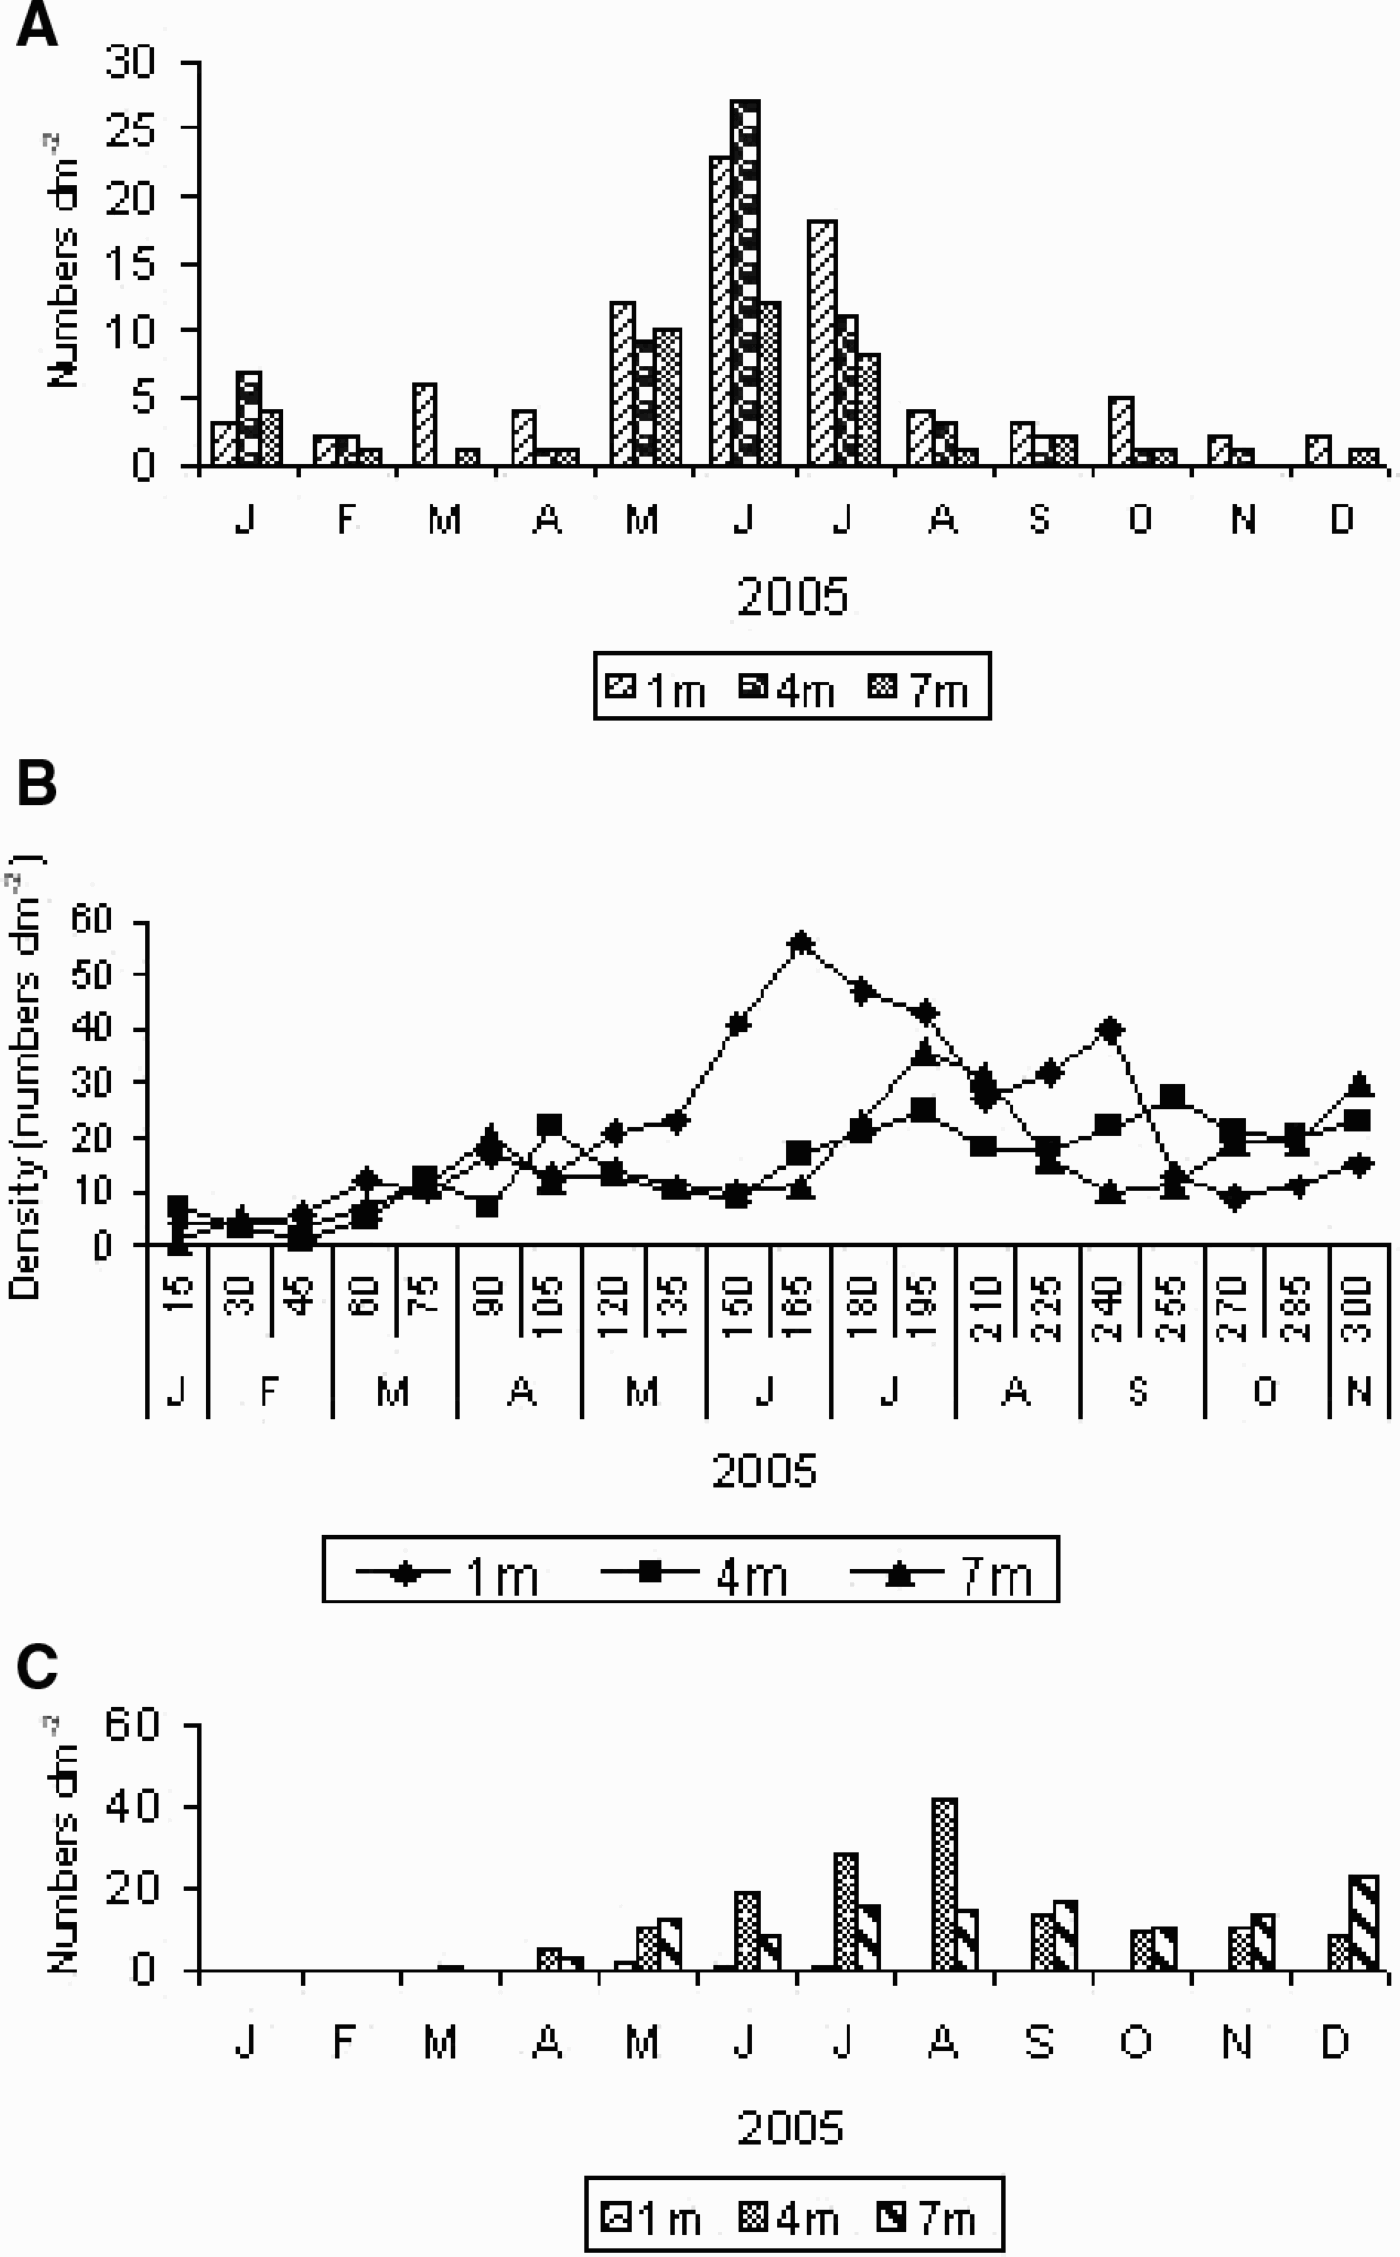
Considerable numbers of errant and sedentary polychaetes were observed on the test panels during the study period. Compared to 4 m and 7 m depth panels, the number of errant polychaetes on the long-term series (Figure 5B) was highest at 1 m depth (4 to 56 ind dm−2). However, on short-term panels, their numbers were between 2 and 5 ind dm−2 at 1 m (Figure 5A). The vertical pattern of errant polychaetes does not show a significant variation on short-term (F = 0.88; df = 2,33; P > 0.05) and long-term panels (F = 2.59; df = 2,57; P > 0.05). The important sedentary polychaete found on the panels was the tubiculous form belonging to the family Sabellariidae. The tubeworm recruitment on short-term panels (Figure 5C) was higher at 4 m (42 ind dm−2) and 7 m depth (26 ind dm−2) and was lowest at 1 m depth (2 ind dm−2). On long-term panels, only a few worms were observed at all three depths.
Vertical distribution of polychaetes on test panels. (A) Abundance of errant polychaetes on short-term panels; (B) abundance of errant polychaetes on long-term panels; (C) recruitment pattern of Sabellariids on short-term panels.

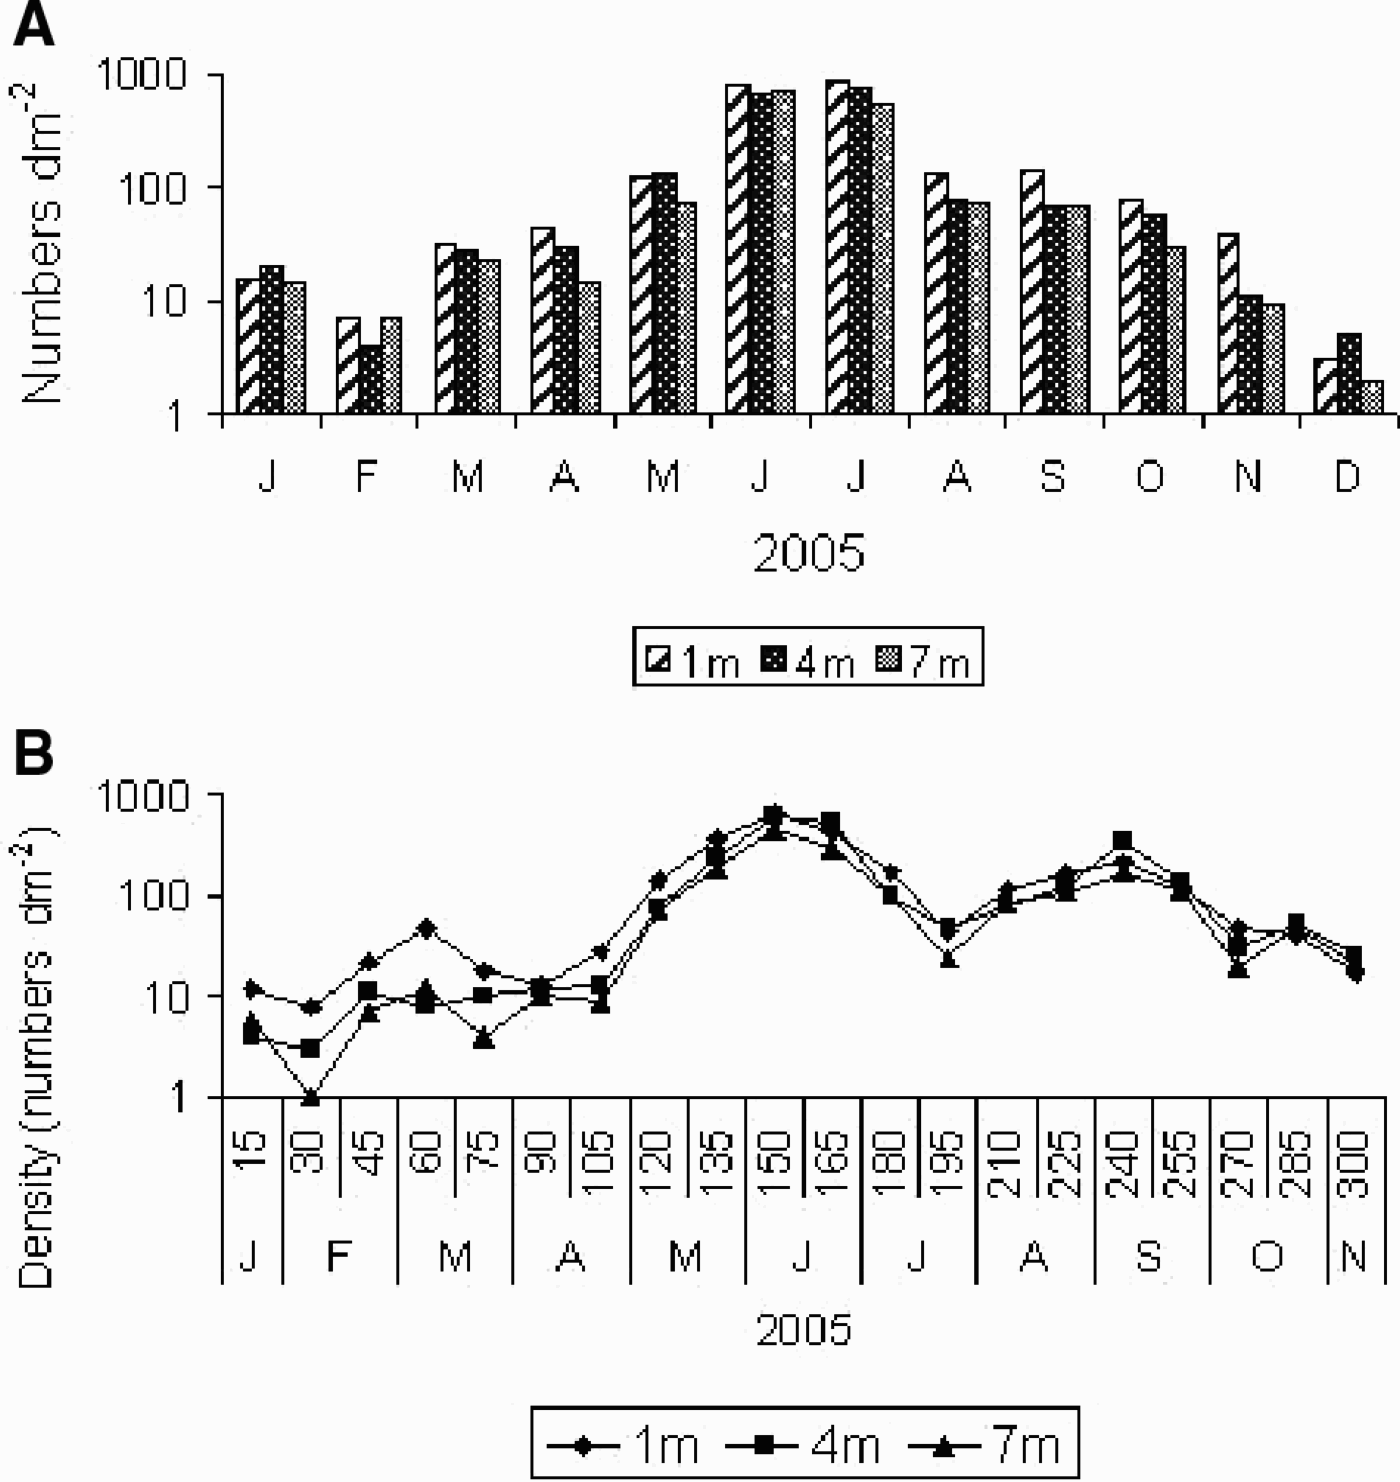
Amphipods did not show much depth-wise variation during this study period. On the short-term panels, the abundance of both errant and tube dwelling amphipods varied from 3 to 875 ind dm−2 at 1 m depth, 4 to 790 ind dm−2 at 4 m depth and 2 to 710 ind dm−2 at 7 m depth (Figure 6A). The density on the long-term series ranged between 8 and 669 ind dm−2 at 1 m depth, 3–612 ind dm−2 at 4 m depth and 1–470 ind dm−2 at 7 m depth (Figure 6B). Generally, amphipods were largely seen during June and July 2005 on panels suspended at all three depths. No significant depth-associated variation of amphipods was observed on short-term (F = 0.149; df = 2,33; P > 0.05) and long-term panels (F = 0.487; df = 2,57; P > 0.05).
Distribution of amphipods on (A) short-term and (B) long-term panels.

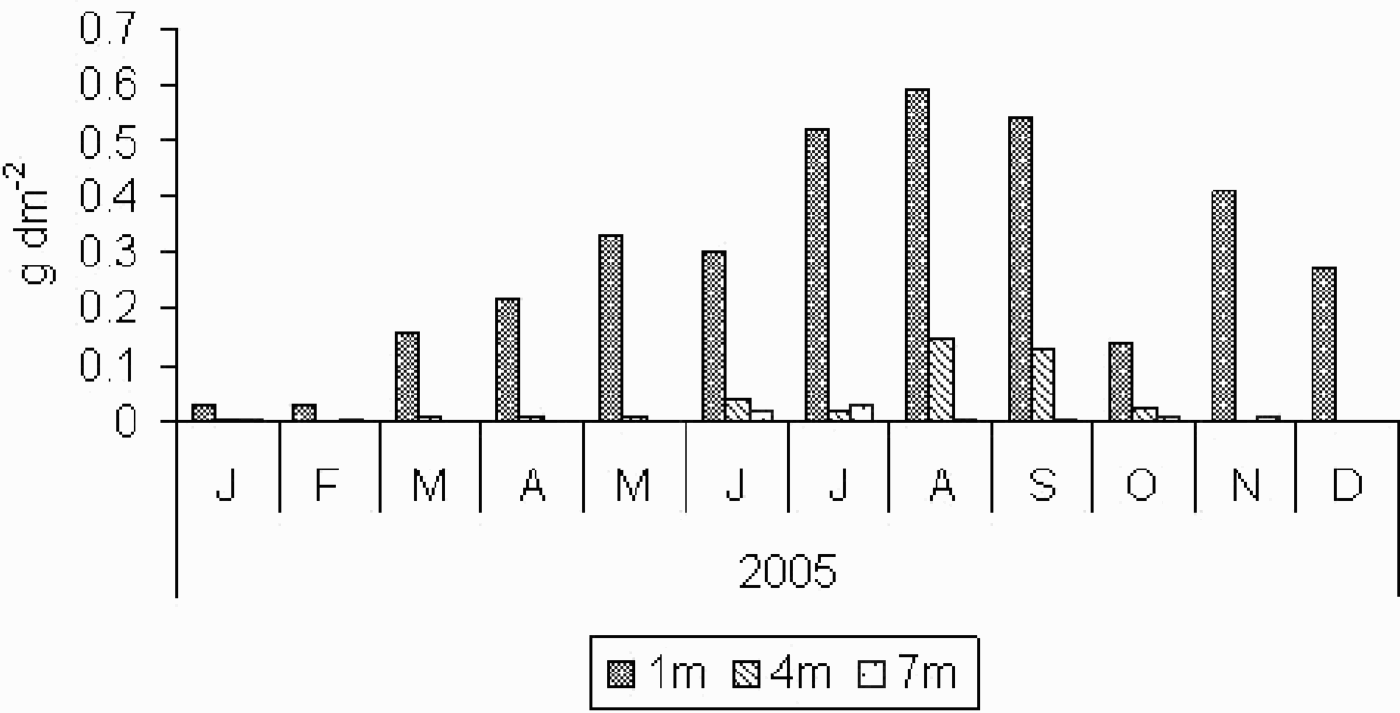
Seaweeds were another important fouling group and their contribution to the macrofouling community was highest at 1 m (3.01 g.dm−2) and lowest at 7 m (0.203 g.dm−2). The panels at 4 m depth showed the maximum algal biomass of 0.814 g.dm−2 (Figure 7). Seaweed settlement showed a significant depth-wise variation in recruitment on short-term panels (F = 24.9; df = 2,33; P < 0.05). The contribution of seaweeds to the fouling community on long-term panels was very low and hence their abundance was not considered.
Seaweed settlement on short-term panels.

DISCUSSION
The fouling community that developed on the panels submerged at Kudankulam was composed of species which were commonly reported from the east coast of India (Renganathan et al., Reference Renganathan, Nair and Dharmaraj1982; Rajagopal et al., Reference Rajagopal, Nair, Van der Velde and Jenner1997). The test panels exposed to assess the depth-wise variation in the recruitment of fouling community indicated that depth plays an important role in the development of fouling assemblages on hard surfaces. At 1 m depth, macro-algae, ascidians (Botryllus tuberatus and Diplosoma sp.) and amphipods were the dominant foulers. Barnacles, sabellariids and ascidians (Didemnum spp.) were abundant on 4 m and 7 m depth panels. In general, the fouling organisms were more abundant at 4 m than 1 m and 7 m depth. This pattern of depth-wise distribution of the biofouling community was also reported by Sasikumar et al. (Reference Sasikumar, Rajagopal and Nair1989) from the Kalpakkam coast.
Changes in community structure across a vertical gradient are generally related to the physical factors that vary with depth such as wave action and light attenuation (Witman & Dayton, Reference Witman, Dayton and Bertness2001). Light is an important factor in limiting the vertical distribution of epibenthic assemblages on hard surfaces. In the present study, the settlement of macro-algae on the panels suspended at 1 m depth may be due to the availability of optimum light for growth. The greater contribution of macroalgae in the fouling community at 1.5 m depth was also reported by Qvarfordt et al. (Reference Qvarfordt, Kautsky and Malm2006) in the Baltic Sea. The patterns observed in the current study may be due to the preferential settlement of species within a specific depth-range (Rule & Smith, Reference Rule and Smith2007). Previous work by Rajagopal et al. (Reference Rajagopal, Nair, Van der Velde and Jenner1997) showed that the barnacles and ascidians were abundant at 1 m and hydroids and bryozoans at 7 m depth in Kalpakkam coastal waters.
In the present study, the spatial scale of depth was not significant for monthly recruitment of barnacles. Depth variability was significant only on long-term panels. It has been reported that settlement of some barnacles is influenced by illumination. Brankevich et al. (Reference Brankevich, Bastida and Lemmi1988) and Sasikumar et al. (Reference Sasikumar, Rajagopal and Nair1989) observed that barnacles prefer illuminated areas. However, in the present study more barnacles settled on the panels suspended at 4 m and 7 m depth. This observation is in accordance with Daniel (Reference Daniel1963), who reported that Balanus amphitrite preferred to settle on the surface, where illumination is of moderate intensity.
Despite the lack of significant differences revealed by ANOVA on short-term recruitment, there were marked differences in species composition of ascidians between depths. Although ascidian tadpole larvae are known to have photopositive behaviour (Goodbody, Reference Goodbody1962), the higher abundance of Didemnum spp. on panels suspended at 4 m and 7 m depths may be due to the competition for space with algae. Amphipods, however, did not show any definite pattern in their distribution with depth.
In general, except for the total fouling biomass, the monthly recruitment data did not show significant variation between the depths. But the data obtained from the long-term panels showed significant variation in the recruitment of major fouling species such as barnacles and ascidians. This variability may be due to the post-settlement processes such as predation and competition. It is reasonable to assume that the macrofouling community of Kudankulam has evolved a strategy for colonization by some kind of vertical distribution to minimize the interspecific competition. However, it is only speculation and future studies incorporating the local hydrodynamic conditions along with post-settlement processes are required to obtain a clear conclusion.
ACKNOWLEDGEMENTS
We thank the Ministry of Earth Sciences, Government of India for providing financial assistance and two anonymous referees for comments.