Introduction
Commercial pollination by honey bees (Apis mellifera Linnaeus; Hymenoptera: Apidae) plays a major role in agriculture and sustains the yield and quality of many agricultural crops around the world (Klein et al. Reference Klein, Vaissière, Cane, Steffan-Dewenter, Cunningham, Kremen and Tscharntke2007). Lowbush blueberries (Vaccinium angustifolium Aiton (Ericaceae)) and cranberries (Vaccinium macrocarpon Aiton (Ericaceae)) are important berry crops in Canada that benefit from the presence of the non-native honey bee as a pollinator to ensure optimal fruit set and profitability (Darrach and Page Reference Darrach and Page2016). When honey bees are present as pollinators, lowbush blueberry fruit set improves by 70%, to almost 100% (Chagnon Reference Chagnon2008), and cranberry fruit set by up to 50% (Chagnon Reference Chagnon2007). Thus, pollination services are essential in Québec, Canada to ensure profitability of lowbush blueberry crops and cranberry crops. Renting colonies for pollination services is also a significant source of income for commercial beekeepers, representing 27% of the total revenues from all beekeeping activities in the province (Institut de la statistique du Québec 2018). Unfortunately, migratory beekeeping has shown to negatively affect the health of honey bees by disrupting oxidative stress levels (Simone-Finstrom et al. Reference Simone-Finstrom, Li-Byarlay, Huang, Strand, Rueppell and Tarpy2016).
Honey bees are generalist pollinators that feed on diversified plant species (Winston Reference Winston1987), and monofloral pollen diets do not provide sufficient nutrients to ensure good honey bee health (Alaux et al. Reference Alaux, Ducloz, Crauser and Le Conte2010; Di Pasquale et al. Reference Di Pasquale, Salignon, Le Conte, Belzunces, Decourtye and Kretzschmar2013, Reference Di Pasquale, Alaux, Le Conte, Odoux, Pioz and Vaissière2016). Pollen gathered by honey bees must meet minimum nutritional requirements of the colony, as pollen is the only source of protein (Herbert and Hill Reference Herbert, Hill and Graham2015). A variety of flowering plants must be available in the vicinity of colonies, because different pollen sources have different essential nutritional components, such as total proteins and specific amino acids (Alaux et al. Reference Alaux, Ducloz, Crauser and Le Conte2010). This is critical during pollination services to monocultural crops that offer a single pollen source that may not meet the nutritional requirements of honey bees (Naug Reference Naug2009; Donkersley et al. Reference Donkersley, Rhodes, Pickup, Jones, Power, Wright and Wilson2017). Thus, honey bees must forage on a variety of flower species to have a completely balanced diet (Singh and Singh Reference Singh and Singh1996). The degree to which pollen meets the nutritional requirements of honey bees is evaluated on its protein, amino acid, lipid, vitamin, and mineral content (Brodschneider and Crailsheim Reference Brodschneider and Crailsheim2010). Floral species offer an innate protein and amino acid content (Roulston et al. Reference Roulston, Cane and Buchmann2000) that honey bees are capable of detecting, and they forage for flower pollen based on colony nutritional needs (De Groot Reference De Groot1953; Cook et al. Reference Cook, Awmack, Murray and Williams2003; Nicolson and Human Reference Nicolson and Human2013).
When providing commercial pollination services for intensive agricultural crops, honey bees are often exposed to poorly diversified pollen sources that may lead them to lack essential nutrients (Brodschneider and Crailsheim Reference Brodschneider and Crailsheim2010; Colwell et al. Reference Colwell, Williams, Evans and Shutler2017). Honey bees require a minimum of 20% crude protein in pollen to satisfy colony brood rearing and development maintenance needs (Kleinschmidt et al. Reference Kleinschmidt, Kondos, Harden and Turner1974). Pollen with less crude protein content is considered to be of poor quality (Somerville and Nicol Reference Somerville and Nicol2006). As flowers offer pollen between 2% and 61% protein concentration depending on the species (McCaughey et al. Reference McCaughey, Gilliam and Standifer1980; Roulston et al. Reference Roulston, Cane and Buchmann2000; Nicolson and Human Reference Nicolson and Human2013), honey bees require a rich floral diversity to meet their protein needs. If harvested pollen has a low protein content, honey bees will increase their foraging effort (Pernal and Currie Reference Pernal and Currie2000) and collect a larger amount of pollen to compensate (Somerville Reference Somerville2001).
Pollen protein contains different amino acids in various proportions that are specific to flower species. De Groot (Reference De Groot1953) determined 10 amino acids essential for optimal honey bee development along with their respective minimum proportion (g/100 g of total protein) within the protein: isoleucine (4.0), valine (4.0), and leucine (4.5) are required in the greatest amounts (referred to as the most essential amino acids); tryptophan (1.0), histidine (1.5), and methionine (1.5) are required in the lowest amounts (referred to as the least essential amino acids); and the intermediate amino acids: phenylalanine (2.5), arginine (3.0), lysine (3.0), and threonine (3.0). If a pollen source has a total protein deficiency, there is also a risk of deficiencies in essential amino acids (Somerville Reference Somerville2001). These deficiencies may be mitigated by pollen of more than 25% total protein, pollen collected from a diverse flower sources, or an abundance of pollen collected by honey bees (Somerville Reference Somerville2005).
When a colony has a protein or an essential amino acid deficiency, the life span of the worker bees is shortened (Scofield and Mattila Reference Scofield and Mattila2015) and hypopharyngeal glands of nurse bees are atrophied (Standifer Reference Standifer1967; Di Pasquale et al. Reference Di Pasquale, Alaux, Le Conte, Odoux, Pioz and Vaissière2016), which leads to brood rearing impairments (Brodschneider and Crailsheim Reference Brodschneider and Crailsheim2010). Deficiencies in essential amino acids have been shown to reduce honey bee memory and foraging behaviour (Hendriksma and Shafir Reference Hendriksma and Shafir2016). The repercussions are greater if colonies are used for pollination services or infected by pathogens (Mattila and Otis Reference Mattila and Otis2006; Ferguson et al. Reference Ferguson, Northfield and Lach2018).
In this study, we followed honey bee colonies under four different management strategies for a one-year cycle and compared control colonies in a diversified farmland environment to colonies providing blueberry and/or cranberry pollination services. Our objectives were to 1) identify floral species and diversity of pollen harvested by honey bee colonies, 2) measure protein and essential amino acid content of collected pollen and beebread, and 3) explore the nutritional impact on honey bee colonies providing these pollination services. We predicted that most of the pollen harvested would come from the main berry crop and that floral diversity would be inferior in pollinated crops compared to a diversified farmland environment. We also presumed that lower floral diversity would have an impact on the total protein and essential amino acid composition of harvested pollen and stored bee bread and reduce honey bee colony development.
Material and methods
Experimental treatments and colony management
Honey bee colonies were owned by our research centre (Centre de recherche en sciences animales de Deschambault, Deschambault, Québec, Canada), and verbal agreements were taken with the landowners of the various apiaries. Three honey bee voucher specimens were sent to the Ouellet-Robert entomological collection at the Institut de recherche en biologie végétale, Université de Montréal, Montréal, Québec, Canada (coded QMOR57263, QMOR57264, and QMOR57265).
Twenty colonies of similar strength (total brood area) were selected from among the livestock at our bee research facility. Young sister queens had been introduced in these colonies in July 2015. These queens were hybrid Italian selected stock from our honey bee breeding programme. Colonies were randomly assigned to the following different management strategies (five colonies/management strategy): A) control management strategy (no pollination); B) blueberry management strategy (blueberry crop pollination); C) cranberry management strategy (cranberry crop pollination); and D) double management strategy (blueberry pollination followed by cranberry pollination).
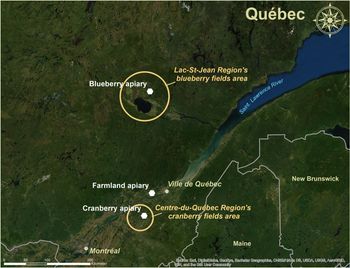
Field work was conducted between May 2016 and May 2017 at three different apiary sites in Québec: a diversified farmland area (composed of different small crops mixed with natural and free growing lands) that served as the farmland apiary in Pont-Rouge (46°45′25.129″N and 71°39′49.966″W), a commercial lowbush blueberry field in St-Ludger-de-Milot in the Lac-St-Jean region (48°52′42.292″N and 71°50′6.462″W) (from 7 June 2016 to 23 June 2016), and a commercial cranberry field in Notre-Dame-de-Lourdes in the Centre-du-Québec region (46°16′37.274″N and 71°52′19.753″W) (from 24 June 2016 to 19 July 2016). Location of apiaries was selected to represent the standard agricultural profile of regional farmland, lowbush blueberry, and cranberry fields (Fig. 1).
Location of the farmland, lowbush blueberry field, and cranberry field apiaries, within the most important regions for lowbush blueberry and cranberry production in Québec, Canada. Map was created using ArcGIS software by Esri (www.esri.com).

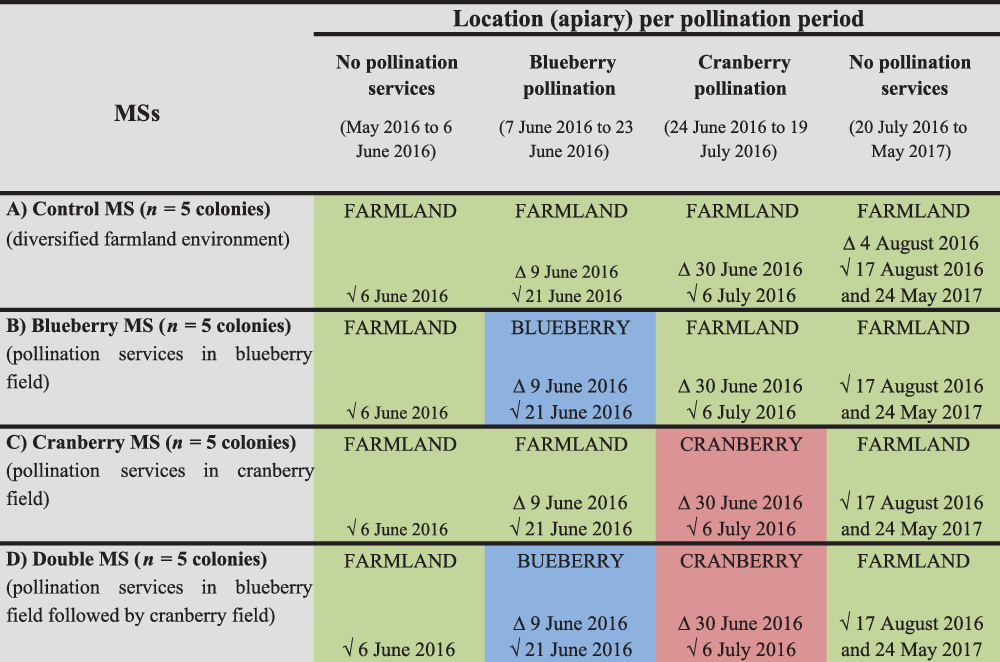
At the beginning of the study, in May 2016, all colonies started at the farmland apiary (20 colonies). One group of five colonies remained at this site for the entire study (control management strategy; n = five colonies), while 15 of them were transported following the dates presented in Figure 2 to provide pollination services for blueberries (blueberry management strategy; n = five colonies), cranberries (cranberry management strategy; n = five colonies) or both (double management strategy; n = five colonies) according to the management strategy schedule (Fig. 2). Colonies were moved at night (between 11 PM and 5 AM) on an open truck. From 20 May to 25 August 2016, all colonies were comprised of two brood chambers, while honey supers were added when needed. At the beginning of September, honey supers were removed, and colonies were reduced to one brood chamber. Fall feeding started in mid-September 2016 and all colonies were given 24 L of sucrose 2:1 solution using a top box feeder (Wooden Miller feeder FE-1100; Propolis-etc, Beloeil, Québec, Canada). Colonies received a Thymovar anti-Varroa Oudemans (Acari: Varroidae) treatment starting on 12 September 2016, followed by an oxalic acid treatment on 5 November 2016 (drip method: 35 g/L in a sucrose 1:1 solution, 5 mL between frames of the hive body crowded with honey bees). Colonies were wintered indoors in an environmentally controlled room (4–5 ºC, 50–60% relative humidity) from 14 November 2016 to 19 April 2017 and then moved in a spring apiary in Deschambault, Québec near the honey bee research facility until May 2017.
Colony management strategy (MS) (n = 5 colonies per MS). Pollination MS (blueberry MS, cranberry MS, and double MS) colonies were moved from one apiary to another following this schedule. When colonies were not providing pollination services, they were located at the farmland apiary. √ (and dates) indicates when pollen and bee bread samples were collected and Δ (and dates) indicates when only pollen samples were collected.

Pollen sampling and palynology
Hives were equipped with pollen traps (wooden entrance pollen traps PT-1100; Propolis-etc) installed at the beginning of the experiment (14 May 2016) and activated for 48 hours at a time following a sampling schedule (Fig. 2). For each colony and each sampling date, two samples were taken: one for palynology analysis (10 grams) and one for nutrient analysis (5 grams). Pollen samples were rapidly frozen on dry ice and stored in a freezer (−20 °C) until analysis.
A total of 132 pollen samples from pollen traps were analysed using a standard palynology method. From each 10-gram sample, two 1-gram subsamples were removed (Louveaux Reference Louveaux1958). The pollen grains were first sorted by their colours (under regular and ultraviolet lights), and a volume of 1/8 mm3 of pollen grains from each colour was mounted on a microscope slide using glycerin gelatin dyed with fuchsin (Maurizio et al. Reference Maurizio, Louveaux and Vorwohl1978). An optic microscope (approximately 1000 Å) was used to identify the pollen grains to the plant species level when possible, and otherwise to the genera or the family level, using a collection of references and a taxonomic key (Moore and Webb Reference Moore and Webb1978; Girard et al. Reference Girard, Chagnon and Fournier2012), and then compiled in a spreadsheet. Pollen identification was performed by a professional palynologist, Mélissa Girard (Centre de recherche en sciences animales de Deschambault). Voucher specimens used for our palynology study consisting in permanently mounted pollen slides are available on demand from authors, and a photographic pollen identification catalogue is also available.
Pollen diversity index
Diversity of pollen harvested by each colony was calculated following our sampling schedule. The Shannon diversity index (H) was calculated as
 $$H^{\prime} = - \mathop \sum \limits_{i = 1}^S {p_i}{\rm{ln}}\left( {{p_i}} \right)$$
p is the proportion of pollen pellets of a given pollen plant species divided by the total number of pollen pellets counted for that species.
Bee bread sampling
One frame from the brood box in the hive with an area large enough (full strip around the brood) to provide at least 5 g of freshly stored bee bread (approximately 15 cells) was selected. Bee bread was collected by scraping the contents of the cells with a disposable plastic microspatula. The sample was transferred into a prelabelled plastic 59-mL vial. The samples were rapidly frozen on dry ice and stored in a freezer (−20 °C) until analysis.
Protein and amino acid analysis (pollen and bee bread)
Harvested pollen (n = 160) and bee bread (n = 93) samples were analysed by POS-Bio-Sciences Laboratory (118 Veterinary Road, Saskatoon, Saskatchewan, Canada). The procedure for the amino acid extraction included three types of hydrolysis: 1) an acid hydrolysis resulting in identification of 15 amino acids: aspartic acid, glutamic acid, serine, glycine, histidine, arginine, threonine, alanine, proline, tyrosine, valine, isoleucine, leucine, phenylalanine, and lysine; 2) a base hydrolysis resulting in identification of one amino acid: tryptophan; 3) a preoxidised hydrolysis resulting in identification of two amino acids: cystine and methionine. Following hydrolysis, samples were analysed on a high-performance liquid chromatography system with a photodiode array detector (Bidlingmeyer et al. Reference Bidlingmeyer, Cohen, Tarvin and Frost1987; Landry and Delhaye Reference Landry and Delhaye1994).
Nonprotein nitrogen was calculated as the difference between total nitrogen (Kjeldahl analysis) and amino acid nitrogen (high-performance liquid chromatography analysis). Crude protein values were calculated after correcting total nitrogen estimates for nonprotein nitrogen (Stabler et al. Reference Stabler, Power, Borland, Barnes and Wright2018).
Honey bee brood population
Brood population surface area is a good indicator of development impairment due to a lack of protein, as honey bee colonies require sufficient protein for proper larval development (Brodschneider and Crailsheim Reference Brodschneider and Crailsheim2010). The area occupied by immature worker honey bees (eggs + larvae + capped brood) in each colony was evaluated by measuring width and length of the brood surface area on each side of every brood frame. The rectangular surface obtained was multiplied by 0.8 to compensate for the elliptic form of the brood pattern. These values were added in order to calculate the total brood surface in each colony. A factor of 25 worker cells per 6.25 cm2 (i.e., a square inch) was used to convert the area to obtain the number of immature worker honey bees (Giovenazzo and Dubreuil Reference Giovenazzo and Dubreuil2011; Delaplane et al. Reference Delaplane, van der Steen and Guzman-Novoa2013).
Statistical analysis
Our experimental model considers the honey bee colonies as experimental units (Hurlbert Reference Hurlbert1984; Davies and Gray Reference Davies and Gray2015). This assumption is based on the following knowledge of bee colony foraging behaviour: bees from each colony have a foraging environment beyond each apiary (up to 5-km radius (Visscher and Seeley Reference Visscher and Seeley1982; Beekman and Ratnieks Reference Beekman and Ratnieks2000; von Frisch Reference von Frisch2011; Couvillon et al. Reference Couvillon, Riddell Pearce, Accleton, Fensome, Quah, Taylor and Ratnieks2014)) and the bees from each colony within an apiary will visit different plants (Brodschneider and Crailsheim Reference Brodschneider and Crailsheim2010; Di Pasquale et al. Reference Di Pasquale, Salignon, Le Conte, Belzunces, Decourtye and Kretzschmar2013). Because colonies were not moved in different lowbush blueberry or cranberry fields, we expect variability between colonies to be smaller than the one that could be observed when colonies are moved to different fields, and this leads to more liberal tests. To account for this kind of pseudoreplication, we fixed the significance level at α = 0.01, instead of 0.05, to reinforce the findings of our research even though we know that the inference is valid only for the selected lowbush blueberry and cranberry fields.
Data were analysed using a two-way analysis of variance model with repeated measurements. In this model, the treatment is the between-subject factor, while the time is the within-subject factor. Interaction between treatment and time is also considered in this model in order to compare the treatment profiles over time. The treatment structure involves four qualitative treatments with five colonies in each one. Colonies are thus nested within treatment, and this factor is considered as random in the model. The treatments are the following: A) control management strategy (located in the farmland apiary for the whole study); B) blueberry management strategy (located in the farmland apiary before and after the blueberry pollination and in the blueberry apiary during the blueberry pollination); C) cranberry management strategy (located in the farmland apiary before and after the cranberry pollination and in the cranberry apiary during the cranberry pollination); and D) double management strategy (located in the farmland apiary before and after both the blueberry and cranberry pollination; in the blueberry apiary during the blueberry pollination; and in the cranberry apiary during the cranberry pollination). Since measurements are taken on the same colonies over time, there is a correlation between those measurements. The structure of correlation that best fit the data was chosen based on the Akaike information criterion. Tests for normality and homogeneity of variance were carried out on the residuals of each model. Following a significant effect in the model, post hoc Tukey’s tests (honestly significant difference) were performed for comparing differences between treatments and time. Means are reported ± standard error. Finally, all analyses were performed using SAS (SAS Institute 2018) through the mixed procedure at the 0.01 level of significance.
Results
Diversity of harvested pollen
We identified harvested pollen by honey bees from 56 different plant taxa. Twenty-nine were identified to the species, 24 to the genera, and three to the family (Figs. 3–7). This includes all samples within the three apiaries over the whole study period.
Floral pollen sources (palynology analysis results) and relative abundance (%) at the control site apiary in May 2016.

Floral pollen sources (palynology analysis results) and relative abundance (%) per apiary (control site and lowbush blueberry) during lowbush blueberry pollination. Pollen diversity harvested from colonies in the control farmland apiary are shown for each period (green bars) and compared to pollen diversity harvested from colonies during lowbush blueberry pollination (blue bars).

Floral pollen sources (palynology analysis results) and relative abundance (%) per apiary (control site and cranberry) during cranberry pollination. Pollen diversity harvested from colonies in the control farmland apiary is shown for each period (green bars) and compared to pollen diversity harvested from colonies during cranberry pollination (red bars).

Floral pollen sources (palynology analysis results) and relative abundance (%) at the control site apiary in late summer 2016.

Floral pollen sources (palynology analysis results) and relative abundance (%) at the control site apiary in May 2017.

During lowbush blueberry pollination, 90% of all harvested pollen consisted of nine genera/species: Carex Linnaeus (Cyperaceae) species (30%), Vaccinium angustifolium (14%), Chamaedaphne calyculata (Linnaeus) Moench (Ericaceae) (13%), Kalmia Linnaeus (Ericaceae) species (8%), Rhododendron groenlandicum (Oeder) Kron and Judd (Ericaceae) (7%), Viburnum Linnaeus (Viburnaceae) species (6%), Cornus Linnaeus (Cornaceae) species (5%), Rubus Linnaeus (Rosaceae) species (4%), and Pinus Linnaeus (Pinaceae) species (3%). Most of these species are from wetland flowering plants belonging to the Ericaceae surrounding the commercial lowbush blueberry fields (Fig. 4, blue bars). During cranberry pollination, pollen mainly came from cranberry flowers (66%) and plants from the Brassicaceae (24%) (Fig. 5, red bars).
In the farmland apiary, there was a regular seasonal sequence of well-known floral species commonly found in the agricultural environment of central Quebec (Moisan-De Serres et al. Reference Moisan-De Serres, Bourgouin and Lebeau2014). During springtime, pollen was different between 2016 and 2017 because of the timing of both spring arrival and sampling. The pollen taxa harvested in 2017 indicate a late spring with more trees and dandelion pollen (Prunus pensylvanica Linnaeus (Rosaceae) (37%), Acer Linnaeus (Sapindaceae) species (31%), Taraxacum officinale Wiggers (Asteraceae) (25%), and Crataegus Linnaeus (Rosaceae) species (1%)). The farmland apiary spring 2016 pollen taxa are typical of an early spring with less dandelion bloom (Crataegus species (53%), Malus Miller (Rosaceae) species (21%), Taraxacum officinale (10%), Fragaria Linnaeus (Rosaceae) species (8%)) (Figs. 3, 7). During pollination services and late summer, many flowers made up the bee collected pollen. In June, harvested pollen came from Crataegus species (28%), Rubus species (15%), Malus species (12%), Geum Linnaeus (Rosaceae) species (8%), and 18 other family/genus/species (Fig. 4, green bars). In July, harvested pollen came from Trifolium repens Linnaeus (Fabaceae) (30%), Trifolium pratense Linnaeus (Fabaceae) (18%), undetermined Brassicaceae (17%), Thalictrum Linnaeus (Ranunculaceae) species (9%), and eight other genera/species (Fig. 5, green bars). In August, harvested pollen came from Ilex Linnaeus (Aquifoliaceae) species (33%), Crataegus species (27%), Solidago Linnaeus (Asteraceae) species (11%), Euthamia graminifolia (Linnaeus) Nuttall (Asteraceae) (4%), and 13 other genera/species (Fig. 6).
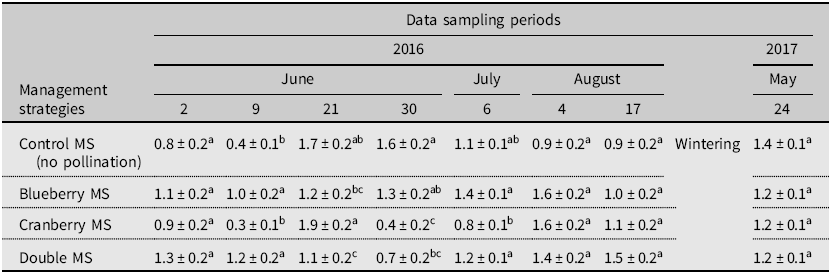
In early June (2 June 2016), when all colonies were stationary at the farmland apiary, the Shannon diversity index was not significantly different between management strategies (Table 1). When lowbush blueberry pollination services began, pollen harvested by the colonies in the blueberry apiary had a significantly higher Shannon diversity index (1.0 ± 0.2 and 1.2 ± 0.2) than those at the farmland apiary (0.4 ± 0.1 and 0.3 ± 0.1) (F(3,98) = 9.25; P < 0.0001) (9 June 2016) (Table 1). During the last week of lowbush blueberry pollination (21 June 2016), Shannon diversity index of the pollen harvested in the farmland apiary increased (1.7 ± 0.2 and 1.9 ± 0.2) and significantly exceeded the blueberry apiary (1.2 ± 0.2 and 1.1 ± 0.2) (F(3,98) = 5.43; P < 0.01) (Table 1). When cranberry pollination began in late June, pollen harvested by the colonies in the cranberry apiary had a significantly lower Shannon diversity index (0.4 ± 0.2 and 0.7 ± 0.2) than those at the farmland apiary (1.6 ± 0.2 and 1.3 ± 0.2) (F(3,98) = 10.79; P < 0.0001) (30 June 2016) (Table 1). During the last week of cranberry pollination (6 July 2016), the only harvested pollen with a significantly lower Shannon diversity index was from the cranberry apiary (0.8 ± 0.1), whereas all others had a higher Shannon diversity index (1.1 ± 0.1; 1.4 ± 0.1; 1.2 ± 0.1) (F(3,98) = 7.00; P < 0.001) (Table 1). After pollination services, when all colonies were stationary again at the farmland apiary (August 2016 to May 2017), their Shannon diversity index was similar (no significant differences) (Table 1).
Shannon diversity index (mean index ± standard error) for each management strategy (n = 5 colonies per MS) before pollination, during lowbush blueberry and cranberry pollination, after pollination, and after wintering (from 2 June 2016 to 24 May 2017)*.

Significant differences between treatments are shown with different letters (P < 0.01 based on post hoc Tukey’s test (honestly significant difference)) (F(3,98) = 9.25, P < 0.001 (9 June 2016); F(3,98) = 5.43, P < 0.01 (21 June 2016); F(3,98) = 10.79, P < 0.001 (30 June 2016); F(3,98) = 7.00, P < 0.001 (6 July 2016)).
* Cell colour indicates the apiary where the colonies are located (green = farmland apiary; blue = blueberry apiary; red = cranberry apiary).
MS, management strategy.
Protein in harvested pollen and bee bread
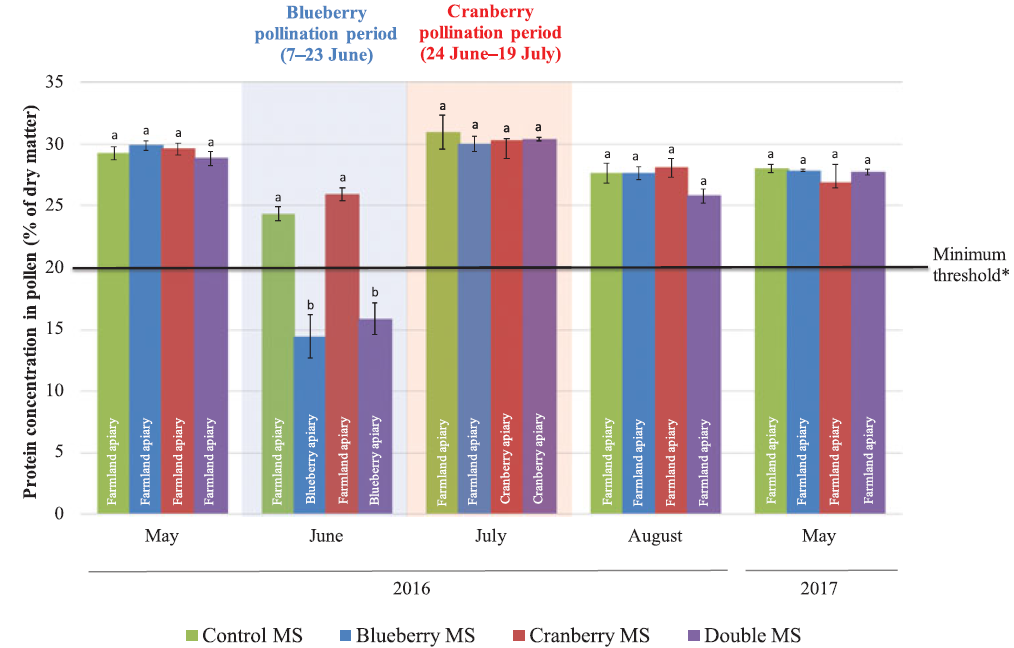
The pollen harvested during the lowbush blueberry pollination services (Fig. 8; blueberry management strategy and double management strategy) had total protein concentrations significantly lower compared to pollen harvested at the farmland apiary, and concentrations were below the 20% minimum protein requirements for honey bees (Kleinschmidt et al. Reference Kleinschmidt, Kondos, Harden and Turner1974). Indeed, protein concentrations in harvested pollen were 14.5 ± 1.8% and 15.9 ± 1.3% (blueberry management strategy and double management strategy) compared to 24.3 ± 0.6% and 26.0 ± 0.6% from the farmland apiary colonies (control management strategy and cranberry management strategy) (mean% ± standard error) (F(3,103) = 26.90; P < 0.001) (June 2016). During the cranberry pollination services, there was no significant difference in the protein concentrations between management strategies, and they were higher than the minimum threshold of 20% (Fig. 8). After both pollination services and when all colonies were back at the farmland apiary (August 2016 to May 2017), protein concentrations were similar between management strategies (no significant differences) (Fig. 8).
Protein concentration (% of dry matter) in pollen harvested by honey bees (mean concentration in % ± standard error) for each management strategy (MS) (n = 5 colonies per MS) before pollination, during lowbush blueberry and cranberry pollination, after pollination, and after wintering (from May 2016 to May 2017). Significant differences between treatments are shown with different letters (P < 0.01 based on post hoc Tukey’s test (honestly significant difference)) (F(3, 103) = 26.90, P < 0.0001 (June 2016)). *Minimum threshold of 20% protein of dry matter (Kleinschmidt et al. Reference Kleinschmidt, Kondos, Harden and Turner1974).

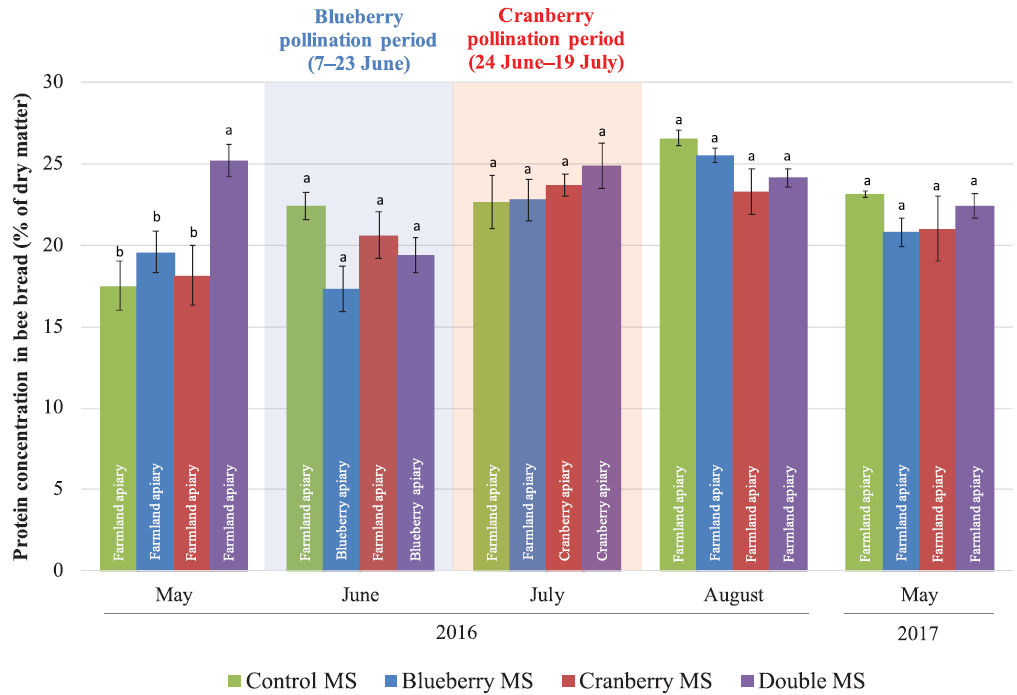
Protein concentrations in bee bread sampled in May 2016 were significantly different between management strategies despite the fact that they were all located in the farmland apiary (Fig. 9) (F(3,56) = 8.84; P < 0.001). When pollination services began, bee bread from colonies in the blueberry apiary (blueberry management strategy and the double management strategy) was low but was not significantly lower (F(3,56) = 3.69; P = 0.02) than for colonies in the farmland apiary at the same time (e.g., control management strategy and cranberry management strategy). Afterwards, bee bread protein levels were similar between management strategies (August 2016 and May 2017).
Protein concentration (% of dry matter) in bee bread (mean concentration in % ± standard error) for each management strategy (MS) (n = 5 colonies per MS) before pollination, during lowbush blueberry and cranberry pollination, after pollination, and after wintering (from May 2016 to May 2017). Significant differences between treatments are shown with different letters (P < 0.01 based on post hoc Tukey’s test (honestly significant difference)) (F(3,56) = 8.84, P < 0.001 (May 2016)).

Essential amino acids in harvested pollen and bee bread
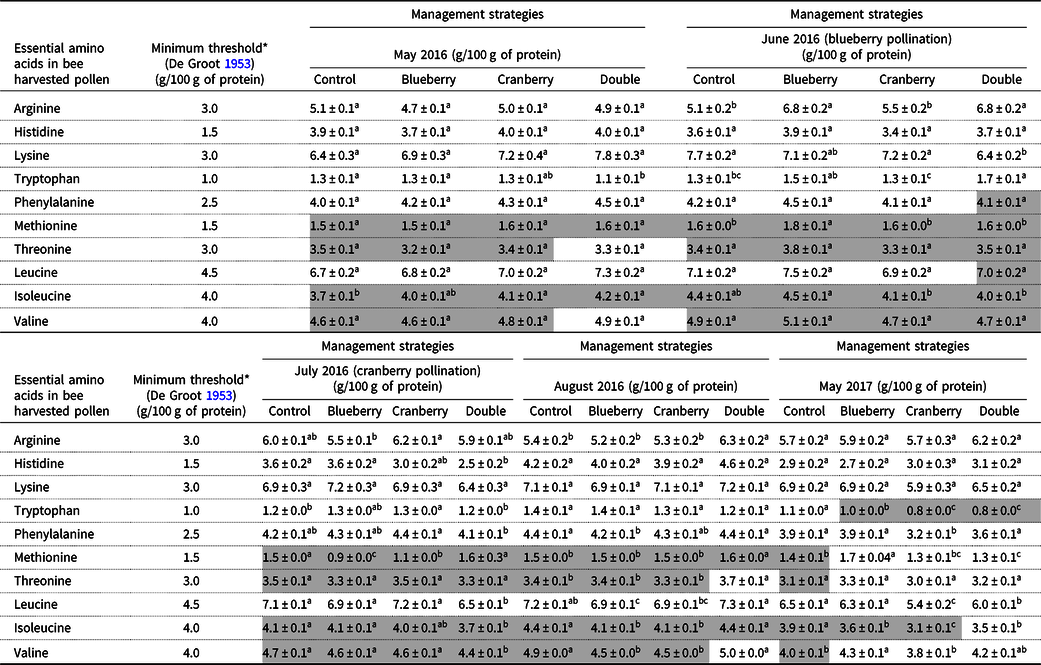
Pollen harvested in May 2016 at the farmland apiary (all colonies) showed significant differences of two essential amino acids (tryptophan (F(3,103) = 4.69, P < 0.01) and isoleucine (F(3,103) = 5.37, P < 0.01)) between the colonies of the different management strategies, and values of four essential amino acids were below the minimum thresholds (methionine, threonine, isoleucine, and valine).
The pollen harvested in June 2016 at the blueberry apiary (blueberry management strategy and/or double management strategy) had significant differences in five essential amino acids (arginine (F(3,103) = 23.11, P < 0.001), lysine (F(3,102) = 9.14, P < 0.001), tryptophan (F(3,103) = 12.57, P < 0.001), methionine (F(3,103) = 8.57, P < 0.001), and isoleucine (F(3,103) = 4.75, P < 0.01)) compared to pollen harvested at the farmland apiary (control management strategy and/or cranberry management strategy). Concentrations of four essential amino acids were below the minimum thresholds for all management strategies (methionine, threonine, isoleucine, and valine) and two essential amino acids were below the minimum thresholds for the double management strategy (phenylalanine and leucine) (Table 2).
Essential amino acid concentrations in pollen harvested by honey bees (mean g/100 g of protein ± standard error) for each management strategy (n = 5 colonies per MS) before pollination, during lowbush blueberry and cranberry pollination, after pollination, and after wintering (from May 2016 to May 2017).

Significant differences between treatments are shown with different letters (P < 0.01 based on post hoc Tukey’s test (honestly significant difference)).
* A minimum threshold for each essential amino acids is in relation to tryptophan = 1.0 (De Groot Reference De Groot1953); the amino acids with concentrations below the minimum relative thresholds, based on tryptophan = 1.0, are in grey; colours indicate the apiary (green = farmland apiary, blue = blueberry apiary, red = cranberry apiary).
MS, management strategy.
The pollen harvested in July 2016 at the cranberry apiary (cranberry management strategy and/or double management strategy) had significant differences in seven essential amino acids (arginine (F(3,103) = 4.57, P < 0.01), histidine (F(3,103) = 7.45, P < 0.001), tryptophan (F(3,103) =4.55, P < 0.01), methionine (F(3,103) = 89.78, P < 0.001), leucine (F(3,103) = 14.76, P < 0.001), isoleucine (F(3,103) = 8.01, P < 0.001), and valine (F(3,103) = 5.82, P < 0.001)) compared to pollen at the farmland apiary (control management strategy and/or blueberry management strategy). Concentrations of four essential amino acids were below the minimum thresholds (methionine, threonine, isoleucine, and valine) (Table 2).
After pollination services, pollen harvested in August 2016 at the farmland apiary (all colonies) showed significant differences in seven essential amino acids (arginine (F(3,103) = 4.49, P < 0.01), phenylalanine (F(3,102) = 4.43, P < 0.01), methionine (F(3,103) = 10.58, P < 0.001), threonine (F(3,103) = 7.10, P < 0.001), leucine (F(3,103) = 7.37, P < 0.001), isoleucine (F(3,103) = 15.76, P < 0.001), and valine (F(3,103) = 31.94, P < 0.001)) between colonies of different management strategies, and concentrations of four essential amino acids were below the minimum thresholds (methionine, threonine, isoleucine, and valine) (Table 2).
Pollen harvested the following year in May 2017 at the farmland apiary (all colonies) showed significant differences in six essential amino acids (tryptophan (F(3,103) = 28.39, P < 0.001), phenylalanine (F(3,102) = 8.46, P < 0.001), methionine (F(3,103) = 18.91, P < 0.001), leucine (F(3,103) = 13.41, P < 0.001), isoleucine (F(3,103) = 16.31, P < 0.001), and valine (F(3,103) = 5.60, P < 0.01)) between various management strategies, and concentrations of five essential amino acids were below the minimum thresholds (tryptophan, methionine, threonine, isoleucine, and valine) (Table 2).
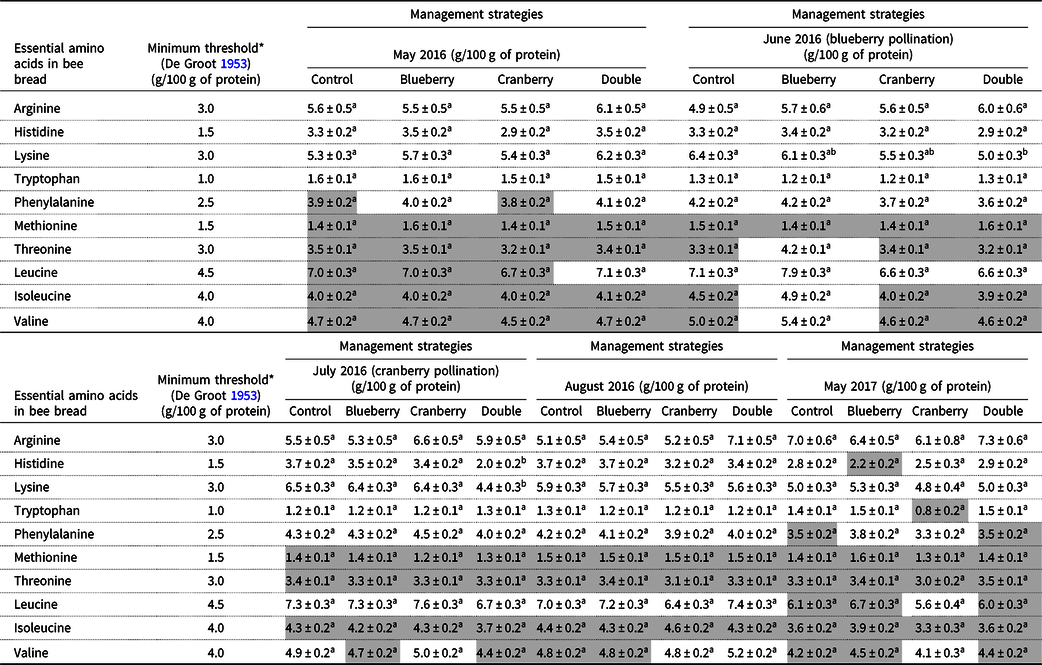
In May 2016, bee bread at the farmland apiary (all colonies) showed no significant differences among different management strategies, but concentrations of six essential amino acids were below the minimum thresholds (phenylalanine, methionine, threonine, leucine, isoleucine, and valine) (Table 3). In June 2016, bee bread at the blueberry apiary (blueberry management strategy and double management strategy) showed significant differences in the essential amino acid lysine (F(3,56) = 4.29, P < 0.01). Concentrations of four essential amino acids were below the minimum thresholds (methionine, threonine, isoleucine, and valine) (Table 3). In July 2016, bee bread at the cranberry apiary (cranberry management strategy and double management strategy) showed significant differences in the concentrations of two essential amino acids (histidine (F(3,56) = 15.96, P < 0.001)) and lysine (F(3,56) = 13.01, P < 0.001)). Concentrations of four essential amino acids were below the minimum thresholds (methionine, threonine, isoleucine, and valine) (Table 3).
Essential amino acid concentrations in bee bread (mean g/100 g of protein ± standard error) for each management strategy (n = 5 colonies per MS) before pollination services, during lowbush blueberry and cranberry pollination, and after pollination, until May 2017.

Significant differences between treatments are shown with different letters (P < 0.01 based on post hoc Tukey’s test (honestly significant difference)).
* Minimum relative threshold for each essential amino acids is in relation to tryptophan = 1.0 (De Groot Reference De Groot1953); the amino acids with concentrations below the minimum relative thresholds, based on tryptophan = 1.0, are in grey; colors indicate the apiary (green = farmland apiary, blue = blueberry apiary, red = cranberry apiary).
MS, management strategy.
After pollination services, bee bread at the farmland apiary (all colonies) showed no significant differences in the concentration of essential amino acids. Concentrations of four essential amino acids were below the minimum thresholds (methionine, threonine, isoleucine, and valine) (Table 3). In May 2017, after wintering, there were no significant differences in any of the 10 essential amino acids. Values of eight essential amino acids were below the minimum thresholds (histidine, tryptophan, phenylalanine, methionine, threonine, leucine, isoleucine, and valine) (Table 3).
Honey bee brood population
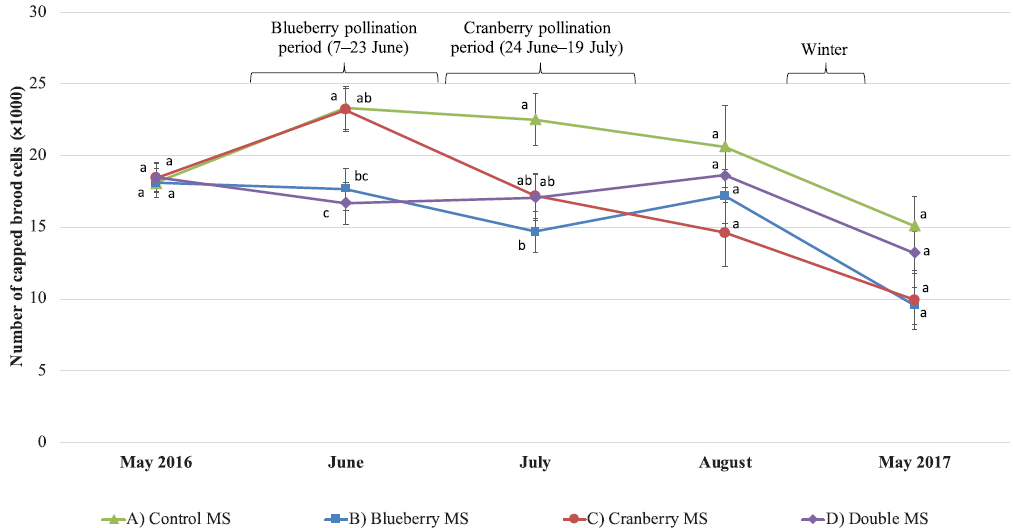
Results showed a significant difference between colonies of various management strategies during lowbush blueberry pollination services (Fig. 10): the surface of capped brood was lower for the blueberry management strategy and the double management strategy, compared to colonies of the other management strategies (F(3,48) = 5.72, P = 0.002). Control colonies in the farmland apiary had highest brood production throughout the experiment (from May 2016 to May 2017).
Brood population. Changes in the sealed brood population of honey bee colonies (mean number of brood cells ± standard error) for each management strategy (n = 5 colonies per management strategy), including surveys before pollination services, during lowbush blueberry and cranberry pollination, and after pollination, until May 2017. Significant differences between treatments are shown with different letters (P < 0.01 based on post hoc Tukey’s test (honestly significant difference)) (F(3,48) = 5.72, P < 0.01 (June 2016); F(3,48) = 3.80, P = 0.01 (July 2016)). A, control management strategy. B, blueberry management strategy. C, cranberry management strategy. D, double management strategy.

Discussion
Our first objective was to identify floral species and diversity of the pollen harvested by colonies in each management strategy. We hypothesised that honey bee colonies would harvest less diversified pollen during provision of pollination services in blueberries or cranberries compared to a rich farmland environment. We also predicted the dominant pollen species harvested would correspond to the pollinated crops. The latter hypothesis was confirmed during cranberry pollination, where two-thirds of the pollen came from the cranberry flowers. The remaining portion of pollen (24%) came from flowers of only one other family, Brassicaceae. The lower pollen diversity in the cranberry field was confirmed by the palynology analysis and the Shannon index. During pollen dearth, bees increase their foraging territory (Danner et al. Reference Danner, Keller, Hartel and Steffan-Dewenter2017), but we observed that only 7% of the cranberry field landscape in a 5-km radius offered good foraging potential for the honey bee colonies.
Pollen harvested during early pollination in blueberries was more diversified compared to the farmland apiary for the same period. This was also observed in another study realised in the same region with the same crop (Girard et al. Reference Girard, Chagnon and Fournier2012). However, our results were contrary to those of a study conducted in New Brunswick, Canada that showed more flower taxa within a cranberry field compared to a lowbush blueberry field (Colwell et al. Reference Colwell, Williams, Evans and Shutler2017). This indicates that different commercial lowbush blueberry and cranberry fields may have different surrounding floral diversities and that they are probably associated with the local geographical characteristics. Therefore, a complete analysis of the landscape should be performed prior to providing pollination services in order to characterise the foraging potential of honey bee colonies.
Colwell et al. (Reference Colwell, Williams, Evans and Shutler2017) found that pollen harvested by honey bee colonies during provision of pollination services in lowbush blueberries and cranberries contained low amounts from the flowers of these crops. Our findings corroborated the former but not the latter: cranberry pollen was the most important pollen collected by honey bees, accounting for 66% of the total pollen. Colwell et al. (Reference Colwell, Williams, Evans and Shutler2017) explained the lack of cranberry pollen by the fact that it requires buzz pollination (Javorek et al. Reference Javorek, Mackenzie and Kloet2002). Taking this information into account, we suggest that, in our study, honey bees foraged intensively on cranberry flowers because of poor floral availability, certainly requiring more energy on an individual and colony basis. During provision of pollination services to lowbush blueberries, lowbush blueberry pollen accounted for 14% of harvested pollen. It has been suggested that honey bees harvest more pollen from lowbush blueberry flowers than traps will collect because of the small size of the lowbush blueberry pollen pellets (Girard et al. Reference Girard, Chagnon and Fournier2012). These small pellets are not always scraped off the corbiculae when honey bees pass through the pollen traps and are therefore not accounted for. Our hypothesis stating the pollinated crop will be the dominant species of pollen gathered by honey bees during provision of pollination services is difficult to verify in the case of lowbush blueberries but was confirmed for the cranberry crop. We also predicted that honey bee colonies would harvest pollen from a lower diversity of flowers during provision of pollination services to blueberries or cranberries compared to the farmland apiary. This was found to be true for the immediate vicinity of the cranberry crop and for the second phase of lowbush blueberry pollination, but during its first phase, there was greater flower diversity in the vicinity of the blueberry apiary.
Protein in pollen and bee bread
Our second objective was to measure protein and amino acid concentrations in collected pollen and bee bread of colonies in different management strategies during the beekeeping season. Pollen harvested by colonies during provision of pollination services to lowbush blueberries had significantly lower protein levels compared to pollen harvested by colonies located at the farmland apiary. Moreover, the protein level during lowbush blueberry pollination was lower than the minimal 20% of the pollen dry weight required for colony development and maintenance (Kleinschmidt et al. Reference Kleinschmidt, Kondos, Harden and Turner1974). In order to prevent the effects of low pollen protein levels, bees increase their pollen consumption (Somerville Reference Somerville2001). While some studies suggest an optimal level of pollen consumption by honey bee colonies to be 13–18 kg per year (Crailsheim et al. Reference Crailsheim, Schneider, Hrassnigg, Bühlmann, Brosch, Gmeinbauer and Schöffmann1992; Keller et al. Reference Keller, Fluri and Imdorf2015), another found a total of 55 kg of good-quality pollen per year is needed for a mature colony for optimal production (Somerville Reference Somerville2001), which translates into 14 kg of protein intake at a level of 25% of pollen dry weight (as measured in the pollen from the farmland apiary). According to our results, protein availability when providing lowbush blueberry pollination services ranged between 12% and 16% of pollen dry weight. Thus, bee pollen consumption in lowbush blueberries must reach 88 kg (12% of protein in pollen) to 117 kg (16% of protein in pollen) to ensure the same level of protein nutrition as farmland pollen, with a protein content of 25%. Results obtained by Somerville (Reference Somerville2001) are similar, showing a lower pollen harvest and reduced colony development during provision of blueberry pollination services.
In our study, we measured a protein shortage in June. Unfortunately, this is when honey bee colonies need many nutrients for colony growth (DeGrandi-Hoffman and Chen Reference DeGrandi-Hoffman and Chen2015) and brood rearing (Somerville and Nicol Reference Somerville and Nicol2006). Our results clearly showed a reduced brood population during provision of lowbush blueberry pollination services (Fig. 10), most likely the result of a scarcity of protein. Comparable results were obtained in other similar studies (Somerville Reference Somerville2001; Girard et al. Reference Girard, Chagnon and Fournier2012; Colwell et al. Reference Colwell, Williams, Evans and Shutler2017).
Bee bread protein level is a reflection of harvested pollen and is related to floral diversity of the landscape surrounding honey bee colonies (Donkersley et al. Reference Donkersley, Rhodes, Pickup, Jones and Wilson2014). In our study, there were no differences in the protein concentration of bee bread during lowbush blueberry or cranberry pollination compared to bee bread of colonies in the farmland apiary for the same period in time (Fig. 9). Protein content in bee bread was consistently lower than harvested pollen, as shown by other studies (Human and Nicolson Reference Human and Nicolson2006; Szczęsna Reference Szczęsna2006) (Figs. 8–9). This situation can be explained by the addition by honey bees of nectar and glandular secretions to the fresh and collected pollen (Somerville and Nicol Reference Somerville and Nicol2006).
Amino acids in pollen and bee bread
Determination of amino acid deficiencies is based on De Groot (Reference De Groot1953), who found different relative proportions of essential amino acids for optimal honey bee development and maintenance. The net results of each essential amino acid from the laboratory analysis (in g/100 g of protein) did not take these relative proportions into account and needed to be considered in relation to other amino acids in order to detect deficiencies. For example, threonine in the control management strategy in May 2016 had a net value of 3.5, but tryptophan had a value of 1.3 (not 1.0). Based on the ratios provided by De Groot (Reference De Groot1953), three times more threonine than tryptophan would be needed for the honey bees to completely synthesise that amino acid. Therefore, the relative minimum threshold for threonine becomes 3.9 (not 3.0), indicating a threonine deficiency, with a net value of 3.5, despite being over the net threshold of 3.0 (Table 2).
Colony nutritional requirements are highest for leucine, isoleucine, and valine, and scarcities of any essential amino acids in the protein lead to impairment in colony development (Brodschneider and Crailsheim Reference Brodschneider and Crailsheim2010). Our results showed that methionine, threonine, isoleucine, and valine were lacking in both pollen and bee bread for many sampling dates and management strategies. This finding was similar to that reported by Somerville (Reference Somerville2001), who noted that isoleucine was often deficient in harvested pollen, and isoleucine and valine levels were below De Groot (Reference De Groot1953) minimum requirements. Australian studies also found isoleucine deficiencies in harvested pollen to be common, especially in pollen from Eucalyptus L’Héritier de Brutelle (Myrtaceae) species (Stace and White Reference Stace and White1994; Somerville and Nicol Reference Somerville and Nicol2006).
Some researchers have found that honey bees are unable to rear brood on pollen lacking the essential amino acid methionine, and that bees will avoid foraging plant species low in this amino acid (McCaughey et al. Reference McCaughey, Gilliam and Standifer1980; Nicolson and Human Reference Nicolson and Human2013). Our results did not confirm these findings: all our pollen samples were deficient in methionine (except during spring 2017) (Table 2), whereas brood rearing was only impaired during lowbush blueberry pollination.
Our prediction that harvested pollen from colonies providing lowbush blueberry and/or cranberry pollination services would suffer deficiencies of the 10 essential amino acids was partially confirmed. Many deficiencies were measured, and they were not always related to the management strategy. Globally, various essential amino acid deficiencies (harvested pollen or bee bread) were present at all three apiaries and four management strategies.
Bee bread versus bee pollen composition
Protein and amino acid content have been found to be higher in harvested pollen than in bee bread (Herbert and Shimanuki Reference Herbert and Shimanuki1978; Standifer et al. Reference Standifer, McCaughey, Dixon, Gilliam and Loper1980; Human and Nicolson Reference Human and Nicolson2006; Nicolson and Human Reference Nicolson and Human2013). Our findings confirmed this. Standifer et al. (Reference Standifer, McCaughey, Dixon, Gilliam and Loper1980) revealed that the difference in amino acid content of almond pollen (Prunus dulcis (Miller) Webb (Rosaceae)) versus almond bee bread was significant, with some amino acid concentrations reduced by 20%, and an average loss of 10% once stored. A study by DeGrandi-Hoffman et al. (Reference DeGrandi-Hoffman, Chen, Rivera, Carroll, Chambers, Hidalgo and Watkins de Jong2016) found that leucine, lysine, methionine, and threonine levels were higher in bee bread than bee pollen. Among essential amino acids, we rather found arginine, histidine, isoleucine, leucine, threonine, tryptophan, and valine to be the amino acids in higher concentration in bee bread. Amino acids can be found in higher concentrations in bee bread than in pollen (Degrandi-Hoffman et al. Reference DeGrandi-Hoffman, Eckholm and Huang2015), which indicated that differences between pollen and bee bread in terms of nutrition are unclear (DeGrandi-Hoffman et al. Reference DeGrandi-Hoffman, Chen, Rivera, Carroll, Chambers, Hidalgo and Watkins de Jong2016). However, if colony pollen stores are inadequate, nurse bees may fail to care for larvae (Brodschneider and Crailsheim Reference Brodschneider and Crailsheim2010).
Conclusion
In our study, colonies providing lowbush blueberry and cranberry pollination services were exposed to a less diversified pollen diet than colonies located within a rich farmland environment, especially within the cranberry crop. Nevertheless, the quality of cranberry pollen was adequate for bee colony development, which contradicted the monofloral diet theory stating it is of poor nutritional quality, at least with respect to colony development. While the monofloral diet theory seems to hold true when a specific pollen is composed of balanced nutrients (Di Pasquale et al. Reference Di Pasquale, Salignon, Le Conte, Belzunces, Decourtye and Kretzschmar2013), other negative effects would need to be investigated as well (e.g., immunocompetence (Alaux et al. Reference Alaux, Ducloz, Crauser and Le Conte2010) or stress resistance (Huang Reference Huang2012)). During provision of lowbush blueberry pollination services though, there was a significantly lower proportion of crude protein content in collected and stored pollen (bee bread), which led to a brood population decrease in colonies. Crude protein content of harvested pollen appeared to be a good indicator of the quality of the protein diet of honey bees.
The complete study showed that many essential amino acids were below the minimum requirements for optimal growth of honey bee colonies, independently of the management strategy. The fact that we did not see any impact of amino acid deficiencies on colony development raises an important question: are the minimum requirements of amino acids calculated by De Groot (Reference De Groot1953) in need of further investigation? Since harvested pollen showed an average crude protein content of 25% and above (except within the lowbush blueberry crops), amino acid deficiencies may have been mitigated and not had a significant impact on honey bee development. Also, it would be interesting to further investigate the impact of a low proline concentration following cranberry pollination, as this situation could prevent honey bee colony preparation for wintering.
From a practical standpoint, honey bee colonies used for commercial lowbush blueberry pollination should be given a protein supplement to provide them with a sufficient amount of protein, especially since the pollination timing for that crop (June) coincides with what is usually important brood development. However, not all protein supplement have a proper nutritional value and many are poorly accepted by honey bees (Schmidt and Hanna Reference Schmidt and Hanna2006; Lamontagne-Drolet et al. Reference Lamontagne-Drolet, Giovenazzo and Fournier2019). We found a newly developed protein supplement that uses natural bee bread microorganisms that ferment protein supplement often found on the market (Dias et al. Reference Dias, Morais, Francoy, Pereira, Turcatto and Jong2018), a product that may hold potential. Regardless, we hope that in the near future, protein supplement will offer honey bee colonies a complete nourishment formula including the vitamins, fatty acids (Zarchin et al. Reference Zarchin, Dag, Salomon, Hendriksma and Shafir2017), lipids, sterols, and minerals that could be lacking in addition to protein. Since commercial pollination using honey bees is a growing industry, and because research indicates it may harm their health and development, further research on honey bee nutritional requirements is now essential.
Acknowledgements
The authors would like to thank Émile Houle for his help with field work, and the Centre de recherche en sciences animales de Deschambault beekeeping staff: Michaël Benoît, Georges Martin, Mélissa Girard, Ségolène Maucourt, and Sabrina Rondeau. Our thanks also go to Gaétan Daigle for statistical analyses, Intermiel on behalf of the lowbush blueberry producer and Les Atocas de l’Érable for providing the study sites. This study was supported by Bayer CropScience and the Centre de recherche en sciences animales de Deschambault.
Author contributions
CD and PG conceived this research and designed experiments; CD performed experiments and analysis; CD wrote the paper and VF and PG participated in the revisions of it. All authors read and approved the final manuscript.
Conflict of interest
The authors declare that they have no potential conflict of interest in relation to the study in this paper.