Introduction
Bees are keystone components of most terrestrial ecosystems, pollinating plants in both natural and agricultural settings (Kevan et al. Reference Kevan, Clark and Thomas1990; Westerkamp and Gottsberger Reference Westerkamp and Gottsberger2000; Kevan and Imperatriz-Fonseca Reference Kevan and Imperatriz-Fonseca2002; Klein et al. Reference Klein, Vassiere, Cane, Steffan-Dewenter, Cunningham and Kremen2007; National Research Council 2007). As such, the need to understand which factors influence species richness and abundance is crucial to promote plant reproduction, bee conservation, and stewardship, and prevent the continued decline of pollinators in a range of habitats (Biesmeijer et al. Reference Biesmeijer, Roberts, Reemer, Ohlemüller, Edwards and Peeters2006; Williams et al. Reference Williams, Crone, Roulston, Minckley, Packer and Potts2010; Winfree Reference Winfree2010). Clearly, habitats will differ dramatically on regional scales with respect to the bee fauna as a whole (Michener Reference Michener1979); each may have a particular profile of species richness and abundance as some habitats are naturally more productive and/or favour particular bee groups. A general consensus is that managed habitats (e.g., agroecosystems) typically have lower bee species diversity than surrounding natural habitats (Rathcke and Jules Reference Rathcke and Jules1993; Kremen et al. Reference Kremen, Williams and Thorp2002, Reference Kremen, Williams, Bugg, Fay and Thorp2004; Steffan-Dewenter et al. Reference Steffan-Dewenter, Münzenberg, Bürger, Thies and Tscharntke2002; Larsen et al. Reference Larsen, Williams and Kremen2005; Cane et al. Reference Cane, Minckley, Roulston, Kervin and Williams2006; Klein et al. Reference Klein, Vassiere, Cane, Steffan-Dewenter, Cunningham and Kremen2007; Sheffield et al. Reference Sheffield, Kevan, Westby and Smith2008a; Williams et al. Reference Williams, Crone, Roulston, Minckley, Packer and Potts2010; Watson et al. Reference Watson, Wolf and Ascher2011) and that proximity to more natural and/or diverse habitats (e.g., field margins rich in floral resources) typically increases bee diversity (Holzschuh et al. Reference Holzschuh, Steffan-Dewenter, Kleijn and Tscharntke2007; Winfree et al. Reference Winfree, Griswold and Kremen2007; Jauker et al. Reference Jauker, Diekötter, Schwarzbach and Wolters2009; Hagen and Kraemer Reference Hagen and Kraemer2010; Roulston and Goodell Reference Roulston and Goodell2011; Watson et al. Reference Watson, Wolf and Ascher2011). However, there is much to be learnt about the response of bees to land-use patterns (Brosi et al. Reference Brosi, Daily and Ehrlich2007, Reference Brosi, Daily, Shih, Oviedo and Durán2008; Carré et al. Reference Carré, Roche, Chifflet, Morison, Bommarco and Harrison-Cripps2009; Calvillo et al. Reference Calvillo, Ramírez, Parra-Tabla and Navarro2010).
The pollinator fauna associated with crops grown over wide geographic ranges can show remarkable differences from region to region (e.g., Vincent et al. Reference Vincent, de Oliveira, Bélanger and Chiasson1994). For instance, the domestic apple, Malus domestica Borkhausen (Rosaceae), though originating from Asia, is grown throughout the world and with the exception of the honey bee (Apis mellifera Linnaeus; Hymenoptera: Apidae), its pollinators vary greatly from continent to continent, and even within different tree fruit producing areas within single countries. Unfortunately, pollinator data for many crop plants are not complete and many studies of bees in specific agricultural habitats have not provided data that give an accurate representation of the entire fauna within these systems. Most pollinator surveys have been done when the respective crop is flowering (e.g., Brittain Reference Brittain1933; MacKenzie and Winston Reference MacKenzie and Winston1984; Scott-Dupree and Winston Reference Scott-Dupree and Winston1987; Kevan et al. Reference Kevan, Greco and Belaoussoff1997; Gardner and Ascher Reference Gardner and Ascher2006; Watson et al. Reference Watson, Wolf and Ascher2011) as this strategy identifies which species may be visiting the crop(s). However, such restricted sampling will not survey most bee species within the system, or identify which species use these habitats at other periods during the growing season (Oertli et al. Reference Oertli, Muller and Dorn2005). Additionally, these narrow sampling intervals will not reveal the impact that management practices are having, nor the structure or true functional diversity of the bee communities as a whole. Bees display a range of lifestyles, which can be assigned to behavioural or ecological groups or “guilds” (sensu Blondel Reference Blondel2003) (Oertli et al. Reference Oertli, Muller and Dorn2005; Grixti and Packer Reference Grixti and Packer2006; Matteson et al. Reference Matteson, Ascher and Langellotto2008; Wilson et al. Reference Wilson, Griswold and Messinger2008; Tuell et al. Reference Tuell, Ascher and Isaacs2009). Monitoring the relative abundance and diversity of members of each guild may provide additional information for describing and comparing communities (Tilman and Lehman Reference Tilman and Lehman2001) as different habitats offer different resources. When used with standard diversity statistics, more information is gained about the factors affecting bee communities, and better conclusions can be drawn with regard to the health of the ecosystem and/or how to improve it.
The main objective of this study was to compare bee communities across a wide range of disturbance levels, from highly managed apple agroecosystems to unmanaged and semi-natural habitats within the Annapolis Valley of Nova Scotia on a “full season” basis. This objective was met by using a sampling regime that was both intensive and extensive in scope. Additionally, the relative proportions of individuals among select bee guilds were compared across habitats to better understand how bee communities respond to ecosystem disruption on long-term scales.
The taxonomic knowledge of bees in Nova Scotia has increased greatly since the publication of the first checklist for the province (Sheffield et al. Reference Sheffield, Kevan, Smith, Rigby and Rogers2003). This arose through both DNA barcoding efforts (Sheffield et al. Reference Sheffield, Hebert, Kevan and Packer2009) and taxonomic revisions yielding two new species among the individuals collected (Gibbs Reference Gibbs2010; Rehan and Sheffield Reference Rehan and Sheffield2011). Since the last inventory of the province's bee fauna (Sheffield et al. Reference Sheffield, Kevan, Smith, Rigby and Rogers2003), about 25% more species have been found with over 200 species recorded (Sheffield et al. Reference Sheffield, Dumesh and Cheryomina2011).
Materials and methods
Study sites and sampling
Nova Scotia is part of the Acadian Forest Region (Rowe Reference Rowe1972) composed of mixed-forest species and predominated by conifers. The Annapolis Valley (44.9°N–45.3°N, 64.2°W–65.9°W), with its early springs and warm (mean 17.4°C), dry (435 mm precipitation) summers (Webb and Marshall Reference Webb and Marshall1999) is the primary agriculture region of the province. It is ∼930 km2, lying between the North and South Mountains in the southeastern part of the province (Neily et al. Reference Neily, Quigley, Benjamin, Stewart and Duke2003). Very little of the original forest remains in the Annapolis Valley due to a long history of intense agriculture; the remaining woodlands consist largely of white and red pine (Pinus strobus Linnaeus, Pinus resinosa Aiton; Pinaceae), eastern hemlock (Tsuga canadensis (Linnaeus) Carrière; Pinaceae), red oak (Quercus rubra Linnaeus; Fagaceae), sugar maple (Acer saccharum Marshall; Sapindaceae), yellow birch (Betula alleghaniensis Britton; Betulaceae), and beech (Fagus grandifolia Ehrhart; Fagaceae) (Webb and Marshall Reference Webb and Marshall1999; Neily et al. Reference Neily, Quigley, Benjamin, Stewart and Duke2003).
The sites used in this study, previously described in Sheffield et al. (Reference Sheffield, Kevan, Westby and Smith2008a), represent an ecological gradient from highly managed agroecosystems to unmanaged meadow habitats surrounded by woodlands. The four habitat types distinguished were: (1) COMM-A (5 sites), commercially managed apple orchards surrounded by adjacent orchard blocks or other agricultural crops; (2) COMM-B (5 sites), commercially managed orchard blocks isolated from other agricultural areas and/or usually surrounded by adjacent woodland or other nonagricultural land; (3) ABAND (4 sites), abandoned and/or unmanaged orchard sites, which have not been sprayed or otherwise managed for production for at least 10 years; and (4) OLD FIELD (5 sites), unmanaged meadow or open habitats with adjacent woodland. Due to extensive weed control and other standard agricultural practices within the main sampling areas, sites within the COMM-A and COMM-B habitats typically had reduced floral resource diversity and abundance (excluding the crop during its flowering period), though small areas could be found at margins or other areas within these sites. Orchard site selection was facilitated from data collected as part of a “Tree Fruit Census of the Annapolis Valley” (Craig Reference Craig1998), in particular, the “Orchard Mapping Project” conducted by the Nova Scotia Department of Agriculture and Marketing in 1995.
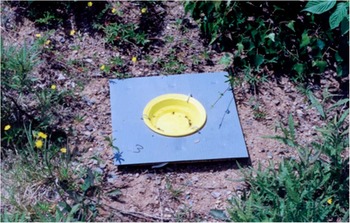
At each site, nine 12-oz (350 mL) yellow plastic bowl pan traps (Solo® Cup Company, Lake Forest, Illinois, United States of America; No. PSB2Y 0099) were arranged in a 3 × 3 grid with minimum spacing of 5 m between each pan trap. Within COMM-A and COMM-B, pan traps were placed between trees within the rows to avoid traffic associated with normal orchard management. At each site, a hand-held global positioning system unit was used to measure the centre of the sampling grid, and notes were made on the surrounding habitat. Pan traps were placed in corrugated plastic bases measuring ∼30 cm × 30 cm, supported at two ends by 25 cm strips of 1″ × 3″ (2.5 cm × 7.5 cm) lumber and painted with Tremclad® (Beachwood, Ohio, United States of America) grey primer (MFG no. 274103 522) (Fig. 1). A hole was cut into the centre to allow the pan to sit flush with the base surface and filled ∼2/3 with a salt water solution with few drops of liquid detergent added to reduce surface tension (Marshall et al. Reference Marshall, Anderson, Roughley, Behan-Pelletier and Danks1994). This design was used to avoid suspected visibility problems due to weed and grass build up around the traps, to make trap visibility more equal throughout the season, and to reduce the capture of slugs and other nonvolant invertebrates. Samples were collected weekly from mid-May to mid-October of each year and pans were replaced every sampling period to minimise loss of attractiveness due to fading.
Pan-trap design used in study.

To further characterise the habitat landscape surrounding the sampling sites without an a priori classification scheme (i.e., habitat type), the normalised measure of habitat dominance (hD) (after O'Neill et al. Reference O'Neill, Krummel, Gardner, Sugihara, Jackson and DeAngelis1988) was calculated for each site using satellite images obtained from Google Earth©. Images of each site were compared with large-scale habitat characteristics observed at the time of study; significant changes in landscape structure had not taken place in the 10-year elapsed period. Satellite images at a common scale were printed and overlaid with a 24 × 24 grid, each grid cell representing 25 m × 25 m, with the central sampling point at the centre of the grid. Habitat dominance was calculated at three levels for each site: (A) the inner 8 × 8 grid, (B) a 16 × 16 grid, and (C) the total 24 × 24 grid. The following landscape classifications were used: (A) tree fruit orchard under intense management, (B) nontree fruit agricultural cropland under intense management, (C) woodland, (D) pasture (no spraying, seasonal mowing), (E) residence, (F) meadow, and (G) abandoned orchard. Large bodies of water and paved areas occupying most of the surface of individual grid cells were subtracted from the total grid number. Values of hD range between 0 and 1, with higher values indicating a landscape dominated by only a few cover types; values closer to 0 indicating proportions of land cover that are nearly equal.
Data analysis
For each site, data from all nine pan traps for both years were pooled prior to analysis, as between pan and year differences were not being studied; however, differences in species composition were observed between years, primarily due to the high proportion of singletons. Rank-abundance plots for the pooled years summarised the relationship between species richness and abundance within each of the four habitat categories (Krebs Reference Krebs1998; Magurran Reference Magurran2004). In addition, species abundance data for each habitat were log transformed (x = log2ni) and fitted to a truncated log-normal distribution following Magurran (Reference Magurran2004). Goodness of fit of observed to expected values for the truncated log-normal plot was tested using the Kolmogorov–Smirnov test with Lilliefor's correction, as this greatly increases the power of detection of departures from expectation (Sokal and Rohlf Reference Sokal and Rohlf1995), as demonstrated by Kevan et al. (Reference Kevan, Greco and Belaoussoff1997) for bee communities. Fitting species abundance data to the truncated log-normal plot and measuring the fit have been previously suggested as a means of diagnosing bee communities (Kevan et al. Reference Kevan, Greco and Belaoussoff1997); the assumption being that natural “healthy” communities fit this model (Hill and Hamer Reference Hill and Hamer1998; Hubbell Reference Hubbell2001).
The inverse Simpson's diversity index (1/D) was calculated for each site using Species Diversity and Richness IV (SDR) (Pisces Conservation Ltd., Lymington, United Kingdom). Analysis of Variance (ANOVA) with Tukey's test was used to detect differences in the means of the number of species and 1/D for each habitat category (Zar Reference Zar1999). Additionally, to determine the impact of landscape on bee diversity, 1/D was regressed against hD at all three spatial scales.
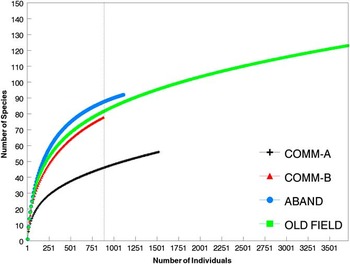
To compare species richness among sites within each of the four habitats, individual-based rarefied estimates (±95% CI) were calculated for the pooled data. As the number of bees captured varied among sites within each habitat, data were rarefied down to the following number of randomly sampled individuals to allow a common sampling effort among sites: COMM-A – 40; COMM-B – 50; ABAND – 80; OLD FIELD – 210. Estimates of species richness (±95% CI) were also calculated for each of the four habitat categories, rarefied to a common sampling of 800 individuals. All rarefaction estimates were obtained using EcoSim (Gotelli and Entsminger Reference Gotelli and Entsminger2003), with the default setting of 1000 iterations. In addition, species richness for each habitat type was estimated using two common nonparametric “sample coverage” methods: the Abundance-based Coverage Estimator (ACE) (Chao et al. Reference Chao, Ma and Yang1993) and the Incidence-based Coverage Estimator (ICE) (Lee and Chao Reference Lee and Chao1994). Both estimates were calculated using EstimateS Version 7.5 (Colwell Reference Colwell2005), with 50 randomisations. An additional “parametric” estimate of species richness (Colwell and Coddington Reference Colwell and Coddington1994) for each habitat was obtained by adding the number of “hidden species” calculated from the left of the veil line in the truncated log-normal plots to the actual number observed.
Faunal similarity among sites and habitats was compared using the 1-Sørensen incidence-based index (Magurran Reference Magurran2004) calculated using Community Analysis Package III (CAP III) software (Pisces Conservation Ltd., Lymington, United Kingdom); this metric was used to generate average-linkage dendrograms. Cluster analysis was performed in preference to ordination approaches as there were a priori expectations that clustering would occur according to habitat assignment (Seaby et al. Reference Seaby, Henderson and Prendergast2004).
Guild structure of the bee communities in each of the four habitat types was compared. Each species was assigned to one of the following eight guilds based on their known natural history (Sheffield et al. Reference Sheffield, Kevan, Smith, Rigby and Rogers2003): (A) solitary ground-nesters (Agapostemon Guérin-Méneville, Andrena Fabricius, Calliopsis Smith, Colletes Latreille, Lasioglossum Curtis (subgenus Lasioglossum), Macropis Panzer, Melissodes Latreille, Perdita Smith, Pseudopanurgus Cockerell, Megachile gemula Cresson, Megachile latimanus Say, Megachile melanophaea Smith, Megachile montivaga Cresson); (B) social ground-nesters (Lasioglossum subgenera Dialictus Robertson and Evylaeus Robertson, Augochlorella Sandhouse, Halictus Latreille); (C) honey bees (Apis mellifera Linnaeus); (D) bumble bees (Bombus Latreille) other than the social parasitic species; (E) cavity-nesters, including excavators of pithy stems (Heriades Spinola, Hoplitis Klug, Hylaeus Fabricius, Megachile Latreille [other than those listed under A], Osmia Panzer, Anthophora terminalis Cresson, Ceratina Latreille); (F) cleptoparasites (Coelioxys Latreille, Epeoloides Giraud, Epeolus Latreille, Holcopasites Ashmead, Nomada Scopoli, Sphecodes Latreille, Stelis Panzer, Triepeolus Robertson); and (G) social parasites (Bombus subgenus Psithyrus LePeletier; B. ashtoni (Cresson), B. citrinus (Smith), B. fernaldae (Franklin)). The proportions of bee species and individuals within each guild in the four habitats were compared with multiple comparisons of proportions; data were arcsine transformed using the modified Freemen and Tukey transformation (after Zar Reference Zar1999). This transformation was chosen as it is preferable to other methods when comparing small and/or large proportions (Zar Reference Zar1999). In addition, the diversity and relative abundance of the guilds within each habitat were calculated with Shannon's index.
Specimens collected in this study are currently in the Packer collection at York University, Toronto, Ontario, Canada. Representatives will be placed in the Nova Scotia Museum of Natural History in Halifax, Nova Scotia, Canada and in the Royal Saskatchewan Museum, Regina, Saskatchewan, Canada.
Results
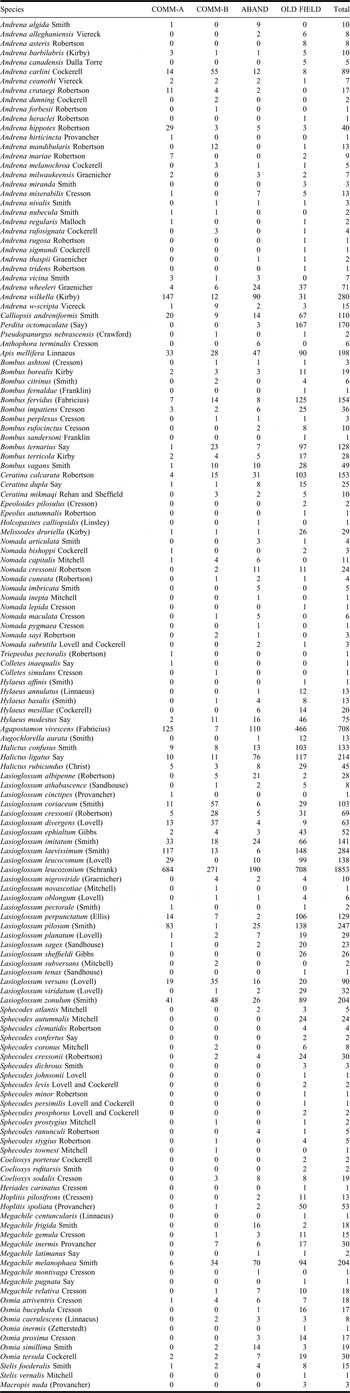
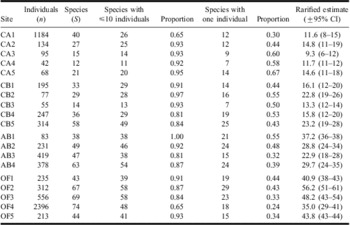
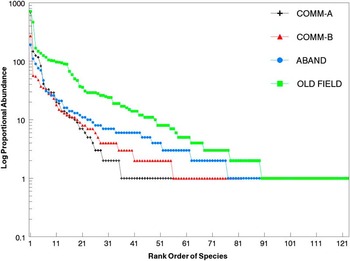
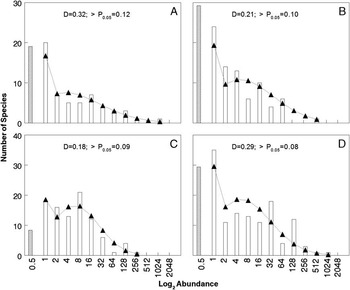
A total of 7234 bee specimens, representing 146 species, were sampled in the 2 years combined (see Appendix 1). Great variation was observed in the number of bees collected among sites within the four habitat types (Table 1); sites within the OLD FIELD habitat contributed the highest number of bees (Table 2). Rare bees made up a high proportion of the species collected. Singletons made up 24–67% of species among sites, and resulted in the long tails of the rank-abundance plots (Fig. 2), though differences in the number of singletons were not observed among habitats (F 3, 15 = 2.43, P = 0.11) (Table 1). Similarly, the high proportion of singletons affected the fit of the truncated log-normal plots for each habitat (Fig. 3), all significantly deviating from those expected if log-normal (in all cases, P < 0.01). More than half (56.2%) of the species captured across all sites were represented by 10 or fewer individuals, ranging between 65–100% across sites (Table 1); no differences were observed among habitats in the number of species represented by at most 10 individuals (F 3, 15 = 0.47, P = 0.71).
The number of individuals and species of bee observed at each site; the number (and proportion) of species represented by 10 or fewer specimens and one specimen, respectively; rarified estimates of the number of species expected (±95% CI) based on 1000 replicated random samplings of 42 (COMM-A), 55 (COMM-B), 83 (ABAND), and 213 (OLD FIELD) individuals from each habitat.

Data pooled for the years 2001–2002.
Site coding: CA, COMM-A (sites 1–5); CB, COMM-B (sites 1–5); AB, ABAND (sites 1–4); OF, OLD FIELD (sites 1–5).
The total number of bees collected, the number of bee species observed in each of the four habitat types; rarified estimates of the number of species expected (±95% CI) based on 1000 replicated random samplings of 800 individuals from each habitat; species richness estimated for each habitat based on (A) hidden species revealed in truncated log-normal plots, and the (B) ACE, and (C) ICE estimates. Data pooled for the years 2001–2002; cells sharing letters in column four are not significantly different (Tukey's test, P = 0.05).

Species rank (X-axis) versus log abundance (Y-axis) for bees collected within each habitat type; data pooled for 2001–2002.

Truncated log-normal plots of observed (solid bars) and expected (triangles) number of bee species (Y-axis) in each abundance octave (X-axis; log2 scale), and estimated number of “unseen” species (diagonal striped bars) in the (A) COMM-A, (B) COMM-B, (C) ABAND, and (D) OLD FIELD habitats for 2001–2002. Kolmogorov–Smirnov test for normality with Lilliefors adjustment do not support a log-normal distribution for any habitat type.

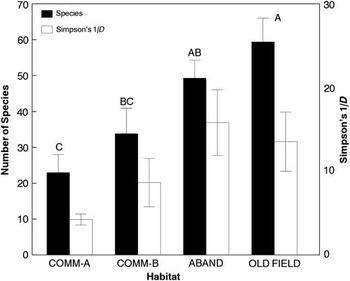
Species richness varied considerably among habitats (Table 1); the mean number of species observed was highest in OLD FIELD and ABAND, and lowest in COMM-A; no differences were observed between COMM-A and COMM-B, or between COMM-B and ABAND (Tukey's test, P = 0.05; Table 2; Fig. 4). Rarified estimates for each habitat (i.e., sites combined) indicated that COMM-A had fewer species than the other three habitats, which did not differ significantly (Table 2, “Species Exp”; Fig. 5). In contrast, addition of “hidden species” from the left of the veil line to the actual number of species observed (Figs. 3A–3D; Table 2; compare “Species Obs” to column A) and both ACE (Table 2, “B”) and ICE (Table 2, “C”) estimators suggested that COMM-A, COMM-B, and ABAND had equally low species richness; all three habitats having species richness estimates much lower that OLD FIELD (Table 2). Contrasting with species richness estimates, no significant differences in diversity (1/D) were observed among habitats (F 3, 15 = 3.03, P = 0.062), but COMM-A had the lowest mean index value (Fig. 4).
Mean (±SE) of the number of species and Simpson's 1/D index for the four habitat types. Bars sharing letters are not significantly different (Tukey's test, P = 0.05); no differences were observed in 1/D.

Rarefaction plot for each habitat type for the years 2001–2002. Dashed vertical line indicates the sample size (900) of randomly selected individuals for habitat comparison.

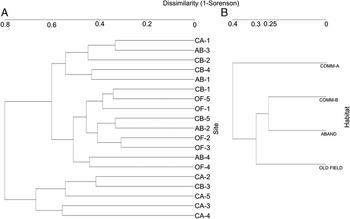
Most of the COMM-A sites clustered together and separately from the remaining sites. Sites within COMM-B, ABAND, and OLD FIELD showed no distinct pattern of clustering by habitat type (Fig. 6A). Similarly, COMM-A was the least similar to the other habitats, whereas COMM-B most closely resembled ABAND (Fig. 6B).
Average linkage dendrograms of dissimilarity (1-Sorenson index) (top X-axis) for: (A) all sites, and (B) the four habitat types. CA, COMM-A (sites 1–5); CB, COMM-B (sites 1–5); AB, ABAND (sites 1–4); OF, OLD FIELD (sites 1–5).

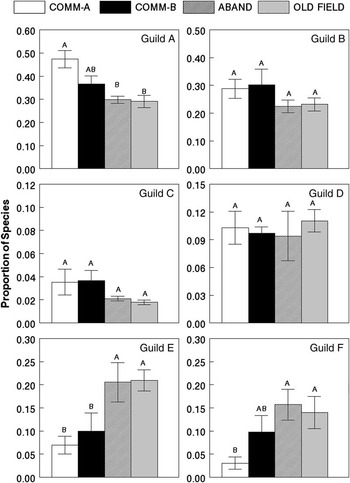
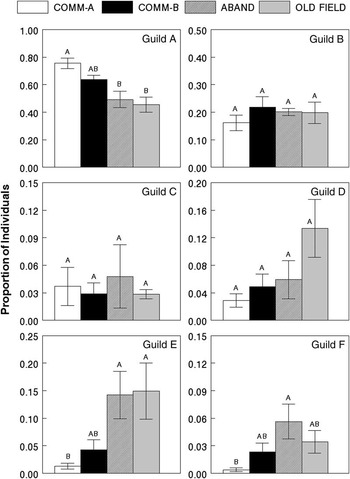
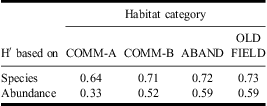
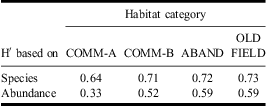
The managed orchards (COMM-A, COMM-B) had significantly higher proportions of solitary ground-nesting species and individuals (Figs. 7–8, Guild A), while ABAND and OLD FIELD had the lowest. In contrast, no differences were found among habitats with respect to the proportion of social ground-nesters (Figs. 7–8, Guild B), honey bees (Guild C), nor the nonparasitic bumble bees (Guild D) (Figs. 7–8). Cavity-nesting bees (Guild E) were most common in ABAND and OLD FIELD, accounting for over 20% of the species and almost 15% of the bees captured (Figs. 7–8); in contrast, this guild made up only ∼1% of the bees in COMM-A (Fig. 8) even though 7% of the species in this habitat belonged to this guild (Fig. 7). Cleptoparasites (Guild F) were proportionally most abundant in ABAND, but almost nonexistent in COMM-A (Figs. 7–8). The proportional abundances of the social parasite Bombus (Psithyrus) (Guild G; not shown) showed no differences among habitats. Supporting these overall trends for guild structure, the Shannon H′ index, based on the proportion of species in each of the eight guilds did not differ greatly among habitats, but showed great variability when the relative abundance of individuals in each guild was considered (Table 3). In general, OLD FIELD and ABAND displayed the highest guild diversity, while COMM-A was the lowest (Table 3).
The proportion of the bee species representing each guild within each habitat type (nontransformed data). Bars sharing letters within each guild are not significantly different (multiple comparisons of proportions, q 0.05, 4 = 3.633; after Zar Reference Zar1999). Guild A = solitary ground nesters; Guild B = social ground nesters; Guild C =Apis mellifera; Guild D = bumble bees; Guild E = cavity-nesters; Guild F = cleptoparasitic bees.

The proportion of the total number of bees representing each guild within each habitat type (nontransformed data). Bars sharing letters within each guild are not significantly different (multiple comparisons of proportions, q 0.05,4 = 3.633; after Zar Reference Zar1999). Guild A = solitary ground nesters; Guild B = social ground nesters; Guild C = Apis mellifera; Guild D = bumble bees; Guild E = cavity-nesters; Guild F = cleptoparasitic bees.

Shannon H′ index for the guild structure of each habitat type, and the pooled habitats based on the proportional species richness, and the proportional abundance of bees in each guild.
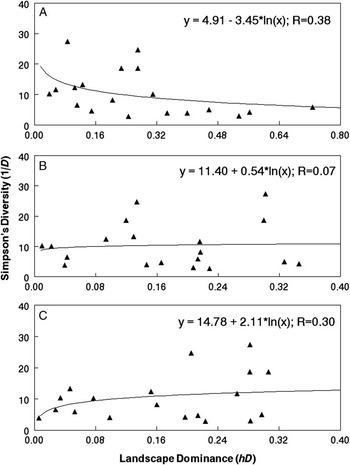
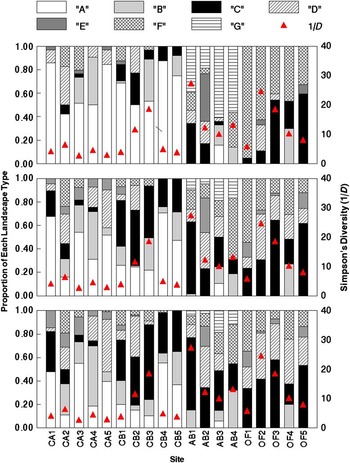
Landscape structure had a strong influence on bee diversity (Fig. 9). At the smallest scale bee diversity decreased as hD increased (Fig. 9A) with many of the sites with low species diversity being dominated by managed orchard cover (Fig. 10, top graph). As a larger proportion of the surrounding landscape was included, a weak relationship was observed between bee diversity and hD (Fig. 9B) and at the largest scale, bee diversity increased as hD increased (Fig. 9C), though primarily in landscapes dominated with nonagricultural habitat (Fig. 10, lower graph).
The diversity of bees (Simpson's 1/D) versus landscape dominance (hD) for each site at three landscape levels surrounding the sampled area: (A) 200 m × 200 m, (B) 400 m × 400 m, and (C) 600 m × 600 m.

The proportion of each type of habitat cover (left Y-axis) and diversity of bees (Simpson's 1/D) (right Y-axis) for each site at three landscape levels surrounding the sampled area: 200 m × 200 m (top), 400 m × 400 m (middle), and 600 m × 600 m (bottom). Legend: “A”, tree fruit orchard under intense management; “B”, nontree fruit agricultural cropland under intense management; “C”, woodland; “D”, pasture (no spraying, seasonal mowing); “E”, residence; “F”, meadow; and “G”, abandoned orchard.

Discussion
Agroecosystems typically have lower bee diversity than surrounding natural habitats (Rathcke and Jules Reference Rathcke and Jules1993; Kremen et al. Reference Kremen, Williams and Thorp2002, Reference Kremen, Williams, Bugg, Fay and Thorp2004; Steffan-Dewenter et al. Reference Steffan-Dewenter, Münzenberg, Bürger, Thies and Tscharntke2002; Larsen et al. Reference Larsen, Williams and Kremen2005; Cane et al. Reference Cane, Minckley, Roulston, Kervin and Williams2006; Klein et al. Reference Klein, Vassiere, Cane, Steffan-Dewenter, Cunningham and Kremen2007; Sheffield et al. Reference Sheffield, Kevan, Westby and Smith2008a; Williams et al. Reference Williams, Crone, Roulston, Minckley, Packer and Potts2010), and the establishment or maintenance of set-asides, hedgerows, natural borders, and corridors throughout agricultural landscapes has long been known to increase pollinator species richness and abundance within these settings (Corbet Reference Corbet1995; Shepherd et al. Reference Shepherd, Buchmann, Vaughan and Black2003; Greenleaf and Kremen Reference Greenleaf and Kremen2006; Pywell et al. Reference Pywell, Warman, Hulmes, Hulmes, Nuttall and Sparks2006). Bees respond favourably to increased proximity to and increased proportions of natural habitat rich in floral food resources (Scott-Dupree and Winston Reference Scott-Dupree and Winston1987; Banaszak Reference Banaszak2000; Richards Reference Richards2001; Roulston and Goodell Reference Roulston and Goodell2011; Watson et al. Reference Watson, Wolf and Ascher2011), and the number of species observed (Tables 1–2; Fig. 4), rarified estimates of species richness (Fig. 5) and diversity (1/D) (Figs. 4, 9–10) generally support this. Bee species richness in the habitats dominated by agricultural land (COMM-A) was lower than in agricultural landscapes with adjacent woodlands and/or natural habitats (COMM-B).
Landscapes dominated by crops, whose flowers may serve as rich sources of pollen and nectar for bees during the flowering period (Banaszak Reference Banaszak2000; Westphal et al. Reference Westphal, Steffan-Dewenter and Tscharntke2003; Tscharntke et al. Reference Tscharntke, Klein, Kruess, Steffan-Dewenter and Thies2005; Hagen and Kraemer Reference Hagen and Kraemer2010; Watson et al. Reference Watson, Wolf and Ascher2011), are generally not good bee habitat. Bee diversity at the smallest scale was lowest in sites with the highest hD (Fig. 9A) when the site was dominated by agriculture habitat (Fig. 10, top graph). At a larger scale, bee diversity increased with hD (Fig. 9C), though this trend was linked to sites dominated by more natural habitat (Fig. 10, bottom graph). These results are also consistent with the known benefits of unmanaged semi-natural areas adjacent to agricultural land; for the most part, variation in the quantity and quality of resources available to bees is dependent on the characteristics of the surrounding landscape (Kremen et al. Reference Kremen, Williams and Thorp2002; Blanche et al. Reference Blanche, Ludwig and Cunningham2006; Pywell et al. Reference Pywell, Warman, Hulmes, Hulmes, Nuttall and Sparks2006; Sheffield et al. Reference Sheffield, Kevan, Westby and Smith2008a, Reference Sheffield, Westby, Smith and Kevan2008b; Hagen and Kraemer Reference Hagen and Kraemer2010; Watson et al. Reference Watson, Wolf and Ascher2011). Cluster analysis of bee fauna similarity among sites also supported this; most sites within COMM-A clustered together, with no clear pattern separating the other three habitats (Fig. 6A). This suggests that a wider range of bee species, normally restricted to more naturalised habitats, are able to use agroecosystems with higher proportions of unmanaged habitat. In an analysis of agricultural landscapes, Banaszak (Reference Banaszak2000) indicated that having at least 25% of the landscape maintained as wild or refuge habitat would support bee populations adequately. With this in mind, agroecosystems can be managed for pollinators by providing habitat with additional food and nesting resources (Tscharntke et al. Reference Tscharntke, Klein, Kruess, Steffan-Dewenter and Thies2005; Pywell et al. Reference Pywell, Warman, Hulmes, Hulmes, Nuttall and Sparks2006; Sheffield et al. Reference Sheffield, Westby, Smith and Kevan2008b; Winfree Reference Winfree2010).
However, the other species richness estimators used in this study, though supporting that COMM-A had the fewest species, also suggested that intermediate sites (COMM-B, ABAND) have significantly fewer species than OLD FIELD. When “hidden” species were included in truncated log-normal plots, or when the data were analysed with ICE or ACE, the two types of commercial orchard habitats (COMM-A, COMM-B) did not differ from each other, and neither differed from unmanaged orchards (ABAND) (Table 2; columns “A–C”). These results have important implications as they suggest that agroecosystems with intermediate levels of natural habitat do not have increased bee species richness, results that contradict the observed species richness and results from rarefaction. As such, species richness metrics alone are not always enough to accurately describe the influence of increasing levels of natural habitats on bee communities, which certainly are important, nor can these metrics alone be used to diagnose bee community health.
Fitting species richness and abundance data to a truncated log-normal distribution has been suggested as a diagnostic for the assessment of ecosystem health (Hill and Hamer Reference Hill and Hamer1998; Hubbell Reference Hubbell2001), including for bee communities (Kevan et al. Reference Kevan, Greco and Belaoussoff1997). Natural communities, which have species abundance distributions that fit a truncated log-normal distribution, are regarded as being mostly independent and large enough to survive with little immigration (reviewed by Hughes Reference Hughes1986), thus are considered “healthy”. In contrast, disrupted, stressed, or nonnatural communities deviate from the log-normal (Preston Reference Preston1948, Reference Preston1980; Kevan et al. Reference Kevan, Greco and Belaoussoff1997; Hill and Hamer Reference Hill and Hamer1998). In this study, rare species made up a high proportion of the fauna, and their presence influenced the shapes of rank-abundance plots (Fig. 2) and contributed to the lack of fit in truncated log-normal plots for all habitats (Fig. 3). The log-normal communities in the study of Kevan et al. (Reference Kevan, Greco and Belaoussoff1997) consisted of species visiting lowbush blueberry flowers in commercial field settings, not the entire bee community within the habitat (i.e., nonblueberry visitors) throughout the season, and departures from log-normal were attributed to differing management regimes and pesticide stress. However, lack of fit to the truncated log-normal may also be due to insufficient sampling (Preston Reference Preston1948), but this interpretation (and the use of the log-normal distribution in general), has come into question (Williamson and Gaston Reference Williamson and Gaston2005). In the present study, “hidden” or uncaptured species were numerous in all habitats (Fig. 3) though greatest in COMM-A and OLD FIELD, and the use of one sampling method only (i.e., yellow pan traps) may have influenced total species capture. Not all bees respond equally to yellow pan traps, and a range of coloured pans (Toler et al. Reference Toler, Evans and Tepedino2005) supplemented with other sampling methods (Roulston et al. Reference Roulston, Smith and Brewster2007; Westphal et al. Reference Westphal, Bommarco, Carré, Lamborn, Morison and Petanidou2008; Grundel et al. Reference Grundel, Frohnapple, Jean and Pavlovic2011; Nielsen et al. Reference Nielsen, Steffan-Dewenter, Westphal, Messinger, Potts and Roberts2011) give fuller representation of bee faunas. Hill and Hamer (Reference Hill and Hamer1998) discuss some of the problems associated with appropriate choice of sampling methods for various taxa. However, as a standard colour and number of pan traps were used in the present study, the biases are consistent across sites, and estimates of richness for the Nova Scotia bee fauna, just over 200 species (Sheffield et al. Reference Sheffield, Dumesh and Cheryomina2011), agree favourably with limits estimated for the OLD FIELD habitats, and the pooled habitats examined in this study.
In other studies of bee communities (e.g., Griswold et al. Reference Griswold, Parker and Tepedino1997; Potts et al. Reference Potts, Vulliamy, Dafni, Ne'eman and Wilmer2003), the log-series distribution was considered the most accurate descriptive abundance model. Preston (Reference Preston1948) regarded the log-series distribution the result of sampling from a log-normal community, the sample being less independent with a large number of rare species due to higher rates of immigration (reviewed by Hughes Reference Hughes1986). Interestingly, Magurran and Henderson (Reference Magurran and Henderson2003) suggested that both log-normal and log-series distributions might be reflective of ecological communities; the “core” species (i.e., those which are persistent, abundant, and biologically associated with the habitat) whose abundance are described by the log-normal distribution, and “occasional” species (i.e., those which occur infrequently, are typically low in abundance, and have differing habitat requirements from the core species) that follow a log-series distribution. Magurran and Henderson (Reference Magurran and Henderson2003) suggest that the lack of fit associated with the presence of rare species in real data sets (e.g., Fig. 3) may be a combinatory result of these distributions. As such, this has potential implications for describing and diagnosing bee communities using the log-normal distribution, and this method on its own (which is also reliant on species richness and abundance data) may also be insufficient.
As indicated by Büchs et al. (Reference Büchs, Harenberg, Zimmermann and Weiß2003), assessment of “biodiversity” (= “species richness”) alone as a method of evaluating habitats and/or stewardship practices is lacking in many regards as it does not consider the complex interactions within communities. This shortcoming applies equally to the use of the truncated log-normal plot for diagnosing bee communities. Bees constitute an incredibly diverse assemblage of life histories, social structure, nesting biology, lifestyles, etc. (Michener Reference Michener2007; Packer Reference Packer2010; Williams et al. Reference Williams, Crone, Roulston, Minckley, Packer and Potts2010), which can be categorised as guilds. Members of each guild have differing requirements, and thus may be categorised as “core” and “occasional” species (as per Magurran and Henderson Reference Magurran and Henderson2003), so it is somewhat unreasonable to generalise the bee community as a whole, especially if habitat comparisons and/or health evaluation are the subjects of investigation. In this study, habitat type had large impacts on the proportional abundance of different bee guilds (Figs. 7–8), with strong negative responses to intense agriculture observed in the abundance of cavity-nesting bees and cleptoparasites; members of these guilds became more numerous in sites containing higher proportions of natural habitat (Figs. 7–8). In contrast, solitary ground-nesting bees were proportionally most abundant in agricultural landscapes (Figs. 7–8), though this may be more an artifact of the lack of other guilds.
As has been demonstrated (Tilman and Lehman Reference Tilman and Lehman2001; Tabor and Aguirre Reference Tabor and Aguirre2004; Oertli et al. Reference Oertli, Muller and Dorn2005; Scrosati et al. Reference Scrosati, van Genne, Heaven and Watt2011), incorporating guilds into ecological studies may offer additional insights into the overall ecological balance maintained within habitats and/or the influence of disturbance. Most terrestrial communities require that functional diversity be maintained; loss of important guilds may ultimately lead to community collapse (Peterson et al. Reference Peterson, Allen and Holling1998). Species data alone do not provide information on functional diversity, though most species within a community can be categorised within functional guilds. Community resilience to disturbance is facilitated not by having diverse species assemblages only, but how species diversity is distributed among functional guilds (Walker Reference Walker1992; Walker et al. Reference Walker, Kinzig and Langridge1999; Elmqvist et al. Reference Elmqvist, Folke, Nyström, Peterson, Bengtsson and Walker2003). As disturbances intensify, changes in guild composition may signify detrimental impacts much earlier and more effectively than species alone. Therefore, knowing the relative proportions of different bee guilds within natural habitats, and monitoring how the guilds respond to habitat disturbances or land management practices may offer a more accurate guideline as to the quality of bee communities in managed/semi-managed landscapes compared with species richness data when considered alone.
Acknowledgements
This research was conducted as part of C.S. Sheffield's graduate studies at the University of Guelph, Guelph, Ontario, Canada and the Atlantic Food and Horticulture Research Centre (AFHRC), Agriculture and Agri-Food Canada, Kentville, Nova Scotia, Canada. We thank all the orchardists and landowners who gave us access to their property during the study. Thanks are also extended to Sue Westby, Rob Smith, Kenna MacKenzie, Debra Moreau, and other employees of the AFHRC, for support and encouragement during the study. Thanks also to Jason Gibbs (York University) for assisting with species identification. Thanks also to David McCorquodale (Cape Breton University) and two anonymous reviewers for helpful comments. Funding for this study came from several Agri-Focus 2000 Technology Development Project grants and an AgriFutures grant to R.F. Smith and C.S. Sheffield.
Appendix 1. The number of individuals of each bee species collected in each habitat type, and the total number of individuals.