INTRODUCTION
Phosphorus is one of the least available macronutrients in soil (Vance et al. Reference Vance, Uhde-Stone and Allan2003) and frequently limits wheat yield in many areas of the world, e.g. Argentina (Berardo Reference Berardo1994; Rodriguez et al. Reference Rodriguez, Andrade and Goudriaan2000), Australia (Elliott et al. Reference Elliott, Reuter, Reddy and Abbott1997; Norrish Reference Norrish2003), Mexico (Egle et al. Reference Egle, Manske, Romer and Vlek1999; Manske et al. Reference Manske, Ortiz-Monasterio, Van Ginkel, González, Rajaram, Molina and Vlek2000, Reference Manske, Ortiz-Monasterio, Van Ginkel, González, Fischer, Rajaram and Vlek2001, Reference Manske, Ortiz-Monasterio, Van Ginkel, Rajaram and Vlek2002), Brazil (Rosa & Camargo Reference Rosa, Camargo and Saunders1991) and sub-Saharan Africa (Daroub et al. Reference Daroub, Gerakis, Ritchie, Friesen and Ryan2003). For this reason, wheat crops are habitually supplied with inorganic P fertilizers. Projections for the year 2020 predict a 50% increase in the demand for phosphorus fertilizers because of the increasing demand for food by the growing world population (Manske et al. Reference Manske, Ortiz-Monasterio, Van Ginkel, González, Rajaram, Molina and Vlek2000). Today, phosphorus is an expensive input used by farmers to achieve a desired crop yield; however, the non-renewable nature of inorganic P fertilizers means that cheap sources of P will be exhausted within the next 60–90 years (Hammond et al. Reference Hammond, Broadley and White2004). In addition, an excess of P added to crops may pollute local watercourses and contribute to the process of eutrophication (Withers et al. Reference Withers, Edwards and Foy2001). Within the general context of environmental and economic concerns, accurate management of phosphorus becomes a key factor for achieving a successful wheat crop.
There is evidence that the main effect of P availability on wheat yield is observed in the number of grains/unit ground area (Elliott et al. Reference Elliott, Reuter, Reddy and Abbott1997; Manske et al. Reference Manske, Ortiz-Monasterio, Van Ginkel, González, Rajaram, Molina and Vlek2000). It has been reported that P deficiency reduces the leaf expansion rate, decreases the number of tillers and increases the thermal time between successive leaf expansions, thus controlling the amount of intercepted solar radiation (Rodriguez et al. Reference Rodriguez, Andrade and Goudriaan1999, Reference Rodriguez, Andrade and Goudriaan2000). However, most of these studies have been carried out either on young plants grown in controlled environments, using short time scales (Plenét et al. Reference Plenét, Etchebest, Mollier and Pellerin2000a), or in small containers with other crops, such as barley (Prystupa et al. Reference Prystupa, Savin and Slafer2004). Other studies of P deficiency at the grain yield level, carried out in fields, have been based on the numerical yield components analysis (Egle et al. Reference Egle, Manske, Romer and Vlek1999; Manske et al. Reference Manske, Ortiz-Monasterio, Van Ginkel, González, Rajaram, Molina and Vlek2000, Reference Manske, Ortiz-Monasterio, Van Ginkel, González, Fischer, Rajaram and Vlek2001, Reference Manske, Ortiz-Monasterio, Van Ginkel, Rajaram and Vlek2002) and not on an assimilate-based approach. In the latter approach, grain number/m2 is interpreted in terms of dry weight of spikes/m2 before grain filling and number of grains/unit of spike weight (Fischer Reference Fischer, Smith and Banta1984, Reference Fischer1993; Abbate et al. Reference Abbate, Andrade and Culot1995; Demotes-Mainard & Jeuffroy Reference Demotes-Mainard and Jeuffroy2001). The dry weight of spikes reflects the quantity of photoassimilates allocated by the crop for the production of flowers (future grains) until anthesis. The photoassimilate supply may determine the survival of initiated flowers and, subsequently, the number of grains/m2 (Fischer Reference Fischer, Smith and Banta1984; Abbate et al. Reference Abbate, Andrade and Culot1995).
Abbate et al. (Reference Abbate, Andrade and Culot1995, Reference Abbate, Andrade, Culot and Bindraban1997) have analysed wheat crops without water or nutrient limitations at Balcarce (latitude, 38°S), and confirmed Fischer's (Reference Fischer1985) results that: (i) intercepted radiation is the main factor determining crop and spike growth until anthesis, (ii) grain number/m2 is positively related to spike dry weight (SDW) and (iii) grain number/m2 is positively related to accumulated intercepted solar radiation during the spike growth period (SGP). However, when the model was used in situations with variable N availability, the conclusions differed between authors. Fischer (Reference Fischer1993) and Demotes-Mainard & Jeuffroy (Reference Demotes-Mainard and Jeuffroy2001) concluded that the number of grains is limited by the supply of carbon assimilates, whereas Abbate et al. (Reference Abbate, Andrade and Culot1995) compared the effects of N and shading and concluded that low N during the SGP reduces the number of grains not only by lowering dry weight of the spike but also by producing other effects which could not be explained in terms of crop carbon economy. More recently, Sinclair & Jamieson (Reference Sinclair and Jamieson2006) have highlighted the importance of resource accumulation, particularly that of N, for both grain number and yield determination, an approach that Fischer (Reference Fischer2008) criticized.
In contrast to nitrogen, there are no reports on the effects of P deficiencies on the relationships between grain number, crop growth, SDW and the quantity of intercepted radiation. The aim of the present paper was to compare the effect of P deficiency with that resulting from reductions in incident radiation, in order to clarify the effect of P on wheat grain number determination. This analysis provides a better understanding of the effects of P deficiency and will thus guide crop management and allow estimation of wheat yield when P supply is limiting. Some of the high P treatment results reported in the present paper have been presented previously by Abbate et al. (Reference Abbate, Andrade, Culot and Bindraban1997).
MATERIALS AND METHODS
Management and experimental design
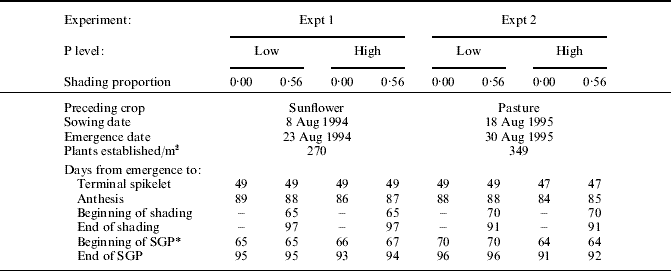
Two experiments were carried out at the Unidad Integrada Balcarce, Argentina (37°45′S, 58°18′W, altitude 130 m asl) during the 1994/95 (Expt 1) and 1995/96 (Expt 2) growing seasons. The soil was a loamy, illitic, thermic, typic Argiudoll (Soil Survey Staff 2003) with approximately 6·0 g organic matter/kg soil in the top 250 mm and adequate K fertility (>2·8 mmol/100 g). A commercial spring bread wheat cultivar (Prointa Oasis) was tested. The experiments combined two P levels (low and high as main treatments) and two radiation levels (shade and control as sub-treatments) in a split-plot design with three (Expt 1) and four (Expt 2) complete randomized blocks. The available P in the top 200 mm of the low P level treatment was 7 mg P/kg (Bray I) in Expt 1 and 5·5 mg P/kg in Expt 2. These soil P levels were deficient according to the local calibration (Berardo, Reference Berardo1994). The high P treatments were fertilized with 80 and 84 kg P/ha in experiments Expt 1 and Expt 2, respectively, in order to assure non-limiting P availability. The fertilizer was broadcast and incorporated before sowing. Two levels of radiation were applied during the SGP. The levels were natural radiation incidence (0·00 shading) and shade (0·56 of the natural radiation incidence). Shade was achieved by means of black nets placed 100–200 mm above the canopy. Mean temperature under the nets over a 24 h cycle was 1·5°C lower, while mean maximum temperature was 5·2°C lower and mean minimum temperature was 0·9°C higher, than in unshaded plots (Abbate et al. Reference Abbate, Andrade, Culot and Bindraban1997). The subplots were 7·5 m long, 7 or 10 rows wide and with rows 0·15 m apart in Expt 1 and 0·20 m apart in Expt 2. All treatments received 253 kg N/ha applied in three equal applications to ensure adequate N supply. These amounts of fertilizer were enough to ensure adequate nutrient supply. Expt 1 was rain fed, whereas Expt 2 was irrigated until maturity to ensure sufficient water availability. The experiments were free of pests and diseases. Seeds were treated with a benomyl–thiram mixture before seeding and weeds were controlled with a commercial mixture of metsulfuron metil (5 g a.i./ha) and dicamba (60 g a.i./ha) (Misil II). The number of established plants, duration of the period, levels of shading recorded at noon and relevant dates of experiments are presented in Table 1.
Dates and number of days from emergence of wheat (cv. Prointa Oasis) to key growth stages for experiments Expt 1 and Expt 2, at Balcarce (high P data from Abbate et al. Reference Abbate, Andrade, Culot and Bindraban1997)
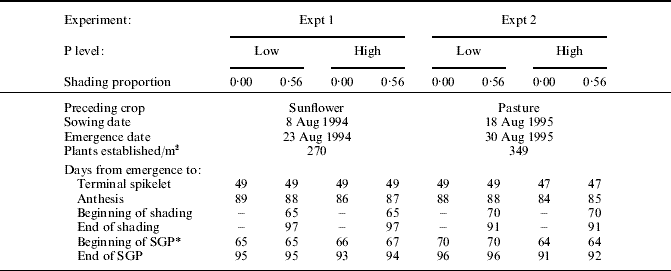
* SGP, spike growth period.
Plant sampling and measurements
Emergence date was considered as the date when half of the plants had their first leaf emerged to approximately 10 mm. Date of terminal spikelet (when the first floral primordium was observed in the terminal spikelet) was determined by dissection of four randomly selected main stem shoot apices per plot every 2–4 days. Date of anthesis was defined as the moment when half of the spikes exposed at least one anther. The dates were determined by linear interpolation from measurements made on 40 randomly selected spikes per plot, every 2–3 days. To measure crop dry weight (CDW), plants were cut at ground level, dried at 56°C for 10 days to constant weight and weighed. Sample size was four to five innermost rows wide and 0·4–0·6 m long before anthesis, 0·6–0·7 m long after anthesis and 0·7–0·8 m long after maturity. A distance of at least 0·35 m was left as borders between successive quadrants. A subsample of shoots was dissected into leaf lamina stems (including leaf sheaths) and spikes, even when they were small (length >5 mm). After anthesis, the number of spikes per unit of area was calculated. In a subsample of spikes, the immature grains were removed to determine dry weight of non-grain spikes. The green area index (GAI) was determined by measuring the area (one side) of all green organs (i.e. leaves, stems and spikes when present) in a subsample of shoots, with an area meter LI-3000 (LI-COR, Lincoln, Nebraska, USA). After physiological maturity, plots were hand-harvested and all spikes of the sample were threshed. The grains were winnowed and afterwards dried and weighed to determine yield. A grain subsample was taken and manually cleaned to determine dry weight/grain by counting, drying and weighing two groups of 500 grains each. The number of grains/unit area (GN) was estimated by dividing yield by the individual grain dry weight.
The SGP was considered as in Abbate et al. (Reference Abbate, Andrade, Culot and Bindraban1997), i.e. the interval during which the spikes achieved from 0·05 to 1·00 of the non-grain weight they had accumulated by day 7 after anthesis. Linear interpolation of spike and CDW through time was used to estimate CDW at the beginning of spike growth. All treatments were sampled on the same date; the difference between sampling time and the end of spike growth was −1 to 3 days. During the SGP, mean growth rates (g/m2/d) of crop (CGR) and spikes (SGR) were calculated, and mean dry weight partitioning to spikes was calculated as SGR/CGR and expressed as a proportion. Weather records (Table 2) were obtained from a meteorological station located approximately 1 km away from the experimental site. Daily proportion of incident photosynthetically active radiation (PAR=0·5 of total radiation) that was intercepted by the crop (intercepted PAR (IPAR)) was calculated as (1−PARi/PARo), where PARi was the incident PAR just above the lowest layer of dead leaves and PARo was the incident PAR above the crop canopy. The values of PARi and PARo were measured with a line quantum sensor (LI-COR 191SB, LI-COR, Lincoln, Nebraska, USA) connected to a radiometer (LI-COR 188 B). The measurements were taken at midday, placing the sensor perpendicularly to the rows. Approximately one recording per metre of plot was taken. IPAR was measured every 10–15 days; IPAR between measurements was obtained by linear interpolation over time. IPAR (MJ/m2/d) for each day was calculated as the product of the corresponding daily IPAR fraction and daily incident PAR. Radiation-use efficiency (RUE, g/MJ) was calculated as the ratio between CGR and the mean IPAR during the SGP. Also, the Fischer's (Reference Fischer1985) photothermal quotient (MJ/m2/d/°C), defined as the ratio of mean IPAR to mean air temperature minus 4·5°C (developmental base temperature) during the period from 20 days before to 10 days after anthesis (Abbate et al. Reference Abbate, Andrade and Culot1995) was calculated for each plot.
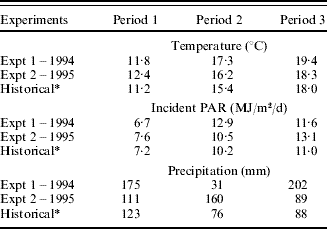
Mean temperature, incident PAR and rainfall from emergence to beginning of the SGP (period 1), during the SGP (period 2) and from anthesis to 35 d after (period 3), for high P and unshaded treatments of 1994 and 1995 experiments (from Abbate et al. Reference Abbate, Andrade, Culot and Bindraban1997) and historical values at Balcarce
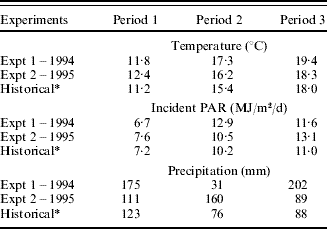
* Mean of 1970–2005 period.
In Expt 2, pairs of main shoots or first tiller spikes with the same number of spikelets and same day of anthesis were selected and tagged 3–5 days after anthesis. Five pairs were selected in each plot. Spikelets in one member of each pair were removed with scissors, leaving only the four central ones, two on each side of the rachis. At maturity, the grains of the trimmed spikes and the corresponding grains of untrimmed spikes were harvested. Grains were counted, dried and weighed. Weight per grain of trimmed spikes was considered as an estimator of potential weight/grain and the difference between the weights/grain of trimmed and untrimmed spikes was used as an estimator of the degree of source limitation (Fischer & HilleRisLambers Reference Fischer and Hillerislambers1978).
Statistical analyses
Differences between treatment means in each experiment were examined if the analysis of variance revealed significant differences. Regression analysis was used with treatment means. The level of significance used was P<0·05 in all statistical tests.
RESULTS
Yield and components
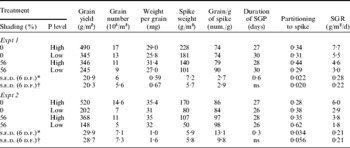
Phosphorus deficiency reduced yield by 30% in Expt 1 and by 61% in Expt 2 (Table 3). In Expt 2, yield in low P was 41% lower than that in Expt 1, and the available soil P was 21% lower in Expt 2 than in Expt 1. On the other hand, yield with high P was only 5% greater in Expt 2 as compared to that in Expt 1. Shading, which reduced incident radiation during the SGP to 0·56 of full (unshaded) incident radiation, reduced yield by 30% in both experiments. The effect of P deficiency and shading on yield can be analysed in terms of their effect on weight/grain and GN.
The effects of P deficiency and crop shading on dry grain yield, grain number and dry weight per grain at maturity; grain number per unit of spike weight (excluding grain weight) at the end of the SGP; partitioning to spikes and SGR, during the SGP, in Expt 1 and Expt 2 for cv. Prointa Oasis at Balcarce (high P data from Abbate et al. Reference Abbate, Andrade, Culot and Bindraban1997)
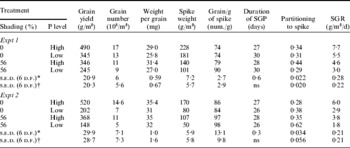
ns: not significant (P>0·05).
* Standard errors of mean differences to compare P treatments at the same levels of shading.
† Standard errors of mean differences to compare shading at the same or different levels of P deficiency.
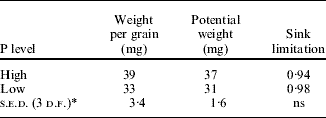
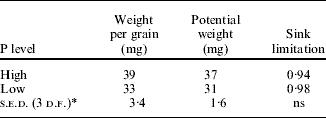
Weight per grain was affected by P deficiency, but the reduction on weight in low P as compared with high P was only 12% (mean of both experiments, Table 3). This reduction is far smaller than that observed for grain yield. In Expt 2, weight/grain of whole and trimmed spikes was compared and found to be similar (Table 4). Both grain number and yield were reduced by P deficiency and shading, without a significant P×shading interaction. The decrease in GN in low P as compared with that in high P was 19% in Expt 1 and 56% in Expt 2 (mean of with and without shading, Table 3).
Weight per grain (weight per grain of central spikelets of untrimmed spikes), potential weight per grain (weight of grain of trimmed spikes) and degree of sink limitation (actual/potential), with and without P fertilization, in experiment Expt 2 for cv. Prointa Oasis, at Balcarce
ns: not significant (test F, P>0·05).
* Standard error of mean differences to compare P level.
Grain yield was highly and positively correlated with GN (R 2=0·99, P⩽0·001) but not with weight per grain (R 2=0·38, P=0·08). To remove secondary environmental effects on Expt 1 and Expt 2, the correlations were carried out using standardized deviations calculated as: (treatment value−experiment mean)/experiment mean. The above results clearly indicate that the effects of P deficiency and shading on yield were mainly due to a proportional reduction in GN and not in the weight/grain.
Grain number and dry weight of spikes
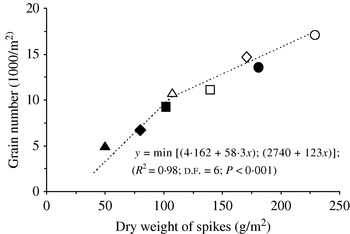
The effects of P deficiency and shading on GN were analysed in terms of (i) the dry weight of spikes/m2 (SDW) before grain filling and (ii) the number of grains/unit of spike weight. The number of grains/unit of spike weight was not affected by P deficiency or shading in Expt 2, but an increase in the number of grains/unit of spike weight in the shading treatment was observed in Expt 1 (Table 3). The GN and SDW of all treatments were compared with the two regression lines obtained by Abbate et al. (Reference Abbate, Andrade, Culot and Bindraban1997) to obtain more information about the relationship between both variables (Fig. 1). No particular deviation was observed in the relationship between GN and SDW for P deficiency with respect to the regression lines obtained without P deficiency with the same cultivar as that described in Abbate et al. (Reference Abbate, Andrade, Culot and Bindraban1997). Therefore, the reduction in GN as a result of P deficiency and shading is explained by a reduction in SDW.
Number of grains (measured 7 days after anthesis) as a function of dry weight of spikes by the end of their growth period in experiments Expt 1 and Expt 2, with cv. Prointa Oasis at Balcarce (high P data from Abbate et al. Reference Abbate, Andrade, Culot and Bindraban1997). The two-line regression was obtained by Abbate et al. (Reference Abbate, Andrade, Culot and Bindraban1997) without deficiency. Symbols in Expt 1: ○ without shading, high P level; • without shading, low P level; □ with shading, high P level; ▪ with shading, low P level and in Expt 2: ◊ without shading, high P level; ◆ without shading, low P level; ▵ with shading, high P level; ▴ with shading, low P level. The s.e.d. are shown in Table 3.

SDW was reduced notably by both P deficiency and shading (Table 3). Low P reduced SDW by 24% in Expt 1 and by 53% in Expt 2 (Table 3) as compared with high P (mean of with and without shading). Shading reduced SDW by 42% in Expt 1 and by 37% in Expt 2 (mean of with and without P deficiency) and P×shading interaction effects were not statistically significant.
SDW before grain filling is a product of the SGR and the duration of the SGP. The mean duration of SGP was 28 days, with differences of less than 3 days between treatments and experiments (Table 1). No differences were found in the duration of the SGP between shaded and non-shaded treatments; however, P deficiency slightly increased the SGP (Table 3) in Expt 1.
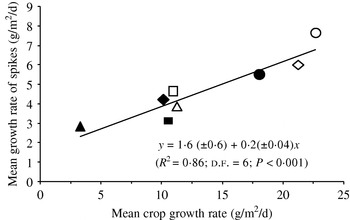
The SGR is a product of CGR and the proportion of crop growth that is partitioned to the spike. Dry matter partitioning towards the spikes was different in each experiment (mean value: 0·41 for Expt 1 and 0·34 for Expt 2, Table 3). In Expt 1, P deficiency diminished dry weight partitioning to shoots but did not affect the partitioning to spikes (Table 3). In Expt 2, partitioning was increased by both P deficiency and shading. A clear linear relationship between SGR and CGR (Fig. 2) was found throughout all treatments (R 2=0·86; d.f.=6; P⩽0·01). The slope of this relation was 0·23±0·038 and the intercept was greater than zero (1·6±0·56 g/m2/d; Fig. 2). Furthermore, partitioning to spikes was not related to SDW at the end of the SGP.
SGR mean and mean CGR during the SGP, in experiments Expt 1 and Expt 2 with cv. Prointa Oasis at Balcarce (high P data from Abbate et al. Reference Abbate, Andrade, Culot and Bindraban1997). Symbols in Expt 1: ○ without shading, high P level; • without shading, low P level; □ with shading, high P level; ▪ with shading, low P level and in Expt 2: ◊ without shading, high P level; ◆ without shading, low P level; ▵ with shading, high P level; ▴ with shading, low P level. The s.e.d. are shown in Tables 3 and 5.

Crop growth during the SGP
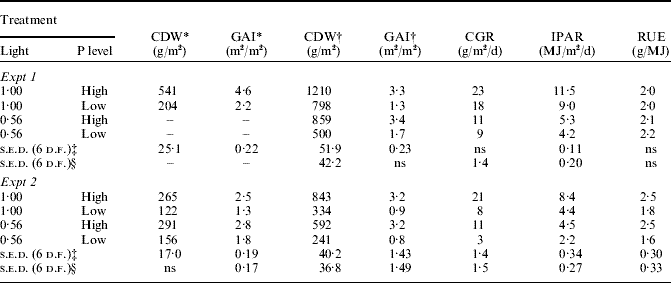
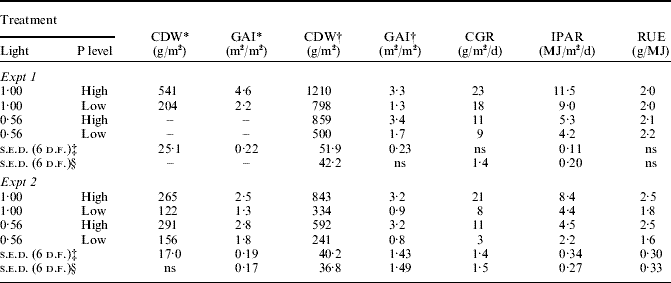
Crop growth was reduced by P deficiency from very early stages of crop development (Table 5). As compared with high P, low P decreased CDW and GAI at the beginning of the SGP by 62% in Expt 1 and by 50% in Expt 2 (Table 5). At the end of the SGP, 7 days after anthesis, CDW in low P was 35 and 60% lower than in high P treatments in Expt 1 and Expt 2, respectively (mean of with and without shading). Reductions in GAI due to P deficiency were 54% in Expt 1 and 73% in Expt 2 (Table 5).
The effects of P deficiency and shading on: CDW and GAI at the beginning and at the end of the SGP; CGR; IPAR; RUE during the SGP in experiments Expt 1 and Expt 2 for cv. Prointa Oasis at Balcarce (high P data partially taken from Abbate et al. Reference Abbate, Andrade, Culot and Bindraban1997)
ns: not significant (P>0·05).
* Beginning of SGP.
† End of SPG.
‡ Standard errors of mean differences to compare P treatments at the same levels of shading.
§ Standard errors of mean differences to compare shading at the same or different levels of P deficiency.
Shading during the SGP decreased CDW by 30% in both experiments (Table 5) but no effects on GAI were detected (Table 4). No P×shading interaction was found for CDW or GAI. IPAR was affected by P deficiency and shading. P deficiency reduced IPAR more in Expt 2 than in Expt 1 (Table 5). The CGR was linearly related to IPAR (R 2=0·92; P=0·004). The slope of this relationship (2·2±0·09 g/MJ) represented the mean RUE since the constant term did not differ from zero.
With high P, the RUE of the non-irrigated experiment Expt 1 was 2·0 g/MJ (Table 5) whereas that corresponding to the irrigated experiment Expt 2 reached 2·5 g/MJ. Shading did not affect RUE. Phosphorus deficiency reduced RUE by 36% in Expt 2, but no effect was found in Expt 1 (Table 5). However, the effect of P deficiency on CGR during the SGP was higher than on RUE (mean fall for both experiments in CGR was 67%, Table 4).
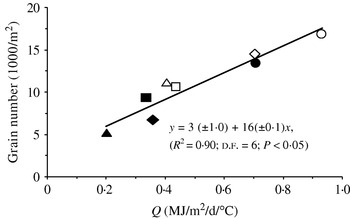
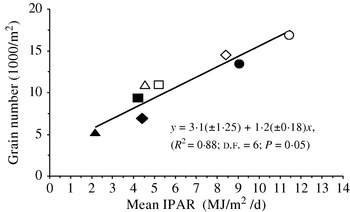
Despite the changes in grains/spike weight and RUE (Table 5 and Fig. 2) among treatments and experiments, there was a unique and highly significant correlation between GN and the photothermal quotient (Q) (GN=2810(±1220)+15820(±2190)Q; R 2=0·90; P⩽0·05; Fig. 3). The temperature during the SGP changed less than 7% between experiments (Table 2) and even less between shading treatments. Therefore, the relationship between GN and Q was mostly controlled by intercepted radiation. Consequently, GN was linearly correlated with the mean IPAR during the SGP (R 2=0·85; P⩽0·01; Fig. 4).
Number of grains per unit of surface as a function of the photothermal quotient (Q) in experiments Expt 1 and Expt 2, with cv. Prointa Oasis at Balcarce (high P data from Abbate et al. Reference Abbate, Andrade, Culot and Bindraban1997). Symbols in Expt 1: ○ without shading, high P level; • without shading, low P level; □ with shading, high P level; ▪ with shading, low P level and in Expt 2: ◊ without shading, high P level; ◆ without shading, low P level; ▵ with shading, high P level; ▴ with shading, low P level. The s.e.d. of grain number are shown in Table 3.

Number of grains per unit of surface as a function of IPAR during the SGP in experiments Expt 1 and Expt 2, with cv. Prointa Oasis at Balcarce (high P data from Abbate et al. Reference Abbate, Andrade, Culot and Bindraban1997). Symbols in Expt 1: ○ without shading, high P level; • without shading, low P level; □ with shading, high P level; ▪ with shading, low P level and in Expt 2: ◊ without shading, high P level; ◆ without shading, low P level; ▵ with shading, high P level; ▴ with shading, low P level. The s.e.d. are shown in Tables 3 and 5.

DISCUSSION
Yield
Grain yield was reduced by P deficiency and shading. However, while the reduction in yield produced by shading was similar in both experiments, the reduction produced by P deficiency was higher at Expt 2 (Table 3). These differences in the effects of P stress between experiments may be attributed to differences in soil P availability. In Expt 2, available soil P was 21% lower than in Expt 1 and yield in low P was 41% lower in Expt 2 than in Expt 1; however, yield with high P was very similar in both years.
Although weight/grain was slightly lower (10–14%) with P deficiency, the effects of P-stress and shading on yield were mainly associated with a reduction in GN (Table 3). Rodriguez (personal communication) and Egle et al. (Reference Egle, Manske, Romer and Vlek1999) also found that weight/grain is relatively unaffected by P deficiency and that the differences in grain yield under P stress are determined only by its effects on the yield components defined early in the growing season. Moreover, the equivalence of the weight/grain of whole and trimmed spikes (Table 4) indicates that the degree of source limitation was not affected when P deficiency reduced sink number. Plenét et al. (Reference Plenét, Mollier and Pellerin2000b) reached a similar conclusion for maize. Nevertheless, potential grain weight with P deficiency was lower than that of non P-stressed plants (Table 4).
SDW
SDW just before grain filling is the result of the product between the duration of the SGP and the SGR. Although differences were found in the present work in the duration of the SGP (Table 3), these results are not conclusive. Phosphorus deficiency increased the SGP slightly (Table 3) in Expt 1; while, on the contrary, in Expt 2 the duration was only 1 day shorter in low P treatments. Rodriguez (Reference Rodriguez1998) found a greater effect of P deficiency on wheat development, reporting a 14-day delay in anthesis with severe P stress. However, the difference in the duration of the double ridge to anthesis period was only 4 days. With P levels similar to those used in the present experiments, Rodriguez et al. (Reference Rodriguez, Andrade and Goudriaan2000) found that different P treatments reached terminal spikelet at the same moment, in spite of a delay in early developmental states. A delay in the anthesis date (12 days) has also been found in severely P deficient soils in Australia (Elliott et al. Reference Elliott, Reuter, Reddy and Abbott1997).
Working with N deficiency, neither Abbate et al. (Reference Abbate, Andrade and Culot1995) nor Demotes-Mainard et al. (Reference Demotes-Mainard, Jeuffroy and Robin1999) observed important changes on the duration of the SGP. Those authors concluded that the duration of the SGP was slightly altered by the N treatments, and that the changes in SDW near anthesis may be mainly attributed to differences in the SGR. This conclusion is also valid for P deficiency.
The SGR was analysed through the CGR and the proportion of biomass partitioned to the spikes. The slope of the relationship between the SGR and the CGR was positive and the intercept was greater than zero (Fig. 2). A positive intercept has also been found in other field experiments by Wall (Reference Wall1979), Fischer (Reference Fischer1985) and Abbate et al. (Reference Abbate, Andrade and Culot1995, Reference Abbate, Andrade, Culot and Bindraban1997). This positive intercept indicates an increase in partitioning towards reproductive organs in poor growth conditions. An increase in the partitioning to reproductive organs has been found when treatments of shading or N deficiency were used (Fischer Reference Fischer1993; Abbate et al. Reference Abbate, Andrade and Culot1995; Demotes-Mainard & Jeuffroy Reference Demotes-Mainard and Jeuffroy2001). Shading and P deficiency clearly increased the partitioning toward the spikes in Expt 2 but not in Expt 1 (Table 3). The mean partitioning to spikes of both experiments in high P treatments was 0·31, which is within the range (0·30–0·33) found for the same cultivar by Abbate et al. (Reference Abbate, Andrade, Lázaro, Bariffi, Berardocco, Inza and Marturano1998) when studying modern Argentinean cultivars. Additionally, Fischer (Reference Fischer1993) found that N-stress before the SGP appears to lead to greater partitioning to the spike during the preanthesis period than when the N stress was later. In Expt 2, the CGR before the SGP was lower than in Expt 1 (Table 5). This could explain the greater partitioning to spike in Expt 2 as compared with Expt 1. The same reasoning could be applied to the increased partitioning to spike observed in low P in Expt 2. In barley, Prystupa et al. (Reference Prystupa, Savin and Slafer2004) found no or only slight effects of P deficiency on partitioning to the spike measured as the ratio of spike and crop dry matter at flowering. However, these results could not be fully comparable with those from the present work, because this proportion can be affected by differences in crop growth previous to the SGP and also because they were obtained in plants grown in containers. The SDW at the end of the SGP was not correlated to partitioning but to the CGR; therefore, the main effect of P deficiency on SDW is the result of its effect on the CGR instead of on partitioning to the spike.
Crop growth during the SGP
The lower dry weight of spikes/m2 induced by P deficiency and low radiation was mainly due to a reduction in the CGR during the SGP. This is because differences in the duration of that period and dry matter partitioning to spikes were not relevant. However, the CGR was linearly related to the mean IPAR during the SGP (R 2=0·92, P⩽0·01), but not to RUE (R 2=0·18, P=0·30).
The RUE during the SGP, without P deficiency, of Expt 2 (2·5 g/MJ) was close to that reported by Abbate et al. (Reference Abbate, Andrade, Culot and Bindraban1997) for the same cultivar and phenologic period (2·7 g/MJ), and also to the values found for other cultivars by other authors (Gallagher & Biscoe Reference Gallagher and Biscoe1978; Whitfield & Smith Reference Whitfield and Smith1989; Fischer Reference Fischer1993; Robertson & Giunta Reference Robertson and Giunta1994; Abbate et al. Reference Abbate, Andrade, Lázaro, Bariffi, Berardocco, Inza and Marturano1998; Shearman et al. Reference Shearman, Sylvester-Bradley, Scott and Foulkes2005) for wheat growth until anthesis in non-limiting nutritional and water availability. However, RUE of Expt 1 was 26% lower. Loomis & Amthor (Reference Loomis, Amthor, Reynolds, Rajaram and McNab1996) calculated that the theoretical upper limit of dry matter production by wheat crops is in the range of 3–4 g/MJ based PAR. Warm temperature, low concentration of CO2 relative to O2 and the limit of light saturation inhibit the attainment of greater RUE (Loomis & Amthor Reference Loomis, Amthor, Reynolds, Rajaram and McNab1996), but none of these appear to be the cause of the lower RUE in Expt 1. Fischer (Reference Fischer1993) suggested that frosts could explain low RUE values, but no frost episodes occurred in either of the experiments presented here. In the unwatered Expt 1, rainfall during the SGP was 80% lower than that in Expt 2 (Table 1); consequently, its low RUE is likely to be due to water stress in this period. Gallagher & Biscoe (Reference Gallagher and Biscoe1978), Whitfield & Smith (Reference Whitfield and Smith1989) and Robertson & Giunta (Reference Robertson and Giunta1994), among others, have reported reduced RUE in water-stressed crops.
Sinclair & Shiraiwa (Reference Sinclair and Shiraiwa1993) hypothesized that increased diffuse radiation coupled with decreased irradiance in soybean crops results in increased RUE. This could have happened in the shading treatments; however, shading did not change the RUE in either of the two experiments (Table 4). This consistency in RUE coincides with that measured in other works with shading (Fischer Reference Fischer1985; Abbate et al. Reference Abbate, Andrade, Culot and Bindraban1997; Rodriguez et al. Reference Rodriguez, Andrade and Goudriaan2000).
In the present study, P deficiency reduced RUE by 15% (Table 5). Rodriguez et al. (Reference Rodriguez, Andrade and Goudriaan2000), with the same cultivar but during the period preceding the SGP, also observed that RUE was significantly affected by P deficiency. However, in the present study, the effect of P deficiency on the GAI (mean reduction 64%) and the CGR (mean reduction 44%) during the SGP was higher (Table 5) than the effect on RUE. In maize crops grown in field conditions, Plenét et al. (Reference Plenét, Etchebest, Mollier and Pellerin2000a, Reference Plenét, Mollier and Pellerinb) also showed that P deficiency primarily affects leaf area and subsequently the amount of absorbed PAR, but only affects the RUE slightly.
Grain number and SDW
Phosphorus deficiency decreased the GN and SDW (Table 3). When water and nutrients are non-limiting, changes in the GN can be interpreted by the ‘assimilate approach’, i.e. through the carbohydrate supply to reproductive organs (Fischer Reference Fischer, Smith and Banta1984, Reference Fischer1985; Abbate et al. Reference Abbate, Andrade and Culot1995, Reference Abbate, Andrade, Culot and Bindraban1997; Demotes-Mainard & Jeuffroy Reference Demotes-Mainard and Jeuffroy2004). This supply can be quantified by means of SDW 7 days after anthesis excluding grain weight (Abbate et al. Reference Abbate, Andrade, Culot and Bindraban1997). The GN and SDW of all treatments of the present study were compared with the two-line relationship obtained by Abbate et al. (Reference Abbate, Andrade, Culot and Bindraban1997) (Fig. 1). As this last relationship was obtained by natural or imposed changes in incident radiation, it can be considered that it shows the effect of crop photosynthesis and assimilate supply to the spikes and grains. No particular deviation was observed between the GN and SDW of treatments with P deficiency with respect to Abbate's regression obtained with the same cultivar and without P deficiency. Moreover, the association between the GN of all treatments of the present study with Q was highly significant (R 2=0·90; P=0·03). In contrast with the present study, when clustered with and without N deficiency treatments, no unique linear regression was obtained (Abbate et al. Reference Abbate, Andrade and Culot1995). In addition, the relationship between SDW of all treatments (with and without P deficiency or shading) and Q was strong (R 2=0·93; P⩽0·01, d.f.=6). The regression coefficient of 231±25·8 g of spikes/m2 per unit of photothermal quotient was greater than that obtained by Abbate et al. (Reference Abbate, Andrade and Culot1995) (114±12·4) with an older cultivar and the treatments with the highest levels of N.
The present results support the idea that the effects of P deficiency on the GN could be fully explained by variations in the availability of assimilates to sustain flower growth. This is in contrast to the additional depressor effect of N-deficiency on the GN observed by Abbate et al. (Reference Abbate, Andrade and Culot1995). Possible differences between the responses of the GN to changes in SDW could be due to greater growth reduction in the early growth stages; while Abbate et al. (Reference Abbate, Andrade and Culot1995) showed greater growth reduction during the SGP. In the present study, the reduction in growth caused by P deficiency was 56% at the beginning of the SGP (mean of all shading treatments of both experiments) and 38% during the SGP. However, Abbate et al. (Reference Abbate, Andrade and Culot1995) showed that the reduction in growth caused by N deficiency was 7% at the beginning and 25% during the SGP (mean of extreme N treatments). These differences in evolution between P and N stress are typical of the Argentine Pampas, and several sets of data (Spiertz & Ellen Reference Spiertz and Ellen1978; Ellen & Spiertz Reference Ellen and Spiertz1980; Spiertz Reference Spiertz, Hurd, Biscoe and Dennis1980; Fischer Reference Fischer1993; Abbate et al. Reference Abbate, Andrade and Culot1995; Rodriguez & Goudriaan Reference Rodriguez and Goudriaan1995; Plenét et al. Reference Plenét, Mollier and Pellerin2000b) suggest that this is the case in other wheat regions of the world. However, if N deficiency is severe early in the crop growth cycle and remains stable during the SGP, no particular N-effect is expected on GN (Fischer Reference Fischer1993; Abbate Reference Abbate1999; Demotes-Mainard & Jeuffroy Reference Demotes-Mainard and Jeuffroy2004).
Abbate et al. (Reference Abbate, Andrade and Culot1995) and Sinclair & Jamieson (Reference Sinclair and Jamieson2006) have hypothesized that spike N concentration in addition to SDW (i.e. spike N-accumulation) are critical factors in determining both the GN and yield in wheat. The strong relationship between GN and SDW (Fig. 1), even with P deficiencies, suggests that spike N would be a critical estimator of grain number only in the presence of N deficiencies.
The conclusions from this work are that phosphorus deficiency did not have a significant effect on the relationship between the GN and SDW. This suggests that the decrease in yield induced by P deficiency is due mainly to the fact that the crops produce lower quantities of photoassimilates during the SGP and have a reduced GN, which is, in turn, due mainly to a reduction in the IPAR during the SGP. The GN of the treatments with and without P deficiency was linearly correlated with the mean IPAR during the SGP. This relationship was close to that obtained by Abbate et al. (Reference Abbate, Andrade, Culot and Bindraban1997) in crops without P deficiency. This occurred because: (i) temperature during the SGP changed less than 5% between years and treatments, (ii) the duration of the SGP and partitioning to spike were slightly affected by P deficiency and (iii) intercepted radiation was the main factor that determined both crop and spike growth.
As the P deficiency controls the GN through light interception, the estimation of growth and yield of wheat under P deficiency requires measurement of IPAR accumulated during the SGP. This would improve calculation of yield in regions subjected to P deficiency using remote data of interception radiation.
We would like to thank Silvia Benson for her help with translation. This work is part of a thesis submitted by L. Lázaro in partial fulfilment of the requirements for the Doctor's degree, Universidad Nacional de Mar del Plata.