

Introduction
Real convergence is the process whereby lower-income economies' GDP per capita levels catch up with those of higher-income economies (Del Hoyo et al., Reference Del Hoyo, Dorrucci, Heinz and Muzikarova2017). The literature on real convergence began to be widely discussed in the 1980s. Its many concepts (e.g. absolute, sigma, and beta convergence) have been developed to explain the economic growth of countries or regions (Soukiazis and Cravo, Reference Soukiazis and Cravo2008). A recent IMF report (IMF, 2021) suggests that economic divergence across countries is a significant concern, implying that the topic still holds a relevant place in the macroeconomic agenda.
The empirical studies on real convergence encompass, in general, the analysis of a large sample of countries (e.g. Barro, Reference Barro1991; Bernard and Durlauf, Reference Bernard and Durlauf1995; Cartone et al., Reference Cartone, Postiglione and Hewings2021; Mankiw et al., Reference Mankiw, Weil and Romer1992; Popov and Jomo, Reference Popov and Jomo2018). Although these analyses are of high scientific relevance, they missed a great deal in explaining the convergence experience by individual economies since the understanding of the fundamental determinants of catching up (or falling behind) is improved by looking at a specific country's performance over a long period (Lains, Reference Lains2003; Tóth, Reference Tóth2019).
The studies devoted to examining the catching-up process of a country compared to leading and/ or similar economies in an isolated fashion are scarce. The few existing contributions mainly encompass the analysis of emerging economies (EEs) from Eastern Europe and Asia (e.g. Barro, Reference Barro2016; Lee, Reference Lee2016; Miron et al., Reference Miron, Dima and Paun2009; Ozturk et al., Reference Ozturk, Ay and Keser2013; Tóth, Reference Tóth2019), and some developed countries (e.g. Aguiar and Figueiredo, Reference Aguiar and Figueiredo1999; Kokkinen et al., Reference Kokkinen, Jalava, Hjerppe and Hannikainen2007; Micallef, Reference Micallef2020; Papaconstantinou et al., Reference Papaconstantinou, Tsagkanos and Siriopoulos2013). For instance, the Asian EEs (China and South Korea) have presented significant real convergence towards the USA from 1960 to 2010. In contrast, the Eastern Europe EEs (Hungary, Romania, and Turkey) have shown unsatisfactory economic performance to reach their peers or the European mean. Apparently, the heterogeneity of the EEs on different continents regarding economic structures and development models urges for real convergence studies addressing countries within this group, namely the overlooked context of Latin America (herein addressed as LA).
Although LA EEs have grown enormously during part of their development history, they nevertheless presented unstable, short, and interrupted periods of catching up (Lee, Reference Lee2020). One of the very few studies that analysed 18 LA countries versus the US between 1950 and 2000, King and Ramlogan (Reference King and Ramlogan2008), resorted to unit root tests and concluded that no evidence was found of unconditional convergence in LA with almost all these economies not even catching up with the US by 2000. As one of the LA EEs, Brazil has recorded periods of high growth rates, especially between 1960 and 1980, albeit it has not yet moved towards a sustainable convergence path, implying the inability to close the per capita income gap with developed countries (Arbache and Sarquis, Reference Arbache, Sarquis, Amann, Azzoni and Baer2018).
Previous and relatively sparse country level studies that have examined Brazilian real convergence – vis-à-vis the US (King and Ramlogan, Reference King and Ramlogan2008; Lara and Prado, Reference Lara and Prado2023), other BRICS (e.g. Russia, India, China, and South Africa) (Das and Nayak, Reference Das and Nayak2023), or other countries (Skare et al., Reference Skare, Porada-Rochon and Stjepanovic2021) –, involving long (1950–2000: King and Ramlogan, Reference King and Ramlogan2008; 1912–2019: Lara and Prado, Reference Lara and Prado2023) or relatively short periods (1991–2019: Das and Nayak, Reference Das and Nayak2023; 1994–2020: Skare et al., Reference Skare, Porada-Rochon and Stjepanovic2021) assessed whether convergence/divergence is observed, but did not explained which factors influenced such paths.
Besides assessing the real (div)convergence, our study estimates the extent to which human capital and institutional quality influence the Brazilian catching up/falling behind process towards LA6, Portugal, and the US. The relevance of these latter variables has been analysed by several recent studies, such as Campos et al. (Reference Campos, Karanasos and Tan2020, Reference Campos, Glebkina, Karanasos and Koutroumpis2023), Chhabra et al. (Reference Chhabra, Giri and Kumar2023), and Doré and Teixeira (Reference Doré and Teixeira2023), although they focus on Brazil's economic growth and not on the country's real (div)convergence process. Although of high relevance, these studies miss a great deal in analysing and discussing potential explanatory factors associated with real convergence/divergence of Brazil towards other economies. Nowadays, one of the main issues that worry economists who study economic growth is whether poorer/laggard countries are converging towards richer/more advanced nations or instead if income and production gaps between nations are growing (Rodrik, Reference Rodrik2022). As underlined by di Vaio et al. (Reference di Vaio, Zeira and Battisti2014), ‘[t]his question is empirical, but it has important theoretical implications, as (…) main growth theories predict convergence between countries’. As apparently is the case, urgent growth and convergence determinants for the country (Doré and Teixeira, Reference Doré and Teixeira2022), namely institutional quality and human capital formation, have been overlooked in the extant literature, thereby constituting a challenging avenue to be addressed. Thus, in a novel way, the present paper examines and attempts to explain Brazil's real convergence towards other LA EEs, Portugal, its alma matter, Portugal, and the US, the commonly regarded technological frontier country, over a very long time period (1822–2019).
An additional scientific novelty and contribution of the present study involves the use of nonlinear econometric estimations by resorting to Markov Regime-Switching (MS) autoregressive models, which enable to examine the impact of institutional quality and human capital on Brazil's long-term relative economic performance in two different regimes: real convergence (catching up) and real divergence (falling behind). These non-linearities evidence that the relation between institutional quality, human capital, and a country's relative economic performance is much more complex than what previous studies contemplated. Such an approach has not been, to the best of our knowledge, applied by the existing real convergence literature.
The study is organized as follows. ‘Literature review’ section reviews the relevant literature, and the methodology and data are detailed in ‘Methodology and data’ section. ‘Empirical analysis’ section discusses the results. Finally, the conclusions in ‘Conclusion’ section put forward the study's main contributions, limitations, and policy implications.
Literature review
An overview of the empirical studies on real convergence analyses
In general, the empirical debate around the catching-up processes has focused on examining the real convergence hypotheses within a large sample of economies, employing the beta-regression analysis (e.g. Barro, Reference Barro1991; Mankiw et al., Reference Mankiw, Weil and Romer1992), unit root tests (e.g. Bernard and Durlauf, Reference Bernard and Durlauf1995; Greasley and Oxley, Reference Greasley and Oxley1998), or others (e.g. Cartone et al., Reference Cartone, Postiglione and Hewings2021). However, despite being high-quality studies, they have missed a great deal in capturing the essential determinants that caused or undermined the catching-up process of an individual economy.
The real convergence analysis of an isolated country is still limited to a few studies. The majority of them have addressed the investigation of specific determinants related to the catching-up (or falling behind) process, either using controlling variables in the regression analyses (e.g. Aguiar and Figueiredo, Reference Aguiar and Figueiredo1999; Barro, Reference Barro2016; Kokkinen et al., Reference Kokkinen, Jalava, Hjerppe and Hannikainen2007), through undertaking growth accounting exercises (e.g. Amaral, Reference Amaral1998; Micallef, Reference Micallef2020), or both (e.g. Lee, Reference Lee2016, Reference Lee2017).
The most common way observed to capture the real convergence effect was the beta-(absolute or conditional) analysis through the regression technique. According to the EEs examples, the regressions presented the Asian EEs as the clear evidence of real convergence towards the technology frontier, the USA. From South Korea's analysis between 1960 to 2010, it was concluded that the catch-up experience could be attributed to the country's high investment rate, substantial human capital, high trade openness, maintenance of good institutions, and low inflation (Lee, Reference Lee2016). Similarly, Barro (Reference Barro2016) and Lee (Reference Lee2017) concluded that the Chinese real convergence from 1960 to 2010 could be attributed to high investment rates, low fertility, improved life expectancy, and institutional quality.
The regression analysis regarding the European EEs showed the evidence for absolute convergence towards a group of other countries from the European Union (Matkowski et al., Reference Matkowski, Próchniak, Rapacki and Weresa2016; Tóth, Reference Tóth2019). Still, within the regressions framework, the developed countries have presented quite distinct results in what concerns the catching-up process among the most advanced countries in Europe. The Greek study (Papaconstantinou et al., Reference Papaconstantinou, Tsagkanos and Siriopoulos2013) has explicitly focused on the significant importance of diminishing the bureaucracy and corruption to prompt the growth of GDP per capita and real convergence with the EU15. The study focused on Malta has presented evidence of real convergence towards the EU28 and the New Member States, whereas convergence towards the EU15 was not verified.
Both Portugal (Aguiar and Figueiredo, Reference Aguiar and Figueiredo1999; Amaral, Reference Amaral1998) and Finland (Kokkinen et al., Reference Kokkinen, Jalava, Hjerppe and Hannikainen2007) were studied through a very long-time window, which according to Lains (Reference Lains2003) and Barro (Reference Barro2016) is the optimal time frame when analysing the real convergence process. Amaral (Reference Amaral1998) explored the Portuguese GDP per capita patterns compared to other 26 countries and found no evidence of absolute beta-convergence. Aguiar and Figueiredo (Reference Aguiar and Figueiredo1999) compared Portugal with only 7 developed countries resorting to distinct methodologies, the convergence rate estimation, graphical analysis, and time-series regression. Complementary to Amaral (Reference Amaral1998), who highlighted the importance of physical and human capital, Aguiar and Figueiredo (Reference Aguiar and Figueiredo1999) uncovered the high significance of trade openness to Portugal's real convergence process. Kokkinen et al. (Reference Kokkinen, Jalava, Hjerppe and Hannikainen2007), resorting to graphic analysis and time series regressions, assessed how the late Finnish industrialization led to the country's catching-up process in the 20th century vis-à-vis Sweden and the EU15.
Apart from studies that resort to regression analysis, Miron et al. (Reference Miron, Dima and Paun2009), Ozturk et al. (Reference Ozturk, Ay and Keser2013), and Sanz-Villarroya (Reference Sanz-Villarroya2005) embraced different methodological approaches to investigate the real convergence of some EEs. Sanz-Villarroya (Reference Sanz-Villarroya2005) provided an estimate of when Argentina started to diverge from Australia (1975–2000), Canada (1936–2000), and the OECD average (1913–2000) by applying unit root tests with structural breaks. Using the same technique, Ozturk et al. (Reference Ozturk, Ay and Keser2013) investigated Turkey's real convergence towards the EU13, and the unit root hypothesis failed to reject the non-stationarity for EU13 mean and the other nine countries. In an attempt to test Romania's real convergence towards other Eastern European countries and the EU16 mean, Miron et al. (Reference Miron, Dima and Paun2009) resorted to the distances and clusters methodology and found that Romania was closer to Baltic countries, distanced from other neighbouring countries, and even more distanced from the Euro Area.
In this overview of the empirical literature on real convergence of single countries, a set of aspects are worth to be highlighted: (1) most studies focus on beta convergence regressions in a cross-country panel dataset; (2) the LA EEs have been neglected in this literature; (3) although long time series is particularly useful for the estimation of convergence effects (Barro, Reference Barro2016), the studies focused mainly on relatively short periods.
The impact of human capital and institutional quality on real convergence: main hypotheses to be tested
Sustaining rapid and long periods of economic growth is a complicated process requiring various crucial inputs, such as infrastructure, human resources, economic stimulus, and strong institutions (Popov and Jomo, Reference Popov and Jomo2018). One of the major tasks of economists is to identify which of these factors are the engine or the brake of a country's growth and distinguish those associated with the real convergence processes (Li, Reference Li1997).
According to Abramovitz (Reference Abramovitz1986), a country's potential for rapid growth is strong when technologically backward but socially advanced. The author suggests that the catch-up process depends on a country's ‘social capability’ to absorb foreign technologies and adapt them to their needs. Indeed, one of the hypotheses predicted by the theoretical models on growth is that the catching-up process is driven by the potential of lagging countries to absorb ideas and knowledge from the technology frontier, thus attaining higher productivity growth rates (Rodrik, Reference Rodrik2011; Verspagen, Reference Verspagen1995). Although this may be true, the capacity to adapt these imported technologies and innovate is only possible through highly qualified human resources (Nelson and Phelps, Reference Nelson and Phelps1966) and adequate institutions (Manca, Reference Manca2010).
Many authors consider human capital accumulation the main driver of sustained growth (e.g. Barro, Reference Barro2001; Lucas, Reference Lucas1988; Mankiw et al., Reference Mankiw, Weil and Romer1992), as well as a critical factor in explaining the process of real convergence among different economies (Abramovitz, Reference Abramovitz1986; Nelson and Phelps, Reference Nelson and Phelps1966; Soukiazis and Cravo, Reference Soukiazis and Cravo2008). Zhang et al. (Reference Zhang, Li, Wang and Fleisher2019) have provided strong evidence on the substantial impact of human capital on growth and that real convergence is pronouncedly conditional on this latter variable.
As suggested by Nelson and Phelps (Reference Nelson and Phelps1966), human capital is not an ordinary input into the production process but a primary source of innovation and convergence, such that the level of education speeds technology diffusion and facilitates the catch-up in total factor productivity. According to their model, the advance in the productivity level depends upon the educational attainment and the gap between the theoretical level of technology (technology frontier) and the current level of productivity. As the model implies, the increased educational attainment fosters the path of technology diffusion in the long run.
Based on the above, we conjecture that:
H1: Human capital is likely to promote Brazil's real convergence through improvements in education.
Although human capital is necessary for sustained growth, due to the complementarity among the different growth determinants, no one single factor can be a sufficient condition for catching up (Li, Reference Li1997). Rodrik (Reference Rodrik and Rodrik2003) urges the search for more fundamental or ‘deep’ determinants of economic performance and convergence, such as institutions. Some of the empirical literature, namely Acemoglu et al. (Reference Acemoglu, Johnson and Robinson2001), Campos et al. (Reference Campos, Karanasos and Tan2020), and Nawaz and Khawaja (Reference Nawaz and Khawaja2019) have found a significant influence of institutional arrangements on shaping the sustained growth process.
North (Reference North1991) argues that depending on the quality of the institutions, a country can prosper and experience sustained economic growth. Although there is still an ongoing debate around the precise meaning of institution, the author defines it as constraints that structure political, economic, and social interaction, consisting of formal rules and informal constraints. Therefore, to gauge the institutional conditions in a country, researchers have been using these three types of institutions, namely: (i) political institutions, such as corruption (e.g. Iqbal and Daly, Reference Iqbal and Daly2014; Mauro, Reference Mauro1995), political instability (e.g. Campos et al., Reference Campos, Karanasos and Tan2012, Reference Campos, Karanasos and Tan2020), and democracy (e.g. Acemoglu et al., Reference Acemoglu, Johnson and Robinson2001; Mathonnat and Minea, Reference Mathonnat and Minea2019); (ii) economic institutions, such as property rights (e.g. Pereira and Luiz, Reference Pereira and Luiz2020), and contract-intensive money (e.g. Clague et al., Reference Clague, Keefer, Knack and Olson1999); and, (iii) social institutions, such as culture, customs, and religion (e.g. Bernardelli and Michellon, Reference Bernardelli and Michellon2018).
Political institutions affect voter behaviour and authority actions and influence economic choices, productions, and costs, shaping incentives for productive or unproductive actions (Spruk, Reference Spruk2016). For instance, democratic stability can have positive growth effects, constraining distorted public policies (Mathonnat and Minea, Reference Mathonnat and Minea2019). Clague et al. (Reference Clague, Keefer, Knack and Olson1999) argue that in societies with inferior economic institutions, there is less protection of property rights and enforcement of contracts, translating into fewer incentives to invest and adopt more efficient technologies. At last, social institutions tend to affect society through the power to mould individuals through communal aspects. All in all, institutions are a solid instrument for a country to create an adequate political, economic, and social environment to generate strong potential for the real convergence process. Thus, we conjecture that:
H2: Institutional quality associated with more democratic system is likely to promote Brazil's real convergence.
Methodology and data
Data sources and main variable proxies
This section presents the annual data series used in the study.Footnote 1 The time frame covered is from 1822 to 2019, resulting in some missing values, which were appropriately filled following the approach of Doré and Teixeira (Reference Doré and Teixeira2023). The description and respective source of time series data used in the present study and the correlation matrix can be found in the Online Appendix (Table B1 and B4).
For proxying real convergence, we resort to the ratio between Brazil's real GDP per capita and each block/country, at constant 2011 US$. The data was retrieved from the Maddison Project Database 2020 (Bolt and Luiten Van Zanden, Reference Bolt and Luiten Van Zanden2020), Maddison (Reference Maddison2003), and the Total Economy Database (TED).Footnote 2
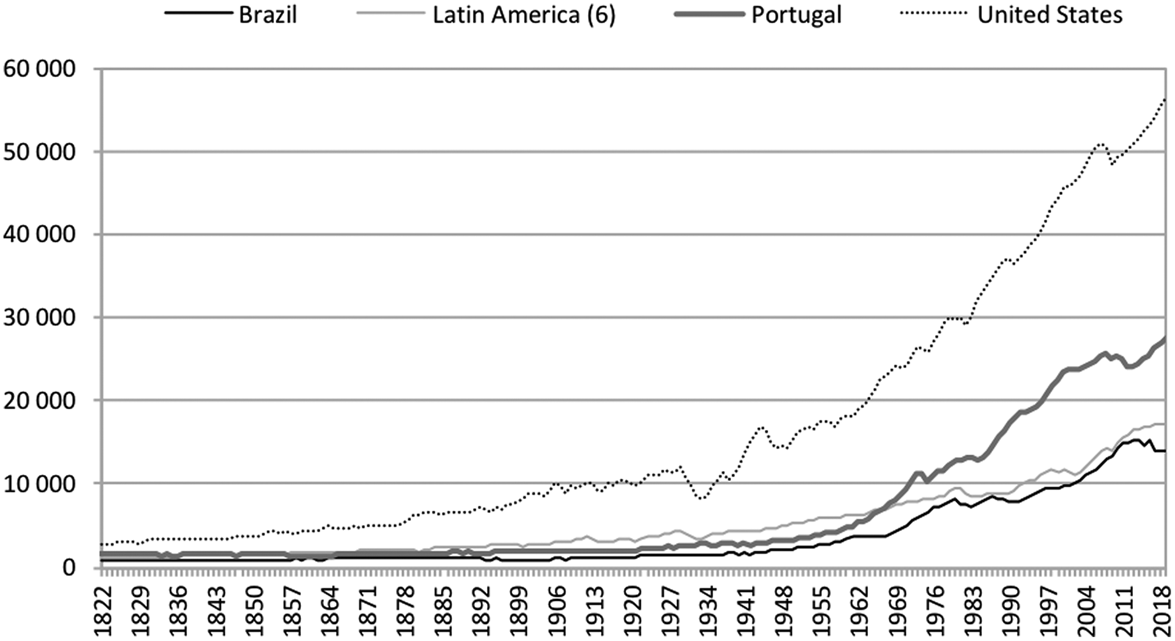
Figure 1 shows the levels of per capita GDP of all countries under study. We can notice that Brazil and the average of six LA countries have presented a similar path throughout the period, including meagre growth until the 1950s and a sharp upward trend afterward. Portugal and the US, the developed nations, have recorded a greater level of development than the EEs in the study, albeit the former only surpassed the LA countries after the 1970s.
Real GDP per capita, in constant 2011 US$, Brazil, LA6, Portugal, the US, 1822–2019.
Source: Authors' elaboration based on data from Maddison Project Database 2020 (Bolt and Luiten Van Zanden, Reference Bolt and Luiten Van Zanden2020), Maddison (Reference Maddison2003), and The Total Economy Database (TED).
The chosen metric for human capital, i.e. the ‘average years of schooling’ (population aged 15 to 64), is far from a perfect measure, mainly due to a lack of information about the quality of education (Teixeira and Queirós, Reference Teixeira and Queirós2016). However, the ‘adult literacy rates’ and ‘school enrollment ratios’ seem to have some deficiencies highlighted in theoretical models, putting the ‘average years of schooling’ as the most popular and most used specification of human capital (Wössmann, Reference Wössmann2003). The proxy used in the present study was gathered from Barro and Lee (Reference Barro and Lee2015) and Lee and Lee (Reference Lee and Lee2016).Footnote 3
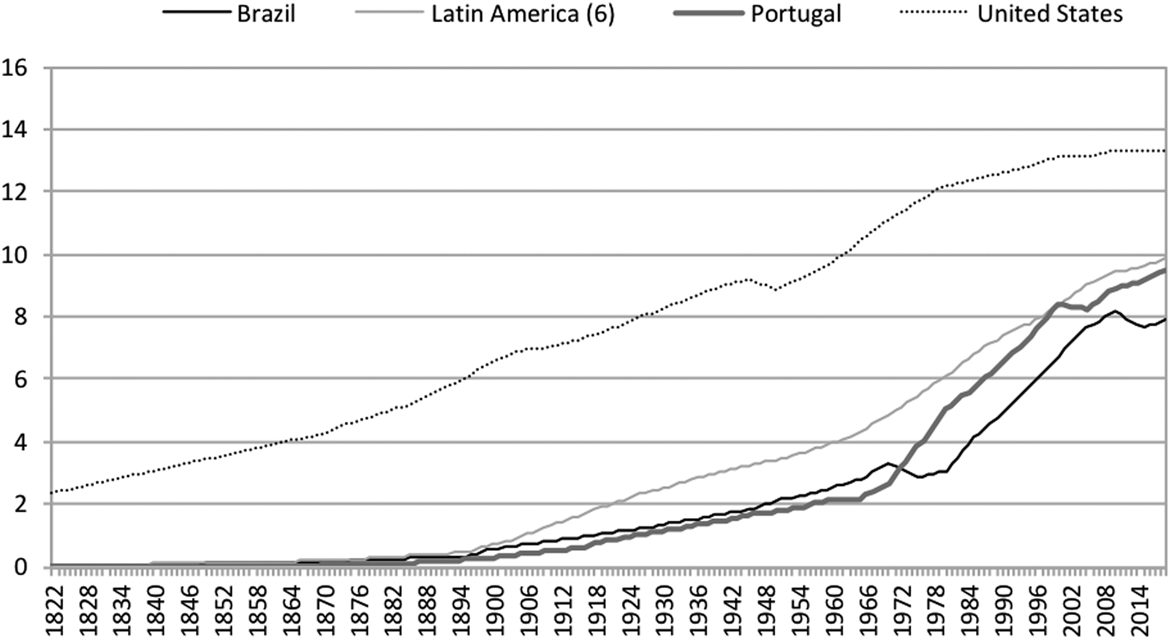
Unlike the US, which since the 19th century has recorded a superb evolution in terms of years of schooling of their citizens, Brazil, LA6, and Portugal have been struggling to achieve high levels of schooling, embarking on a significant upward trend only after the 1970s, 1910s, and 1960s, respectively (see Figure 2). Even so, during the whole period under analysis, the US citizens have the double years of schooling (population aged 15–64), on average, of all countries, at least until the end of the last century.
Average years of schooling, population aged 15–64, Brazil, LA6, Portugal, the US, 1822–2019.
Source: Authors' elaboration based on data from Barro and Lee (Reference Barro and Lee2015) and Lee and Lee (Reference Lee and Lee2016).
We opted to assess the impact of institutional quality on Brazil's real convergence by a political institution type, the electoral democracy index,Footnote 4 which measures to what extent the ideal of electoral democracy in its most total sense is achieved, ranged from low to high (0–1). It considers not only the presence of free and fair elections within countries but also evaluates the extent to which they have established robust institutional safeguards for democracy. These safeguards include the guarantee of freedom of association, the conduct of clean elections, the protection of freedom of expression, the presence of elected officials, and the assurance of suffrage.
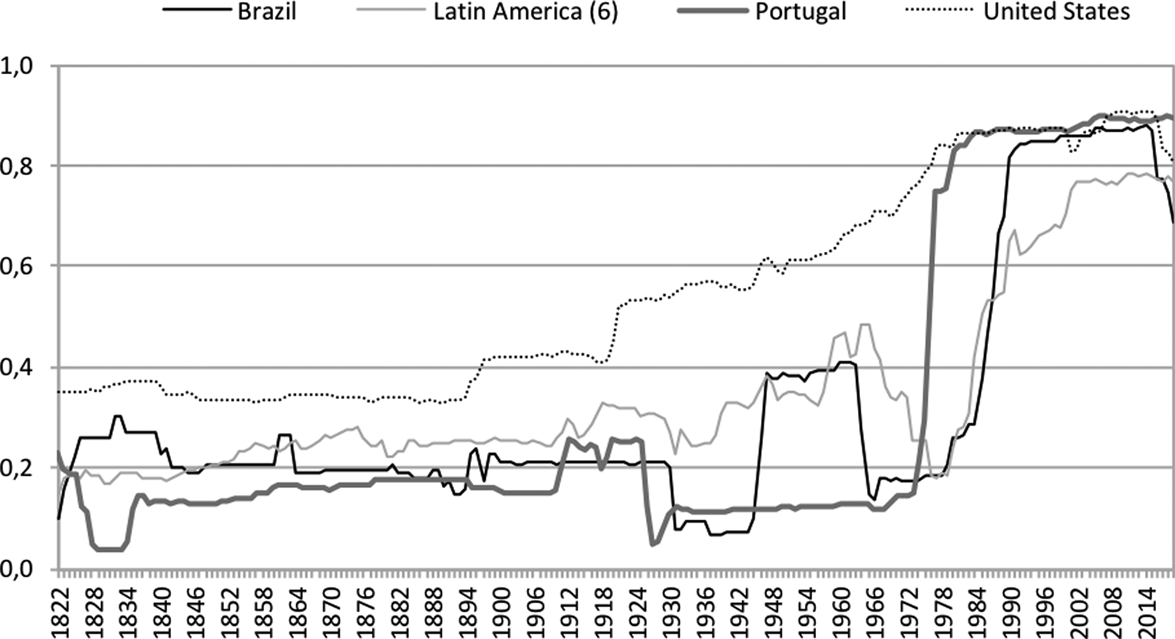
In the 19th century, a significant portion of countries experienced a prolonged period of limited democratic practices. However, the United States has since been actively promoting the establishment of stronger institutional democracy. In contrast, other countries have witnessed fluctuations in their democratic levels until the 1970s (Figure 3). Brazil, for example, began its journey towards a more democratic system after 1945 but faced an interruption between 1964 and 1985 when a dictatorship regime took hold. Similarly, several Latin American countries faced military coups during comparable periods, eventually transitioning back into democratic states. Up until the revolution of 1974, Portugal had the lowest average electoral democracy index among the countries analysed in this study. Subsequently, Portugal made remarkable progress in its democratic recovery, ultimately attaining the highest position in recent years.
Electoral democracy index, Brazil, LA (6), Portugal, the US, 1822–2019.
Source: Authors' elaboration based on data from V-DEM Project Database.
Other variables, namely life expectancy, urbanization rate, inflation, and extreme poverty rate, were also employed in the analysis to control for omitted variable bias. Our first control variable is life expectancy, a typical quantitative measure of health, which is an important factor to consider in growth models (Barro and Sala-i-Martin, Reference Barro and Sala-i-Martin1997), especially for an EE like Brazil. Doré and Teixeira (Reference Doré and Teixeira2023) found that structural change favouring industry tends to boost Brazil's economic growth. Therefore, due to data availability, our second control variable intends to capture this impact through urbanization, since it acts as a pivotal factor fuelling industrialization and growth (Zheng and Walsh, Reference Zheng and Walsh2019). Finally, two features that most define Brazil and other EEs, i.e. macroeconomic instability and high levels of poverty (Doré and Teixeira, Reference Doré and Teixeira2022; Sotomayor, Reference Sotomayor2019), are accounted for by the control variables inflation rate and extreme poverty rate, respectively. It is expected a negative effect of these latter factors on Brazil's real convergence.
Selected methodological procedure and technique
Detecting whether a lower-income economy's GDP per capita levels converge towards a higher-income country is relevant, especially for development economists. However, once economic (div)convergence is detected, the real reasons and mechanisms by which the catching up (or falling behind) process is on track can be diverse and should be scrutinized. Thus, the present study proposes investigating how human capital and institutional quality have contributed to the Brazilian real convergence path towards six EEs LA countries,Footnote 5 Portugal, and the US, over the very long-run, from 1822 to 2019.
Various methods in the literature study real convergence and the most common is to regress the average growth rate on the initial level of real per capita output using cross-section data among a group of countries (Tochkov, Reference Tochkov2021). After identifying some weaknesses of cross-section tests, Bernard and Durlauf (Reference Bernard and Durlauf1995, Reference Bernard and Durlauf1996) proposed an alternative unit root and cointegration framework to test for real convergence and catching up using long time-series data. The authors extended the use of unit root tests of single series to comparative series as well as they offered a formal definition of real convergence as a catching-up process, where It denotes the information set available at period t:Definition: Countries i and j converge between dates t and t + T if the (log) per capita output, y, deviation is expected to decrease. If y i,t > y j,t,

According to Bernard and Durlauf (Reference Bernard and Durlauf1995), one can assess the stationarity of comparative series using unit root tests by adopting the non-convergence as the null hypothesis. This definition is violated if the level of the comparative series is non-stationary, which consequently excludes the expectation for income gaps to narrow. If the unit root tests fail to reject non-stationarity, thus non-convergence cannot be rejected. On the other hand, if the tests reject non-stationarity, there is a tendency for the GDP per capita comparative series to narrow their gaps in the long-run (tendency towards catching up). In like manner, our initial step involves performing the Augmented Dickey-Fuller (ADF) and Phillips-Perron (PP) tests for a unit root, and the Kwiatkowski-Phillips-Schmidt-Shin’ (KPSS) stationary test in the comparative real GDP per capita series for each pair of countries, i.e. Brazil/LA6 countries, Brazil/Portugal, and Brazil/the US. We allow for possible structural breaks in the series for more robust test results, as proposed by Greasley and Oxley (Reference Greasley and Oxley1998).
Apart from finding evidence of real convergence, our study's novelty is to estimate the extent to which human capital and institutional quality influence the Brazilian catching up (or falling behind) process towards LA6, Portugal, and the US. This second step consists of performing a MS-AR model from Hamilton (Reference Hamilton1989), one of the literature's most popular nonlinear time-series models (Clements and Krolzig, Reference Clements and Krolzig2003; Doǧan and Bilgili, Reference Doǧan and Bilgili2014).Footnote 6 The key feature of this regime-switching class of model is that the parameters can change over time according to an underlying state process which could be a finite-state hidden Markov chain. Moreover, it allows the incorporation of nonlinear variables and is best suited to capture the effect of potential structural breaks (Rahman et al., Reference Rahman, Khan and Charfeddine2020).
The MS model is particularly appropriate for examining the (relative) economic growth in different regimes (Menla Ali and Dimitraki, Reference Menla Ali and Dimitraki2014). Generally, the model is applied to differentiate the economic performance for periods of expansion and contraction. By adapting the concept to our case, we allow the model to take into account two different regimes (s t ∈ {1, 2}: real convergence (catching up) and real divergence (falling behind).
Clements and Krolzig (Reference Clements and Krolzig2003) have outlined three extensions to the basic framework for testing the asymmetries in MS(m)-AR(p) models, where m stands for the number of regimes/states, and p is the lag length. The first extension, the MSI(m)-AR(p), is characterized by switching in the intercept rather than the mean as in the original model. In contrast with the latter, in which a shift in regime causes a once-and-for-all jump in the level of the observed time-series, the former implies a smooth transition in the process level after a regime shift. Differently from the original Hamilton model, the second extension proposes that the variance of the disturbance term depends on the regime, that is, the model MSIH(m)-AR(p) allows for heteroskedasticity. At last, the MSIA(m)-AR(p) model allows for the autoregressive parameters to be state-dependent. That said, the appropriate model to be applied to our case is the MSIA(m)-AR(p),Footnote 7 which is specified as follows:
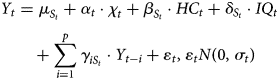
where t represents time; μ is the state-dependent intercept term; p represents the number of lags in the autoregressive term; $\varepsilon$ is the white noise with mean zero and variance σ t; and coefficients are shown through α, β, δ, and γ. χ t denotes the matrix of state-invariant control variables, and HC t and IQ t stand, respectively, for the proxy for Brazil's human capital and the proxy for Brazil's institutional quality, which are state-dependent. The Y t represents the relative GDP per capita of the three pairs of countries (Brazil/LA, Brazil/Portugal, Brazil/the US), all in logarithms.Footnote 8 The estimation is conducted by maximum likelihood using the expectation-maximization algorithm described by Hamilton (Reference Hamilton1989).
In the MS models, it is assumed that the nonobservable state variable s t is generated by the first order of the Markov chain, which is specified by the transition probabilities:

Accordingly, as our case encompasses a two-regime model, there are two transition probabilities: p 12 = Pr (convergence in t | divergence in t − 1) and p 21 = Pr (divergence in t | convergence in t − 1). Thus, the current regime relies on the regime one period ago, and p ij shows the probability of being in regime j following regime i.
Empirical analysis
Real convergence or real divergence: evidence based on unit root tests with structural breaks
The ADF and PP tests are the standard approaches to examining the time series properties, which can place the convergence hypothesis in an explicitly unit root framework (Bernard and Durlauf, Reference Bernard and Durlauf1995; Greasley and Oxley, Reference Greasley and Oxley1998). Apart from the standard tests, we carried out the Kwiatkowski-Phillips-Schmidt-Shin’ (KPSS) test, which is a test of the null hypothesis of stationarity against the alternative of a unit root that has been attractive as a useful counterpoint to the ADF test (Hansen, Reference Hansen2020). In addition, we perform the Zivot and Andrews (ZA)' (Reference Zivot and Andrews1992) and Lee and Strazicich (LS)'s (Reference Lee and Strazicich2003) test, which ensure more reliable and accurate results by providing a unit root test in the presence of structural break.
As can be seen in Table 1, according to the ADF, PP, and KPSS tests, there is no tendency for Brazilian income gaps towards LA, Portugal, and the US to narrow over time, given that the tests do not reject the null-hypothesis. The results also reveal that the relative series remained non-stationary even after accommodating up to two structural breaks (ZA and LS tests).
Non-stationary and unit root tests of the relative GDP per capita series

Note: All variables are in logarithm; p-value in brackets ( ); break dates in square brackets [ ]; *** statistically significant at 1%; the lag-length selection was based on the information criteria provided in varsoc command (STATA 17.1©).
According to Inwood and Stengos (Reference Inwood and Stengos1991), correctly identifying the structural breaks excludes the basis of non-stationarity and its effect on the data. Although the ZA and LS tests are considered robust, they accommodate only a limited number of breaks, which in the case of a very long data span, may configure a potential problem. To check the existence of more than two breaks in the relative series, we opt to use the methodology proposed by Bai and Perron (Reference Bai and Perron1998), which endogenously determines the number and timing of multiple structural changes. Firstly, we test the null hypothesis for the existence of more than two breaks (against the existence of three breaks). As the null was rejected, at 1% significance, we then estimated the break dates, and the results are reported in Table B2 in the Online Appendix.
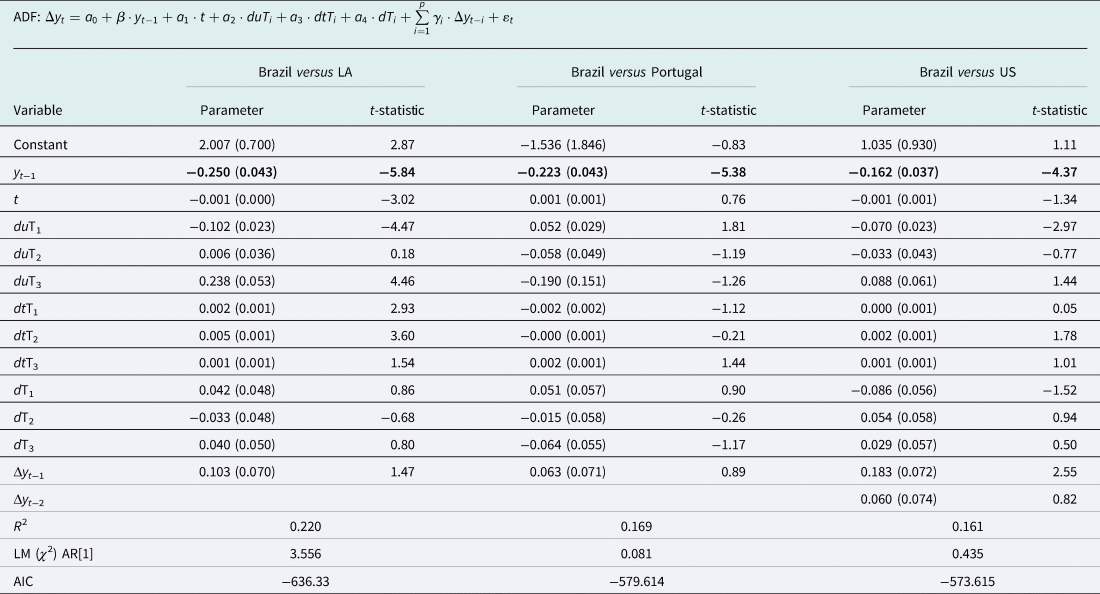
The results from the extended ADF tests (Table 2) indicate that Brazil and LA's relative GDP per capita series has become stationary after assuming three structural breaks, namely in 1884, 1942, and 1971. Although the critical values are not tabulated for this model, Inwood and Stengos (Reference Inwood and Stengos1991) have provided a 5% critical value of −5.1316 for a three-break model. Therefore, as our lagged variable (y t−1) yields a test statistic of −5.86, we can reject the hypothesis of non-stationarity, favouring the catching-up process in the very long-run.
ADF test with structural breaks
Relative GDP per capita series.
Note: The number below the coefficient estimates are standard errors. LM (χ 2) is a Lagrange Multiplier type test of serial correlation up to order 1. Dummies values for breaks defined as in Inwood and Stengos (Reference Inwood and Stengos1991), where Ti (BR versus LA) = 1,884, 1,942, and 1,971; Ti (BR versus PT) = 1,856, 1,885, and 1,987; and Ti (BR versus US) = 1,879, 1,931, and 1,969.
The effect of introducing each breakpoint can be separately analysed and historically supported. Since 1822, Brazil has diverged from LA at an annual average speed of 0.47%. The break point of 1884 (five years before Brazil implemented the Republic) indicates the beginning of a flat pattern that persisted until 1942 when the country embarked on the developmentalist era and started a process of catching up to other LA countries (at an annual average speed of 1.89%). The accelerating process of diminishing the GDP per capita gap was sustained up to 1971 when, probably due to some external (e.g. oil shock) and internal (e.g. external debt, hyperinflation) crises, Brazil started losing steam with pronounced macroeconomic instability, notable until recent times.
Regarding the extended ADF results for Brazil–Portugal, we can observe that the structural break dates proposed by Bai and Perron's (Reference Bai and Perron1998) test, namely 1857, 1886, and 1987, were sufficient to convert the relative GDP per capita series into a stationary series (i.e. for a test statistic of −5.38, we can reject the hypothesis of non-stationarity at 5% significance). Although the exact break dates are not historically supported, one may speculate their significance on the Brazilian real convergence towards Portugal. Until the proclamation of the Republic (three years after the second break point), Brazil presented low levels of growth and a clear path of divergence towards other economies under study. What differentiates the Brazil–Portugal pattern, at least from 1822 to 1856, is probably Portugal's sudden deprivation of a centuries-old empire and the loss of a substantial part of its revenues, reflected in the Brazilian catching up. The last break data, 1987, may also indicate some Portuguese economic achievement rather than Brazilian since, in 1986, the former country joined the European Union.
Unlike the results for Brazil/LA and Brazil/Portugal, the introduction of structural breaks has not been able to eliminate the discontinuities in the relative GDP per capita series of Brazil/US. It is to say that, even considering some break points, Brazil has not been able to achieve a sustainable convergence path towards the US, at least considering the period under analysis (1822–2019). Furthermore, one can conclude that neither of the two great depressions of the 1870s and 1930s in North America nor the oil shock in the 1970s (which coincides with Bai-Perron's endogenous breaks – 1879, 1931, and 1969, respectively) can be viewed as responsible for a catching up of Brazilian citizens' relative standard of living compared to the US citizens, almost stagnated since 1822.
Explaining the sources of real convergence/divergence of Brazil vis-à-vis LA, Portugal, and the US: a Markov regime-switching autoregressive (MS-AR) approach
Preliminary investigation
The number of lags (p = 1,1,2) was selected based on the Akaike information criterion (AIC) and the Schwarz information criterion (SBIC), applied to the three models, respectively (Model I: Brazil/LA, Model II: Brazil/Portugal; Model III: Brazil/US). Second, to check for nonlinear time series dependencies, we performed the BDS test (Brock et al., Reference Brock, Dechert, Scheinkman and LeBaron1996),Footnote 9 which has been found to have power against a wide range of nonlinear alternatives (Chen et al., Reference Chen, Zhu and Zhong2019). The null hypothesis of linearity is rejected in all models at the 1% significance level (Table 3), thus entail the application of a nonlinear model.
Nonlinearity BDS test from Brock et al. (Reference Brock, Dechert, Scheinkman and LeBaron1996)

Note: *** (**)[*] statistically significant at 1% (5%) [10%]; m indicates the maximum embedding dimension.
Source: Authors' computation using STATA 17.1®.
Regime switching model
Based on the previous diagnostics, the proposed regime-switching model is the Markov-Switching Intercept Autoregressive (MSIA) with 2 Regimes (‘Real convergence’, Regime 1, and ‘Real divergence’, Regime 2). Table 4 shows the results obtained from the MSIA(m)-AR(p) models.Footnote 10
Estimated MSI-AR models
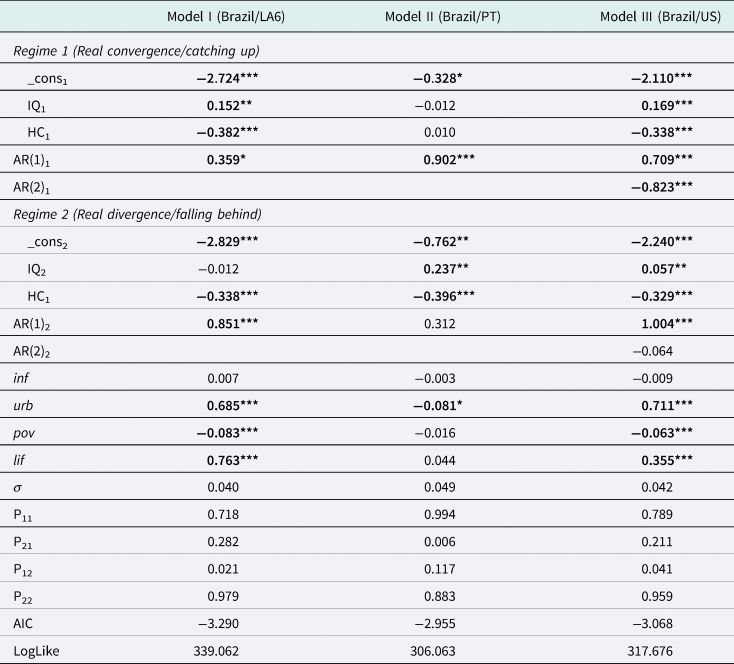
Note: *** (**)[*] statistically significant at 1% (5%) [10%]; the number below the coefficient estimates are standard errors; 1 and 2 in subscripts indicate the Regimes of convergence and divergence, respectively; IQ: Electoral democracy index; HC: Average years of schooling; inf: Inflation rate; urb: Urbnazination; pov: Extreme poverty rate; and lif: Life expectancy.
In all the models, the transition probabilities indicate that either the process of catching up (Regime 1) or falling behind (Regime 2) have strong stability since p 11 and p 22 are both close to one. In Model I and Model III, the divergence process is more persistent than the convergence one, p 11 < p 22, contrary to Model II where p 11 > p 22. For instance, given that the country is in Regime 1 (catching up), $p_{11}^I = 0.718, \;\;p_{11}^{II} = 0.994$ , and $p_{11}^{III} = 0.789$
 represents the probability of 71.8%, 99.4%, and 78.9% chance (respectively) of remaining in Regime 1. Analogously, $p_{22}^I = 0.979, \;\;p_{22}^{II} = 0.883$
 , and $p_{22}^{III} = 0.959$
 represents the probability of 97.9%, 88.3%, and 95.9% chance (respectively) of remaining in Regime 2 (falling behind).
Considering the regression parameters, the results are different according to the pair of countries in question, with more similarities when comparing the American countries against the European one. In Model I and III, a negative effect of human capital is observed regardless Brazil is on the path of convergence or divergence towards the LA6 countries and US, respectively. The impact of institutional quality is always positive regardless of the regime for the pair Brazil/US. In contrast, for the pair Brazil/LA6, it is positive in Regime 1 (catching up) and negative (albeit not significative) in Regime 2 (falling behind). Under the framework of Model II (Brazil/Portugal), there is no evidence of a causal relationship between human capital and institutional quality with the real convergence process (Regime 1). On the other hand, when Brazil is on a path of real divergence towards Portugal, an increase in the level of electoral democracy could enhance the Brazilian catching up in the very long run.
With the various aspects of our empirical investigation considered, some features emerge and are worth highlighting. The two independent state-variant variables, human capital (proxy by the ‘average years of schooling’) and institutional quality (proxy by the ‘electoral democracy index’), differently impact the catching up (or falling behind) process depending on which (block of) country(ies) Brazil is compared with. Despite the expectation that human capital would contribute to Brazil's economic growth, as evidenced by Doré and Teixeira (Reference Doré and Teixeira2023), it does not hold for the country's real convergence process. Thus, the effects of human capital on convergence seem to be more complex than initially recognized (Zhang et al., Reference Zhang, Li, Wang and Fleisher2019).
The negative impact of human capital on the comparative growth performance of Brazil towards other LA countries, Portugal, and US can be associated with at least two features underlying the former country: (i) the late education takeoff and type of educational investments, and; (ii) the high levels of poverty and inequality. The spending on education in Brazil has been directed to increase the number of schools and schools' infrastructures rather than the quality of the education system, which can partially explain the inefficiency of increasing levels of human capital in promoting the catching-up process. Indeed, if the quality of teaching does not proportionally follow the construction of more schools, the students languish in poor schools and do not acquire skills that benefit the economy (Rocha et al., Reference Rocha, Ferraz and Soares2017; Sandoval, Reference Sandoval2012).
Second, some critical factors defining most EEs like Brazil, namely high levels of poverty and inequality, may generate adverse effects of human capital on real convergence. At the same time that human capital improvements are expected to contribute to alleviating poverty and lowering inequality (Ferreira et al., Reference Ferreira, Leite and Ravallion2010; Litschig and Morrison, Reference Litschig and Morrison2013; Sotomayor, Reference Sotomayor2019), the latter are, in turn, correlate with highly uneven access to education. This vicious cycle, where poverty leads to a flawed educational system, amplifies wage differentials by skills and accelerating inequality, thereby preventing the country from converging in real GDP per capita to more developed ones. That said, we fail to validate the hypothesis H1 (Human capital is likely to promote Brazil's real convergence through improvements in education).
As the bulk of the growth-related literature suggests and our results confirm, institutional quality has a positive effect on Brazil's real convergence vis-à-vis other economies. Therefore, we can conclude that hypothesis H2 (Institutional quality associated with more democratic system is likely to promote Brazil's real convergence) is validated. Notwithstanding, the coefficient is not significant in the catching-up phase for Brazil/Portugal, and the falling behind phase for Brazil/LA6. One plausible reason for the neutral effect of institutional quality on convergence in one out of two regimes is the heterogeneity of societies in developing and EEs. Bresser-Pereira (Reference Bresser-Pereira, Bresser-Pereira, Maravall and Przeworski1993) argues that only some sort of cooperation among social classes and sectors of society would assure the regime's necessary governability. Therefore, in countries with high levels of poverty and inequality, such as Brazil, even after establishing more democratic regimes, the constitution, stability, and appropriate reforms proposed by it to enhance economic development and convergence may be more challenging to negotiate and achieve (Lisboa and Latif, Reference Lisboa and Latif2013).
For robustness purpose (see the Online Appendix), we advance the analysis through three different approaches where we found that: (i) depending on the proxy used to represent the core variable, especially on the case of institutional quality, it may lead to different results, thus the significance of properly define and expose clearly the measure that are being used; (ii) our results were reinforced when we re-estimate the models employing the relative series of the explanatory variables, and; (iii) the chosen mechanisms, i.e. corruption, rule of law, and property rights, were not sufficient to explain the impact of electoral democracy on the real convergence path of Brazil.
Conclusion
Based on an extended unit root approach, the present study tests for Brazilian real convergence vis-à-vis six LA EEs, Portugal, and the US over a very long period 1822–2019. Such an approach leads us to conclude that Brazil has narrowed the gap towards other LA countries and Portugal after considering structural breaks on the relative time series. In contrast, the same phenomenon is not observed towards the US. From 1822 until 2019, Brazil diverged on real per capita terms from the technological frontier country.
Furthermore, to shed some light on the potential determinants explaining Brazil's catching up and falling behind, a Markov Regime-Switching (MS) model was estimated. The impact of human capital (proxied by the ‘average years of schooling’) and institutional quality (proxied by the electoral democracy index) on Brazil's real convergence was scrutinized. Overall, the comparative growth performance of Brazil concerning other LA EEs, Portugal, and the US is, on the one hand, influenced negatively by human capital, which can be attributed to two main factors: the delayed education progress and prioritization of quantity over quality in the country's educational system; and, the high levels of poverty and inequality, which hampers growth and is primarily exacerbated by the unequal education access in Brazil. We found that such impact has important but distinct results, depending on the regime (real convergence/divergence) and towards which economies Brazil is compared.
On the other hand, institutional quality, particularly within more democratic regimes, positively impacts Brazil's convergence. However, this effect may vary due to the complexity of societies in developing economies. In high-poverty and inequality contexts like Brazil, establishing democratic regimes does not necessarily guarantee seamless governance, stability, and reforms for economic development and convergence (Bértola and Williamson, Reference Bértola and Williamson2017; Bourguignon and Verdier, Reference Bourguignon and Verdier2000; Bresser-Pereira, Reference Bresser-Pereira, Bresser-Pereira, Maravall and Przeworski1993).
By developing this study, we contribute to the literature at three levels: theoretical, methodological, and empirical.
At the theoretical level, this study adds to the real convergence literature the analysis of one sole country, Brazil, in three different scenarios: (i) towards other LA EEs; (ii) towards a developed country, its alma matter, Portugal; and (iii) towards the commonly regarded technological frontier country, the US. Even though Brazilian convergence/divergence processes have been already analysed by a few studies, these latter have focused on groups of countries, namely the LA (King and Ramlogan, Reference King and Ramlogan2008), the BRICS (Das and Nayak, Reference Das and Nayak2023) or ‘clubs’ within a larger sample of countries (Skare et al., Reference Skare, Porada-Rochon and Stjepanovic2021), rather than on Brazil individually considered. After accounting for structural breaks in the time series, we find, similarly to previous studies, that Brazil (King and Ramlogan, Reference King and Ramlogan2008; Lara and Prado, Reference Lara and Prado2023) or the ‘club’ where Brazil is included (Skare et al., Reference Skare, Porada-Rochon and Stjepanovic2021) failed to converge towards the most technological advanced economy, the US, but complementarily to those studies, we found that Brazil managed to narrow the income gap vis-à-vis other LA countries and Portugal.
At the methodological level, to the best of our knowledge, this is the first study to employ and adapt the MS model to capture the dynamic relationship between human capital and institutional quality to the relative real GDP per capita, accounting for different explanatory variables behaviour according to the regime (convergence/divergence). Besides finding evidence of real (div)convergence, our study goes beyond previous contributions in the area (e.g. Das and Nayak, Reference Das and Nayak2023; King and Ramlogan, Reference King and Ramlogan2008; Lara and Prado, Reference Lara and Prado2023; Skare et al., Reference Skare, Porada-Rochon and Stjepanovic2021) by econometrically assessing the extent to which human capital and institutional quality influence the Brazilian catching up (or falling behind) process towards LA6, Portugal, and the US. In line with the studies that analysed Brazil's economic growth (e.g. Campos et al., Reference Campos, Karanasos and Tan2020, Reference Campos, Glebkina, Karanasos and Koutroumpis2023), we found that institutional quality is likely to promote Brazil's real convergence; however, the Markov Regime-Switching Autoregressive approach used permitted to uncover important non-linearities overlooked by previous studies: non-significant impacts of institutional quality on Brazil's real convergence were founded in the catching-up phase for Brazil/Portugal and in the falling behind phase for Brazil/LA6. Such an evidence suggests it is critical to independently scrutinize real convergence and economic growth processes (Bernardelli et al., Reference Bernardelli, Próchniak and Witkowski2021), and to recognize that in countries paved with high levels of poverty and inequality even after establishing more democratic regimes, the constitution, stability, and appropriate reforms proposed by it to enhance convergence may be more challenging to negotiate and achieve.
At the empirical level, this study offers new and challenging evidence of the nonlinear impact of human capital and institutional quality on the real convergence process of Brazil vis-à-vis other LA6 EEs, Portugal, and the US. In contrast to some recent studies that analyse Brazilian economic growth process (e.g. Doré and Teixeira, Reference Doré and Teixeira2023), we found that human capital a statistically significant, long-lasting, negative impact on Brazil's relative economic performance. This emphasizes that the effects of human capital on convergence seem to be more complex than initially recognized (Castelló-Climenta and Doménech, Reference Castelló-Climenta and Doménech2022). Indeed, the structural features of the Brazilian economy characterized by educational investments targeting schools' infrastructures rather than the quality of the education system, and the high levels of poverty that potentiates a malfunctioning educational system, amplifies wage differentials by skills, and accelerates inequality, have prevented the country from catching up.
Even though the present study conveys some novel contributions, it nevertheless entails some limitations and outlines some avenues for future research. First, the metric of human capital used – average years of schooling – does not consider the educational quality. Therefore, adjusting the human capital proxy is likely to increase the power of the variable in explaining the relative economic growth (Teixeira and Queirós, Reference Teixeira and Queirós2016), even in different contexts. Second, EEs from other continents should be put in perspective, and the results should be compared to those related to LA EEs to corroborate our findings. Finally, there is a set of other methodologies that will be devoted in future research to avoid making the present study overly lengthy. For instance, to test for convergence within the EEs context, we intend to employ the methodologies proposed by Hobijn and Frances (Reference Hobijn and Franses2000), which is based on pairwise selection to define convergence clubs. At last, there is a sophisticated and powerful modelling approach by Pouzo et al. (Reference Pouzo, Psaradakis and Sola2022) that we found pertinent to carefully explore in a future research.
Supplementary material
The supplementary material for this article can be found at https://doi.org/10.1017/S1744137423000358.



