Implications
Subacute rumen acidosis (SARA) is known to elicit local and systemic immune responses in cows, which might impair their plasma metabolome and affect their acute phase response to external immunogenic compounds such as lipopolysaccharide (LPS). The present study showed that an intramammary LPS challenge caused a higher concentration of an acute phase protein at the level of the mammary gland in SARA cows compared with healthy cows, whereas no systemic differences were noticed. This implies that cows suffering from SARA might undergo a stronger disturbance of udder health when experiencing an acute gram-negative mastitis compared with control cows.
Introduction
Current feeding practices for high-producing dairy cattle often lead to SARA. This metabolic disorder has advanced to be one of the most frequent health disorders in high-producing dairy herds, impairing systemic health and welfare of animals (Plaizier et al., Reference Plaizier, Khafipour, Li, Gozho and Krause2012). It is generally accepted that SARA increases the risk of various systemic metabolic disorders in cows (Plaizier et al., Reference Plaizier, Khafipour, Li, Gozho and Krause2012; Zebeli and Metzler-Zebeli, Reference Zebeli and Metzler-Zebeli2012) although a direct association between SARA and these disorders has not yet been established. A frequent finding in cows experiencing SARA is an activated systemic innate immune response often characterized by an increase of several acute phase proteins (APP) such as serum amyloid A (SAA), LPS-binding protein (LBP) and haptoglobin (Hp) in the blood of cows experiencing SARA (Khafipour et al., Reference Khafipour, Krause and Plaizier2009; Jia et al., Reference Jia, Wang, Ni, Zhang, Zhuang and Shen2014). Research of the last years has suggested that activation of this systemic immune response can be used as a diagnostic tool of SARA (Plaizier et al., Reference Plaizier, Khafipour, Li, Gozho and Krause2012), and also might partly explain the association between SARA and systemic health disorders (Zebeli and Metzler-Zebeli, Reference Zebeli and Metzler-Zebeli2012; Eckel and Ametaj, Reference Eckel and Ametaj2016).
In a recent study, we observed that cows experiencing SARA were more susceptible to several health disorders after an intramammary challenge with LPS used to induce acute mastitis (Aditya et al., Reference Aditya, Humer, Pourazad, Khiaosa-ard, Huber and Zebeli2017). More specifically, these cows had a more pronounced decline in dry matter intake, chewing activity, and milk yield, as well as a faster increase in reticuloruminal temperature and a stronger perturbation of milk constituents. In addition, all these responses were associated with metabolic disturbances such as hypoketonemia and hyperlactatemia (Aditya et al., Reference Aditya, Humer, Pourazad, Khiaosa-ard and Zebeli2018). These findings suggest that SARA induces perturbations in systemic metabolism which are amplified by a mastitis challenge, which might explain why SARA cows generally are more susceptible to other diseases and their recovery normally takes longer than cows not experiencing SARA (Aditya et al., Reference Aditya, Humer, Pourazad, Khiaosa-ard and Zebeli2018). Our hypothesis in this study was that cows experiencing SARA have a modulated innate immune response and impaired plasma metabolome compared with healthy cows when experiencing an acute mastitis challenge. Compared with single metabolite techniques, metabolomic technologies enable the detection of multiple classes of metabolites that reflect changes of key metabolic and immune pathways, advancing our understanding of the mechanisms behind disorders, such as SARA and mastitis.
Therefore, the aim of this study was to use a targeted ESI-LC-MS/MS-based metabolomics approach to advance the understanding of the metabolites that change in cows experiencing an intramammary LPS challenge, whereby a special focus was put on possible differences between cows experiencing SARA or not. In addition, several APP in the same blood samples and milk amyloid A (MAA) were measured to relate the metabolomic data with innate immune responses and also to characterize the local inflammation in the mammary gland, respectively.
Material and methods
Animals, experimental design, feeding
The trial was part of a larger study reported elsewhere (Aditya et al., Reference Aditya, Humer, Pourazad, Khiaosa-ard, Huber and Zebeli2017 and Reference Aditya, Humer, Pourazad, Khiaosa-ard and Zebeli2018). The experimental setup is explained in details in those papers. In brief, the experiment used a total of 18 (10 multiparous and eight primiparous) early lactating Simmental cows with 66.6±20.5 days in lactation and 712±101.3 kg BW. These cows were selected according to appropriate udder health with milk somatic cell count <200 000 cells/ml and no history of mastitis. The cows were blocked based on lactation number and days in lactation into two feeding groups, control (n=6) and SARA (n=12). The CON cows obtained a diet consisting of 27% concentrates in the total mixed ration and up to 4 kg of concentrate mixture per day to reach a level of 40% concentrates of the total dry matter intake (Supplementary Material Table S1). On the other hand, the SARA cows received a transient SARA feeding regimen consisting of 40% concentrates for 6 days, which was similar to the CON diet (Baseline), then switched to a diet containing 60% concentrates for 8 days (SARA 1), stepped down to the 40% concentrate level for 7 days (SARA Break), and switched again to the 60% concentrate level for other 17 days (SARA 2). To characterize the SARA episodes, wireless bolus sensors (Smaxtec Animal Care Sales GmbH, Graz, Austria) were subjected to the reticulorumen via the esophagus, as described in Adytia et al. (Reference Aditya, Humer, Pourazad, Khiaosa-ard, Huber and Zebeli2017a).
The diets were formulated following the GfE handbook (2001) to fulfill the requirements of nutrient and energy for dairy cows weighing 700 kg and yielding 35 kg milk/day with 4.0% fat and 3.4% protein. Fresh diets were prepared daily using an automatic feeding robot (Triomatic T15; Trioliet Feeding Technology, Oldenzaal, the Netherlands) and offered to the cows via an electronic feeding system (Insentec B.V., Marknesse, the Netherlands), whereby fresh feeds were offered twice a day (0800 and 1600 h). The diets were provided ad libitum and allowed for ~5% to 10% refusals. All the cows had free access to water throughout the trial.
Intramammary lipopolysaccharide infusion
The details of intramammary LPS challenge are described in our previous report (Aditya et al., Reference Aditya, Humer, Pourazad, Khiaosa-ard, Huber and Zebeli2017). In brief, the intramammary LPS infusion was conducted on day 30 (SARA 2) of the experiment, precisely 3 h after the morning milking. A single dosage of 50 µg LPS from E. coli (O26 : B6; Sigma-Aldrich Inc., MI, USA) dissolved in 10 ml of 0.9% saline solution (B. Braun, Melsungen, Germany) was administrated via the left front quarter to half of the SARA group (SARA-LPS) and all CON cows (CON-LPS). Meanwhile, the other half of SARA group (SARA-PLA) received only 10 ml of 0.9% saline solution as a placebo (PLA).
Blood sampling and analyses
Blood samples were collected from the jugular vein briefly before the morning feeding, precisely on day −2 (Baseline), day 8 (SARA 1), day 15 (SARA Break), day 30 (SARA 2; 4 h before LPS infusion) as well as at 6, 12, 24 and 48 h after LPS/PLA infusion. More specifically, the blood samples obtained were placed into two disparate vacutainer tubes (Vacuette; Greiner Bio-one GmbH, Kremsmünster, Austria); first, 6 ml vacutainer tubes containing heparin for blood plasma collection and second, 9 ml vacutainer tubes containing spray-coated silica for serum collection. Immediately after blood sampling, the blood samples placed in heparin tubes were put into cold water (4°C) for 2 h. Meanwhile, the blood samples collected in spray-coated silica tubes were kept at room temperature for 2 h. Hereinafter, all samples were centrifuged at 2000×g at 4°C for 15 min and subsequently the obtained plasma and serum samples were stored at −80°C until further analyses.
The APP in the obtained serum samples were analyzed in duplicate following certain commercial kits procedures: LBP (HK503; multi-species; Hycult Biotech, Uden, the Netherlands), Hp (GWB-A43, bovine; Genway Biotech Inc., California, USA), and SAA (Tp-802, multi-species; Tridelta Development Ltd, Maynooth, Ireland). The intra-assay and inter-assay CV were controlled by limiting the coefficient of variation to <10%.
The concentrations of several metabolites related to the glucose and lipid metabolism (i.e. non-esterified fatty acids (NEFA), β-hydroxybutyrate (BHBA), glucose, cholesterol and lactate), as well liver enzymes such as aspartate aminotransferase (AST), γ-glutamyltransferase (GGT) and glutamate dehydrogenase (GLDH), as well as calcium (Ca) have been previously published in our companion paper (Aditya et al., Reference Aditya, Humer, Pourazad, Khiaosa-ard and Zebeli2018), and are used in this article only for correlation and multivariate analysis.
Metabolome profiling was carried out in plasma samples obtained 24 h after LPS/PLA infusion using a targeted metabolomics approach as described recently (Humer et al., Reference Humer, Khol-Parisini, Metzler-Zebeli, Gruber and Zebeli2016). In brief, the Absolute-IDQ p180 platform (Kit p180; Biocrates Life Sciences AG, Innsbruck, Austria) was applied using electrospray ionization-liquid chromatography-mass spectrometry (ESI-LC-MS/MS).
Milk sampling and analysis, and feed analysis
Milk samples from the left front quarter of all cows were taken twice daily, at 0730 and 1730 h on four feeding regimen phases consisting of Baseline (day −2), SARA 1 (day 8), SARA Break (day 15), and SARA 2 (day 30, shortly before the LPS/PLA infusion) as well as 12, 24, 36, 48 and 60 h after the LPS/PLA infusion. Immediately after collection, all samples were stored at −80°C until analysis. The concentration of MAA was analyzed following the manufacturer’s instruction of a commercial kit specific for milk (Tp-807; Tridelta Development Ltd, Maynooth, Ireland). In brief, samples were vigorously vortexed after thawing and diluted 1 : 50 in sample diluents buffer before testing. The intra-assay and inter-assay CV were <10%. The offered feeds were collected weekly and analyzed following the guidelines of the German Handbook of Agricultural Experimental and Analytical Methods as described in Aditya et al. (Reference Aditya, Humer, Pourazad, Khiaosa-ard, Huber and Zebeli2017).
Statistical analyses
All data were checked for normality before further statistical analysis using proc univariate of SAS (version 9.2; SAS Institute Inc., NC, USA). The non-normal data were statistically analyzed using the GLIMMIX procedure of SAS, while the rest of data showing a normal distribution were analyzed using the MIXED procedure of SAS. To evaluate the feeding effect before LPS challenge, the blood profiles of dairy cows subjected to CON (n=6) and SARA (n=12) feeding regimens were compared, with the model including the fixed effects of diet and feeding phase, as well as the interaction between diet and feeding phase. Measurements taken at the end of the Baseline were considered as covariates in the analysis. To assess the effect of intramammary LPS challenge in cows experiencing SARA condition or not, the model was divided into three different groups: CON-LPS (n=6), SARA-LPS (n=6), and SARA-PLA (n=6). Besides, the fixed effect of the group and of time (h relative to PLA/LPS infusion), also a possible interaction between group and time was evaluated. When significant, the parity was included as fixed effect, too. For both comparisons, before and after LPS challenge, the individual cow was considered as a random effect. Moreover, data acquired from the same cow at different times were considered as repeated measures with a first-order autoregressive variance-covariance matrix. To compare differences among the least square means (LSM), the pdiff option was used. Furthermore, the overall significance effect of LPS challenge (LPS groups v. PLA group) and LPS challenge related to feeding regimen (SARA-LPS v. CON-LPS) was tested using orthogonal contrasts to investigate the overall effects of the LPS challenge and possible differences in the responsiveness to LPS between cows experiencing SARA or not, respectively. The significant differences among LSM were considered with a P⩽0.05, and the differences among LSM with 0.05<P⩽0.10 were considered as a tendential difference. Associations among blood metabolites were investigated by performing Pearson correlation analysis (Proc Corr of SAS).
Further multivariate analysis was carried out to discriminate treatment groups. Inter-relationships among variables were determined with principal component analysis (PCA) using JMP13 software (SAS Institute Inc.). The correlation matrix was used to generate principal component eigenvalues and associated loading plots. A score plot was used to identify characteristic trends or grouping among cows subjected to the different treatments. To reveal relationships among variables studied the PCA results were also visualized as a loading plot using the first two principal components.
Results
Innate immune variables before intramammary lipopolysaccharide infusion
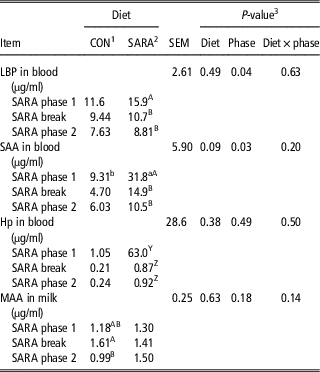
The concentrations of the APP analyzed at the end of the different feeding phases (SARA 1, SARA Break and SARA 2) are shown in Table 1. For LBP an overall effect of the phase was observed (P=0.04), whereby further LSM comparison revealed that higher concentrations at the end of the first SARA challenge (SARA 1) compared with the following feeding phases were only pronounced in cows subjected to the SARA feeding regimen (P<0.01). For SAA a trend toward a higher concentration in SARA cows compared with CON cows was noticed (P=0.09), whereby the difference was only pronounced in SARA 1, with cows experiencing SARA showing a 3.4-fold higher level of SAA compared with CON cows (P=0.01). In accordance with LBP, the effect of phase (P=0.03) occurred only in the SARA group. For Hp no overall effect of the feeding or the phase was observed; however, a specific comparison revealed a trend toward an increase in SARA cows at the end of SARA 1, reaching an average concentration of 63.0 µg/ml compared with the measurements taken thereafter (on average 0.90 µg/ml; P=0.08). The concentration of MAA was neither affected by the diet nor phase. Solely, a lower concentration at the end of the observation period was found in CON cows (P=0.05).
The concentrations of acute phase proteins in blood and in milk in dairy cows fed (n=12) or not (n=6) a subacute rumen acidosis (SARA) diet during different SARA phases

LBP=lipopolysaccharide-binding protein; SAA=serum amyloid A; Hp=haptoglobin; MAA=milk amyloid A.
abDenote differences among LSM of the same row at P⩽0.05. ABDenote differences among LSM of the same column at P⩽0.05. YZDenote tendential differences among LSM of the same column at 0.05<P⩽0.10.
1 The Control (CON) feeding regimen was 40% concentrates throughout the trial.
2 The SARA feeding regimen was offered in different phases which consisted of feeding cows 40% concentrates for 6 days, which was similar to the CON diet (Baseline), then switched up to 60% concentrates for 8 days (SARA phase 1), stepped down again to 40% concentrate level until 7 days (SARA break), and switched again to 60% concentrates level for 17 days (SARA phase 2). The control (CON) feeding obtained the similar diet throughout the trial, consisting of 40% concentrate.
3 Effect of diet, phase, interactive effect of diet and phase (diet×phase).
Changes of immune responses relative to intramammary lipopolysaccharide infusion
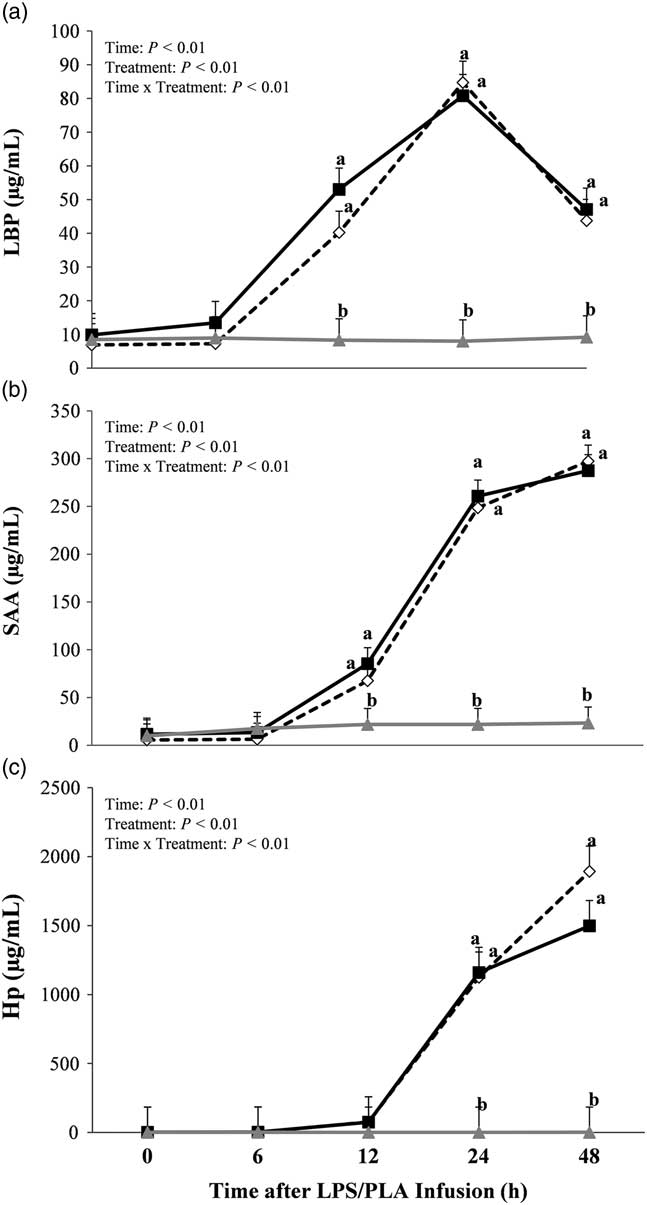
The intramammary LPS challenge enhanced all blood APP (P<0.01, Figure 1), whereby also an interaction between group and time was found (P<0.01). The concentrations of LBP and SAA increased 12 h after the infusion; however, while a peak was noticed at 24 h for LBP, SAA concentrations still slightly increased thereafter (P=0.02). On the other hand, the concentration of Hp started to increase 24 h after the LPS challenge. Overall, no differences were found between CON-LPS and SARA-LPS cows.
Concentration of (a) lipopolysaccharide-binding protein (LBP), (b) serum amyloid A (SAA) and (c) haptoglobin (Hp) in the blood of dairy cows fed a 40% concentrates (Control, CON) diet and receiving a lipopolysaccharide (LPS) infusion (CON-LPS;  ) or an intermittent 60% concentrates, subacute ruminal acidosis (SARA) diet and receiving either a LPS (SARA-LPS;
 ) or placebo (PLA) infusion (SARA-PLA;
 ), measured shortly before as well as 6, 12, 24 and 48 h after LPS/PLA infusion. Data are shown as least squares means (LSM)±standard errors. The superscripts a, b denote differences among LSM of the same sampling time point at P⩽0.05.

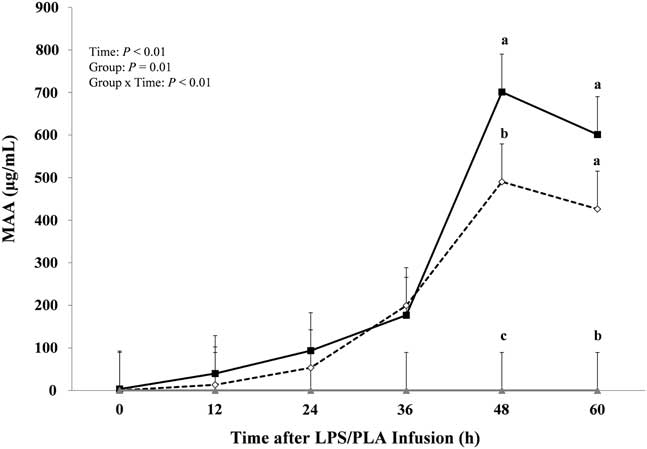
In accordance with the APP measured at the systemic level, also the concentration of MAA was affected by the LPS infusion (P<0.01), showing an increase from 36 h after the challenge onwards (P<0.01). Overall, the highest concentrations were found 48 h after the challenge, whereby at this time point SARA-LPS cows showed 43% higher concentrations compared with CON-LPS cows (Figure 2).
Concentration of milk amyloid A (MAA) in dairy cows fed a 40% concentrates (Control, CON) diet and receiving a lipopolysaccharide (LPS) infusion (CON-LPS; ) or an intermittent 60% concentrates, subacute ruminal acidosis (SARA) diet and receiving either a LPS (SARA-LPS; ) or placebo (PLA) infusion (SARA-PLA; ), measured shortly before as well as 12, 24, 36, 48 and 60 h after LPS/PLA infusion. Data are shown as least squares means (LSM)±standard errors. The superscripts a, b, c denote differences among LSM of the same sampling time point at P⩽0.05.

Changes in the metabolome after the intramammary lipopolysaccharide infusion
The metabolomic approach allowed a simultaneous quantification and identification of 184 metabolites, including 21 amino acids, 17 biogenic amines, free carnitine (C0) and 39 acylcarnitines (Cx:y), 76 phosphatidylcholines (PC), 14 lysophosphatidylcholines (lysoPC), 15 sphingomyelins (SMCx:y) and sphingomyelin derivates [SM(OH)], and the sum of hexoses (about 90% to 95% glucose).
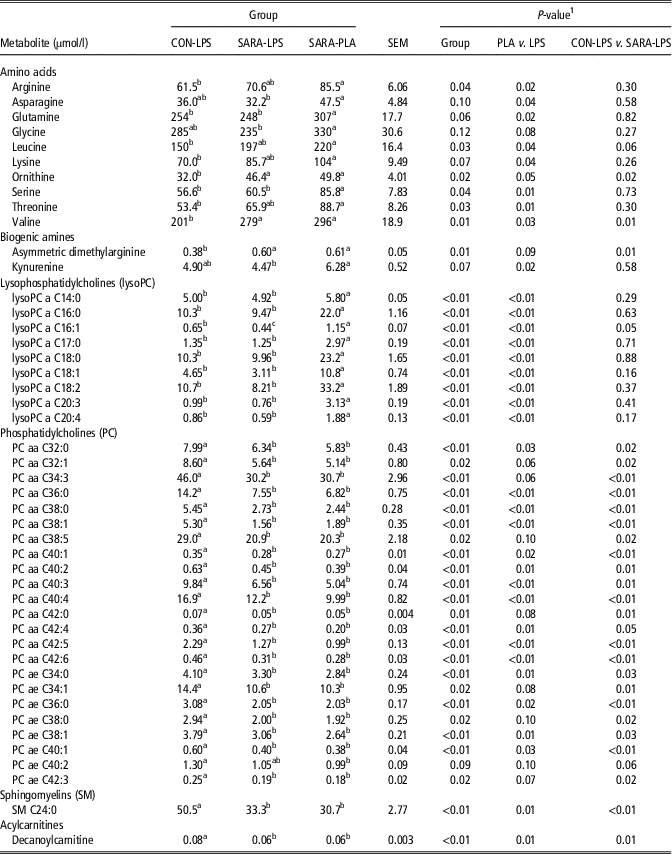
Of the detected metabolites, Table 2 summarizes only those being affected or showing a tendency to be affected by the LPS infusion according to contrast analysis (P⩽0.10). The greatest effect of the LPS challenge was detected for plasma profiles of amino acids, lysophosphatidylcholines and phosphatidylcholines.
Concentration of blood metabolites measured by a targeted ESI-LC-MS/MS-based metabolomics approach in dairy cows fed a control diet and receiving a lipopolysaccharide (LPS) infusion (CON-LPS) or a subacute rumen acidosis (SARA) diet and receiving either a LPS (SARA-LPS) or placebo (PLA) infusion (SARA-PLA)

aa=diacyl residue; ae=acyl-alkyl residue.
abcDenote differences among LSM of the same row at P⩽0.05. yzDenote tendential differences among LSM of the same row at 0.05<P⩽0.10.
1 Effect of different treatments (Group), overall effect of LPS infusion (PLA v. LPS groups) as well as effect of LPS challenge related to feeding regimen (CON-LPS v. SARA-LPS).
Of the 21 detected amino acids, 10 were lower in cows receiving the LPS infusion compared with PLA-cows. More specifically, the concentration of arginine, asparagine, glutamine, glycine, leucine, lysine, ornithine, serine, threonine and valine was lowered by on average 24% (P⩽0.08).
Asymmetric dimethylarginine was reduced in CON-LPS compared with SARA-LPS and SARA-PLA (P=0.01), whereas a reduction of kynurenine (P=0.02) was only pronounced in SARA-LPS cows.
Cows receiving the LPS infusion showed decreased concentrations of lysophosphatidylcholines, affecting nine out of the 14 targeted metabolites. The decrease accounted for on average 56% (ranging from −14% in lysoPC a C14:0 up to −72% in lsyoPC a 20:3) in all lysophosphatidylcholines up to a chain length of 20 carbons (P<0.01). For lysoPC 16:1 SARA-LPS cows showed lowest concentrations, whereas the highest concentration was found in SARA-PLA cows (P<0.01).
Although an overall LPS-effect was noticed for 30% of the PC (P⩽0.10), this effect was solely attributable to the CON-LPS group, showing higher concentrations compared with both SARA groups.
Among the sphingomyelins, SM C24:0 showed higher concentrations in CON-LPS compared with the other groups (P<0.01), whereas no differences were observed for the remaining sphingomyelins. Similarly, solely for one acylcarnitine (decanoylcarnitine) an effect was noticed, with CON-LPS cows showing higher concentrations compared with the SARA cows (P=0.01).
The results of the correlation analysis between blood metabolomic data and the APP as well as metabolites related to glucose and lipid metabolism as well as liver health are summarized in Supplementary Material Table S2. Only significant correlations explaining >20% of the variation are shown. Overall, highest correlations with APP were obtained for lysophosphatidylcholines (i.e. lysoPC a C16:0, lysoPC a C16:1, lysoPC a C18:1, lysoPC a C18:2 and lysoPC a C20:4) and amino acids (i.e. glutamine, arginine, serine and threonine). On the other hand, phosphatidylcholines and sphingomyelins were primarily associated with cholesterol and NEFA.
Multivariate analysis
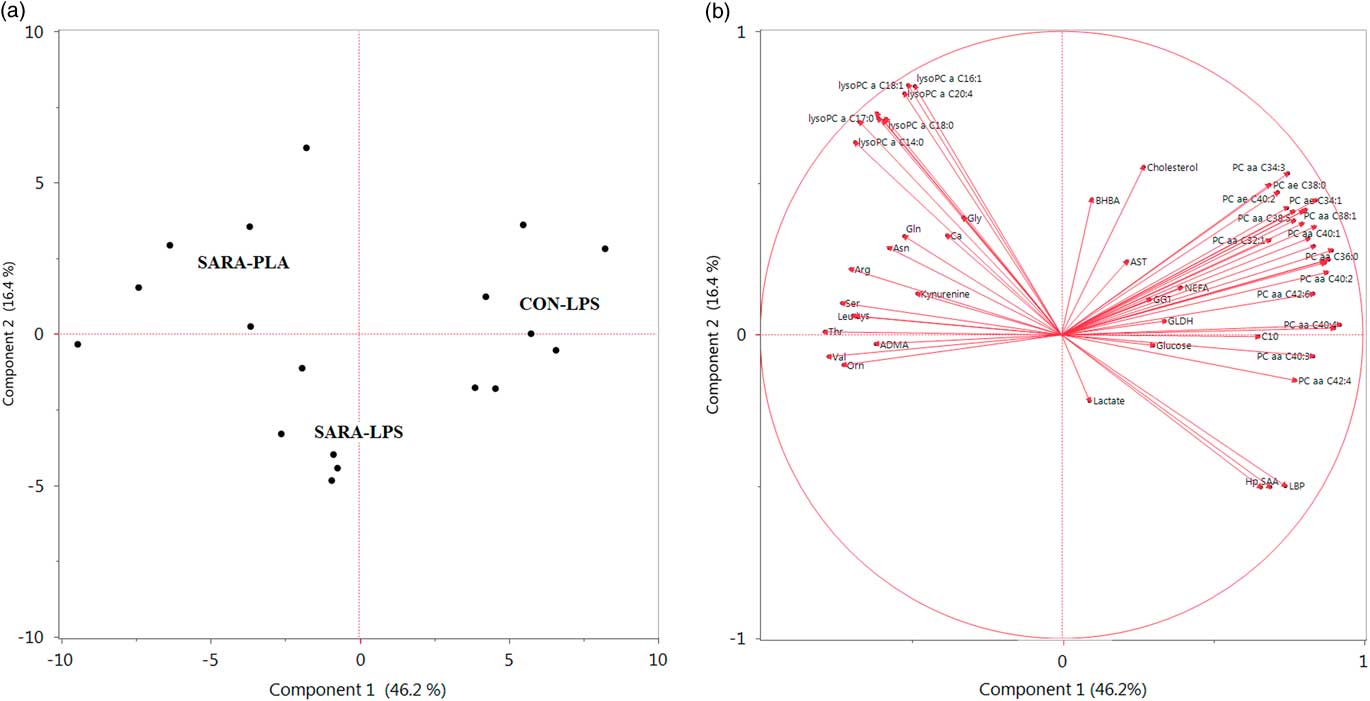
The results of the combined analysis of the blood metabolomic data with the metabolites related to the APR, the glucose and lipid metabolism as well as liver enzymes measured 24 h after the LPS/PLA infusion is shown in Figure 3. The Score Pattern Plot demonstrates clear differences in the grouping of the three different treatments, whereby CON-LPS cows were positively associated with Component 1, whereas SARA-PLA negatively correlated with Component 1. SARA-LPS cows were located in-between these groups. The first two components were plotted in a loading plot, explaining in total 62.6% of the total variation (46.2% and 16.4%, respectively). The APP correlated positively with the first component, whereas the amino acids, biogenic amines, and lysophosphatidylcholines showed a negative relationship. This component can be viewed as instrumental toward the different grouping of LPS v. PLA-cows. Differences between the LPS-groups were mainly pronounced in terms of phosphatidylcholines, lactate, BHBA and cholesterol. In particularly, the different clustering of the LPS-groups seems to be mainly related to lactate, cholesterol and BHBA, which showed a positive correlation (BHBA, cholesterol) and negative correlation (lactate) with component 2.
(a) Score Pattern Plot and (b) Loading Plot of the blood metabolites of dairy cows fed a 40% concentrates (Control, CON) diet and receiving a lipopolysaccharide (LPS) infusion (CON-LPS) or an intermittent 60% concentrates, subacute ruminal acidosis (SARA) diet and receiving either a LPS (SARA-LPS) or placebo (PLA) infusion (SARA-PLA), measured 24 h after the LPS/PLA infusion. ADMA=asymmetric dimethylarginine; Arg=arginine; Asn=asparagine; AST=aspartate aminotransferase; BHBA=β-hydroxybutyrate; Ca=calcium; C10=decanoylcarnitine; GGT=γ-glutamyltransferase; GLDH=glutamate dehydrogenase; Gln=glutamine; Gly=glycine; Hp=haptoglobin; Leu=leucine; LBP=lipopolysaccharide-binding protein; Lys=lysine; lysoPC=lysophosphatidylcholine; NEFA=non-esterified fatty acids; Orn=ornithine; PC=phosphatidylcholine; aa=diacyl; ae=acyl-alkyl; SAA=serum amyloid A; Ser=serine; Thr=threonine; Val=valine.

Discussion
The characterization of immune and metabolomic responses in lactating dairy cows experiencing or not SARA conditions subjected to an intramammary LPS challenge was part of a larger study reported elsewhere (Aditya et al., Reference Aditya, Humer, Pourazad, Khiaosa-ard, Huber and Zebeli2017 and Reference Aditya, Humer, Pourazad, Khiaosa-ard and Zebeli2017b). In brief, cows subjected to the SARA-feeding group experienced SARA as evidenced by continuous reticulorminal pH measurements. This cows experienced a more pronounced response to an intramammary LPS challenge compared with healthy cows, in terms of a decline in dry matter intake, chewing activity and milk yield, as well as a faster increase in reticuloruminal temperature and a stronger perturbation of milk constituents and blood metabolites (Aditya et al., Reference Aditya, Humer, Pourazad, Khiaosa-ard, Huber and Zebeli2017 and Reference Aditya, Humer, Pourazad, Khiaosa-ard and Zebeli2018).
In the present study, only a small effect of the SARA feeding regimen before the LPS infusion on the APR was noticed, with SARA cows showing higher concentrations of the APP during SARA 1 compared with the following feeding phases. The concentrations of APP measured in clinically healthy cattle (<25 µg/ml for SAA and <30 µg/ml for Hp; Humbledt et al., Reference Humbledt, Guyot, Boudry, Mbayahi, Hanzen, Rollin and Godeau2006) were only exceeded in SARA 1 in SARA cows, whereas concentrations measured in CON cows remained within the physiological ranges throughout the entire feeding trial. The underlying reason, why an APR was only noticed in SARA 1 in cows receiving the intermittent high-grain diet is likely due to the stronger decline in reticular pH during the first SARA challenge compared with the second challenge. Indeed, while the reticular pH dropped below 6.0 for on average 9.5 h/day during SARA 1, SARA was successfully interrupted during the Break, and the time duration below 6.0 at the end of SARA 2 averaged 5.9 h/day, and can thus be considered as a mild form of SARA (Aditya et al., Reference Aditya, Humer, Pourazad, Khiaosa-ard, Huber and Zebeli2017). Nevertheless, the concentration of LBP measured in the SARA cows at the end of SARA 1 was still within the range reported for healthy cows (<26 µg/ml, Zeng et al., Reference Zeng, Bequette, Vinyard and Bannerman2009), which might be indicative of an overall low translocation of LPS from the digestive tract into the systemic circulation. Moreover, the overall low concentration of MAA measured before the LPS infusion (<5.5 µg/ml, Gerardi et al., Reference Gerardi, Bernardini, Elia, Ferrari, Iob and Segato2009), confirms a high udder health status of the cows used in the current experiment before the LPS challenge. However, reference values have to be interpreted with caution, as absolute concentrations depend strongly on the assay system used.
The LPS infusion caused a strong increase in the APP at the systemic level as well as the level of the mammary gland, whereby the increase in LBP and SAA occurred about 12 h earlier, compared with the increase in Hp. Similar results have been observed previously (Vels et al., Reference Vels, Røntved, Bjerring and Ingvartsen2009; Lüttgenau et al., Reference Lüttgenau, Wellnitz, Kradolfer, Kalaitzakis, Ulbrich, Bruckmaier and Bollwein2016), and support the assumption that LBP and SAA are of primary importance in the acute and middle phase of the APR, whereas Hp plays its role in the late phase of the APR, when it reaches much higher concentrations than either LBP or SAA (Murata et al., Reference Murata, Shimada and Yoshioka2004; Jain et al., Reference Jain, Gautam and Naseem2011). Overall, the APP display important functions in the nonspecific immune system as they contribute to host defense by binding of LPS, acting on leukocyte function, decreasing tissue damage and showing anti-inflammatory properties (Murata et al., Reference Murata, Shimada and Yoshioka2004; Ceciliani et al., Reference Ceciliani, Geron, Eckersall and Sauerwein2012).
Although, the increase in APP due to an experimental E. coli mastitis has been reported previously, up to the authors best knowledge the blood metabolomic profile in dairy cows after experiencing an intramammary LPS challenge has not been investigated so far. Thus, a deeper screening of blood metabolites related to the protein and lipid metabolism was a major aim of the current research. One of the main findings of the present study was a strong decrease in lysophosphatidylcholines after the LPS challenge. In general, lysophosphatidylcholines principally act as cell-signaling molecules. Their regulatory role in immune functions and association with inflammatory processes has been described before (Kabarowski et al., Reference Kabarowski, Xu and Witte2002; del Bas et al., Reference del Bas, Caimari, Rodriguez-Naranjo, Childs, Chavez, West, Miles, Arola and Calder2016). Lysophosphatidylcholines differ with regard to the lengths and saturation of their acyl chains (Grzelcyzk and Gendaszewska-Darmach, Reference Grzelczyk and Gendaszewska-Darmach2013), whereby cows receiving the LPS infusion had a lower concentration of lysophosphatidylcholines up to 20 carbons, irrespective of their saturation, whereas lysophosphatidylcholines possessing 24 to 28 carbons remained unaffected. Among the lysophosphatidylcholines investigated so far, especially those showing highest correlations to the APP in our study have been linked to inflammatory events. More specifically, lysophosphatidylcholine 18:1 and 20:4 have been reported as inducers of 6-keto PGF1α , a stable degradation product of prostaglandin I2 (Riederer et al., Reference Riederer, Ojala, Hrzenjak, Graier, Malli, Tritscher, Hermansson, Watzer, Schweer, Desoye, Heinemann and Frank2010) and saturated acyl lysophosphatidylcholines (i.e. 16:0) have been reported to stimulate pro-inflammatory mediators such as interleukins and prostaglandins (Hung et al., Reference Hung, Sok and Kim2012). In general, lysophosphatidylcholines have been reported to enhance monocyte chemotaxis and promote the activation of macrophages (Jing et al., Reference Jing, Xin, Zhang, Wang, Qin and Pei2000). Also lower concentrations of lysophosphatidylcholines have been reported in sick dairy cows experiencing diseases such as mastitis, metritis, retained placenta and laminitis (Hailemariam et al., Reference Hailemariam, Mandal, Saleem, Dunn, Wishart and Ametaj2014a). Moreover, the strong reduction in cows receiving the LPS challenge compared with PLA-cows concurs with previous findings in humans, where lysophosphatidylcholines were inversely correlated with inflammatory parameters (Taylor et al., Reference Taylor, Arends, Hodina, Unger and Massing2007). This might be due to an increased consumption of lysophosphatidylcholines for immunological events. However, whether the concentrations of lysophosphatidylcholines in plasma poses potential to serve as indicators of the severity of diseases as suggested previously in humans (Taylor et al., Reference Taylor, Arends, Hodina, Unger and Massing2007) requires further research.
Besides changes in the concentration of lysophosphatidylcholines, also several amino acids were affected by the LPS infusion. In general, amino acids are known for their roles in protein synthesis and carbohydrate metabolism; however, increasing research pinpoints at their role in immunological processes (Suliman et al., Reference Suliman, Qureshi, Stenvinkel, Pecoits-Filho, Bárány, Heimbürger, Anderstam, Ayala, Filho, Alverstrand and Lindholm2005; Zhou et al., Reference Zhou, Loor, Piccioli-Cappelli, Librandi, Lobley and Trevisi2016; Vailati-Riboni et al., Reference Vailati-Riboni, Zhou, Jacometo, Minuti, Trevisi, Luchini and Loor2017). Overall, systemic inflammatory responses are known to stimulate protein catabolism (Karlstad and Sayeed, Reference Karlstad and Sayeed1987), whereby the release of amino acids from muscle proteins serve as a substrate for the synthesis of APP (Grimble, Reference Grimble2001), thereby causing a decline in the concentration of plasma amino acids. As especially glutamine is well recognized as a major fuel for immune cells (Wu, Reference Wu1998), activation of the immune system is assumed to cause enhanced glutamine consumption (Obled, Reference Obled2003). Indeed, highest negative associations among the amino acids and APP have been found for glutamine (r=−0.76 to −0.54; P<0.05). However, independent of their function as substrates, amino acids (i.e. glutamine and arginine) have been reported to be able to improve the functional activities of immune cells (Newsholme, Reference Newsholme2001). In addition, the activation of pro-inflammatory cytokines and the thereof resulting production of reactive oxygen species might enhance the oxidation of amino acids, which may alter their concentration in the plasma (Suliman et al., Reference Suliman, Qureshi, Stenvinkel, Pecoits-Filho, Bárány, Heimbürger, Anderstam, Ayala, Filho, Alverstrand and Lindholm2005). In this regard, studies have demonstrated a decreased concentration of several amino acids in cows with one or multiple diseases including mastitis (Hailemariam et al., Reference Hailemariam, Mandal, Saleem, Dunn, Wishart and Ametaj2014b), as well as a negative association between plasma amino acid concentration and the concentration of circulating inflammatory markers in humans (Suliman et al., Reference Suliman, Qureshi, Stenvinkel, Pecoits-Filho, Bárány, Heimbürger, Anderstam, Ayala, Filho, Alverstrand and Lindholm2005).
The overall higher concentration of phosphatidylcholines in CON cows is likely due to the feeding of lower concentrate amounts to the respective cows, as the feeding of diets with a lower energy density causes an enhanced mobilization of the body lipid stores to cover the high energy requirements, as supported by the higher concentration of NEFA in CON cows before the LPS infusion (Aditya et al., Reference Aditya, Humer, Pourazad, Khiaosa-ard and Zebeli2018). In general, phosphatidylcholines are required for the synthesis of very low-density lipoproteins and associated with cholesterol to surround triacylglycerols (Humer et al., Reference Humer, Khol-Parisini, Metzler-Zebeli, Gruber and Zebeli2016). Therefore, a higher export of triacylglycerols from the liver in CON-LPS cows to provide the necessary fuels for milk production is assumed to concomitantly increase the concentration of phosphatidylcholines in blood. Indeed, high associations between phosphatidylcholines and cholesterol as well as NEFA have been found, which can be considered to be responsible for the different grouping of the serum metabolomic profile in CON-LPS cows v. SARA-LPS cows.
Overall, it can be concluded that the intramammary LPS infusion caused a similar inflammatory response at the systemic level in cows experiencing SARA or not. Interestingly, the MAA concentration after the LPS challenge differed among the groups, whereby SARA-LPS cows showed a stronger concentration 48 h after the LPS infusion compared to CON-LPS cows, suggesting a delayed resolution of the inflammation at the local level of the mammary gland in cows experiencing SARA compared with healthy cows when being subjected to an acute exogenous immunogenic stimulus. This is further supported by the stronger decline in milk yield as well as the more pronounced change in milk constituents in SARA cows, as reported recently (Aditya et al., Reference Aditya, Humer, Pourazad, Khiaosa-ard, Huber and Zebeli2017). However, further studies are required to elucidate the mechanisms behind. Especially studies investigating a broader range of inflammatory markers, such as cytokines, chemokines and further acute phase proteins besides MAA, especially in the early hours (2 to 8 h after the LPS challenge) are needed, to characterize the kinetics of the onset of immune response.
Conclusion
In conclusion, our results revealed that an intramammary LPS infusion increased APP as well as caused a modulation of the blood metabolome toward a reduction of amino acids and lysophosphatidylcholines but without systemic differences in SARA cows and healthy cows. Nevertheless, at the local level of the mammary gland, a higher concentration of MAA 48 h after the LPS infusion in cows experiencing SARA was found. Further research is needed to elucidate the mechanism behind and to evaluate its clinical significance for udder health.
Acknowledgments
The authors acknowledge the staff of the teaching and research farm Kremesberg (University of Veterinary Medicine Vienna) for the excellent help during the feeding experiment, the lab-team at the Institute of Animal Nutrition and Functional Plant Compounds (University of Veterinary Medicine Vienna) for the lab work and P. Pourazad, A. Fengel and K. Wiesböck (University of Veterinary Medicine Vienna) for their help during the experiment. This study was funded by the Vienna Science and Technology Fund (WWTF; D-INFLACOW, LS12-010). S. Aditya thanks the Austrian Agency for International Cooperation in Education and Research (The OeAD-GmbH) – ASEA UNINET for the scholarship support during PhD program in Austria.
Declaration of interest
None.
Ethics statement
All procedures involving animal handling and treatment were approved by the institutional ethics committee of the University of Veterinary Medicine Vienna, Austria, and the national authority according to §26 of the Law for Animal Trials, 2012-TVG (GZ BMWFW-68.205/0096-WF/V/3b/2015).
Software and data repository resources
Data are available from the corresponding author on reasonable request.
Supplementary material
To view supplementary material for this article, please visit https://doi.org/10.1017/S1751731118000411