Introduction
The discovery of Y switchable mirrors, thin films that switch between an optically reflective metallic state and a transparent semiconducting state, opened up a whole new range of applications.Reference Huiberts, Griessen, Rector, Wijngaarden, Dekker, de Groot and Koeman1 It revealed that a metal hydride thin film remains remarkably stable on repeated hydrogenation, despite the large volume changes involved.Reference Kerssemakers, van der Molen, Gunther, Dam and Griessen2 While these volume changes can hardly be avoided, it was nevertheless possible to show that the metal-insulator transition observed on hydrogenation is induced only by the hydrogen concentration and not by the volume change or any other structural transition.Reference Hoekstra, Roy, Rosenbaum, Griessen, Wijngaarden and Koeman3,Reference van Gogh, Nagengast, Kooij, Koeman, Rector, Griessen, Flipse and Smeets4
The optical changes observed on hydrogenation allow for the development of effective combinatorial methods.Reference Olk, Tibbetts, Simon and Moleski5,Reference Dam, Gremaud, Broedersz and Griessen6 Especially in thin films, one can quickly scan thousands of materials systems and identify the most attractive compositions for hydrogen storage and other metal hydride applications. In metal hydrides displaying a metal–insulator transition, the optical changes are easily observed in the visual part of the spectrum, for which the term “hydrogenography” was coined.Reference Dam, Gremaud, Broedersz and Griessen6 However, the same method can also be applied to interstitial hydrides, such as Pd-based hydrides.Reference Gremaud, Slaman, Schreuders, Dam and Griessen7 While the focus of metal hydride thin-film research has been on the discovery of new material compositions, it can also be used to study the effect of doping,Reference Kalisvaart, Luber, Poirier, Harrower, Teichert, Wallacher, Grimm, Steitz, Fritzsche and Mitlin8 interface energy,Reference Mooij, Baldi, Boelsma, Shen, Wagemaker, Pivak, Schreuders, Griessen and Dam9 and the elastic and plastic effects of clamping a nanomaterial to a matrix.Reference Northemann and Pundt10
Besides hydrogen storage, metal hydrides are used in heat storage applications,Reference Felderhoff and Bogdanović11 separation membranes,Reference Mardilovich, She, Ma and Rei12 hydrogen sensors,Reference Butler13 and smart window applications.Reference Mercier and van der Sluis14,Reference Armitage, Rubin, Richardson, O’Brien and Chen15 Here, we focus on the last two applications. The application of both thin-film devices depends critically on microstructural stability during cycling. First, we discuss the present status and potential advantage of the use of switchable mirrors as elements of smart window devices. In the second part of this review, we will present various ways to use the optical changes in metal hydrides to develop a hydrogen sensor.
Smart windows
Smart windows are seen as an important technology to reduce power consumption in automotive and building sectors.Reference Jelle, Hynd, Gustavsen, Arasteh, Goudey and Hart16 The current state-of-the-art smart window is an electrochromic window using WO3 as a switching layer.Reference Bange17 This material has a transparent and dark blue state, depending on the hydrogen content, for instance. However, the shading performance is limited in such an absorption-switching device, because some part of the absorbed energy is re-emitted as heat. Hence, a device that uses a change in reflective properties is desired. The presence of a reflective, metallic state is an important advantage of metal hydrides and makes them highly attractive for smart window applications. While conventional smart windows switch between a transparent and a dark blue absorbing state, metal hydrides can be switched between a transparent and a reflective mirror state.
After the first switchable mirror experiments, in which the hydrogen content was changed through varying the ambient hydrogen pressure (gasochromic hydrogenation), several reports appeared showing the possibility of electrochromic loading.Reference Mercier and van der Sluis14,Reference Armitage, Rubin, Richardson, O’Brien and Chen15 Devices with liquid electrolytes were especially successful.Reference Armitage, Rubin, Richardson, O’Brien and Chen15 Initially, these devices were limited by a very poor cycle lifetime. This appeared to be due to the instability of the metal hydride with respect to the electrolyte;Reference Janner, van der Sluis and Mercier18 the leakage problem of the electrolyte precludes their application. Hence, all solid-state devices were developed.Reference Mercier and van der Sluis14
In the meantime, Mg-Ni-based switchable mirrors were discovered, which benefited from an even larger optical contrast.Reference Richardson, Slack, Armitage, Kostecki, Farangis and Rubin19 This complex metal hydride is characterized by a cubic high-temperature and a monoclinic low-temperature phase.Reference Myers, Wang, Richardson and Rubin20 Even a mechanically induced metal-to-insulator transition has been reported.Reference Blomqvist and Noreus21 The structure is characterized by an anti-fluorite arrangement of complex NH4– and Mg2+ ions, which is slightly distorted in the low temperature phase. The existence of a metallic parent phase with the same metal stoichiometry facilitates the hydrogenation, as compared to other complex metal hydrides. The optical transmission in the fully hydrogenated state of Mg-Ni alloy thin films shows a strong dependence on composition. Using a 40-nm-thick Mg-Ni alloy thin film capped by a 4 nm Pd thin film, an optimal transparency is found at 85 mol% Mg concentration.Reference Yoshimura, Yamada and Okada22 The Pd layer protects it from oxidation and serves as a catalyst for the hydrogen dissociation reaction to take place at room temperature. Remarkably, the optimal transmittance takes place far beyond the composition at which the Mg2NiH4 phase is formed.
Although Mg-Ni thin films show good optical switching, this film has a yellowish color in the transparent state, and this color is not favored for architectural applications. Using a Mg-Ti alloy thin film, a color neutral switchable mirror can be realized,Reference Bao, Yamada, Tajima, Okada and Yoshimura23 however, at the price of lower optical transmittance in the transparent state compared to the Mg-Ni alloy. The newly found switchable mirror material Mg-Ca has the possibility to realize both color neutrality and high transmittance.Reference Yamada, Bao, Tajima, Okada and Yoshimura24 The visible transmittance of Mg-CaReference Yamada, Bao, Tajima, Okada and Yoshimura24 is 45.9%, while that of Mg-Ti is 29.8%.Reference Bao, Yamada, Tajima, Okada and Yoshimura23
Switchable mirrors based on Mg-Ni initially show excellent optical switching. However, significant degradation occurs on repeated gasochromic cyclingReference Yoshimura, Yamada, Bao and Okada25 (alternate exposure to 4% H2 in Ar and dry air of 0.1 MPa). The optical modulation between the metallic and transparent states decreases to 10% after 170 cycles. One of the causes of degradation appears to be the migration of Mg to the outermost surface upon repeated switching.Reference Bao, Yamada, Okada and Yoshimura26 This can be suppressed by an insertion of a metal buffer layer, such as Ti, between Pd and Mg-Ni layers. Another cause of degradation is the deformation of the Pd layer due to volumetric changes occurring during hydrogenation and dehydrogenation. Apparently, a protective coating such as PTFE hinders the degradation, and the switching durability can be improved.Reference Bao, Yamada, Tajima, Okada and Yoshimura27 Although the gasochromic devices described so far have the advantage of a simple layer structure, there is a strong restriction: they can only be used in a double glass pane, which allows for control over the partial hydrogen pressure. Hence, in practice, electrochromic switching is the most desired approach. In this case, the optical properties are switched by applying a voltage to the multilayer structured switching layer. In fact, the device structure is very similar to that of a battery. In this case, however, high coloration efficiency requires a narrow hydrogenation plateau.
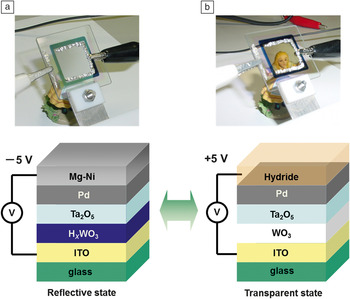
Recently, an all-solid-state switchable mirror device was developed that shows promising cycling properties.Reference Tajima, Yamada, Bao, Okada and Yoshimura28 It consists of five layers—ITO (indium tin oxide), HxWO3, Ta2O5, Pd, and Mg-Ni—sequentially deposited on a glass substrate (Figure 1). By applying –5 V to the Mg-Ni layer with respect to the ITO, protons move from the HxWO3 to the Mg-Ni layer, which then transforms into the transparent state. When changing the polarity, protons go back to HxWO3, and the device returns to the mirror state. The Ta2O5 layer acts as a solid-state electrolyte, and the Pd layer stimulates proton insertion and extraction. It appears that the insertion of a thin Al buffer layer between Ta2O5 and the Pd layers improves the switching durability. It prevents the diffusion of Pd into the electrolyte. Several thousand switching cycles have already been achieved for this electrochromic switchable mirror.Reference Tajima, Yamada, Bao, Okada and Yoshimura29 The quality of the electrolyte is essential for device functionality. The Ta2O5 layer is prepared by reactive sputtering of a metal Ta target, resulting in the required high electric resistivity and a high ionic conductivity. The density of the Ta2O5 layer determines, to a large extent, its switching performance.Reference Tajima, Yamada and Yoshimura30 Note that the outermost surface of Mg4Ni is oxidized and forms MgO with a thickness of several nm. It protects the Mg4Ni layer and also confines hydrogen inside of the device.
Schematic diagram of the structure and switching appearance of the all-solid-state switchable mirror device consisting of ITO: 200 nm, WO3: 300–500 nm, Ta2O5: 300 nm, Pd: 4 nm, and Mg4Ni: 40 nm. (a) The device is in the reflective metallic state in which the dark absorbing state of the HxWO3 adds to the poor transmission. (b) The device is in the transparent state. The hydrogen has left the tungsten oxide (which has become fully transparent) and has moved to the Mg4Ni layer to form the transparent hydride. For practical use, the top surface is covered by a transparent protective polymer.

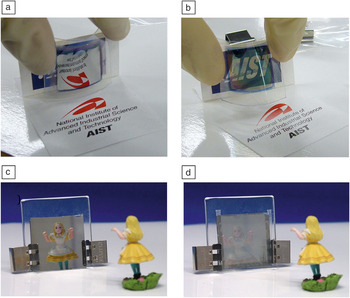
All-solid-state electrochromic switchable mirror devices can be deposited on plastic sheets (polyethylene terephthalate and polyethylene naphthalate) as well as on glass.Reference Tajima, Yamada, Bao, Okada and Yoshimura31 In this way, flexible electrochromic switchable mirror sheets are realized, which may be easily integrated in existing window panes (Figure 2a–b). The mirror state of the switchable mirror has a clear specular surface. Such a clear mirror state may cause glare problems or light pollution when it is used as a building window. There are a few methods to tailor the mirror surface to a more diffuse reflection. One method is to use FTO (fluorine-doped tin oxide) coated glass as a substrate, whose surface has a tailored surface roughness.Reference Yamada, Bao, Tajima, Okada, Yoshimura and Roos32Figure 2c–d shows an example of a switchable mirror on FTO coated glass. It can be switched from the transparent state to a “white” state instead of a mirror state. This technique is important for architectural use of the switchable mirror.
All-solid-state electrochromic switchable mirror sheet (polyethylene terephthalate film) showing switching behavior: (a) reflective state and (b) transparent state; both while bended.Reference Tajima, Yamada, Bao, Okada and Yoshimura31 The layout of the device is the same as in Figure 1. Gasochromic device consisting of 4 nm Pd on top of 40 nm Mg4Ni comparing the (c) mirror state of a normal switchable mirror device on glass to (d) a switchable mirror with a diffusively reflecting surface to prevent glare. The latter is achieved by using a fluorine-doped tin oxide coated glass substrate, which has the appropriate roughness.Reference Yamada, Bao, Tajima, Okada, Yoshimura and Roos32

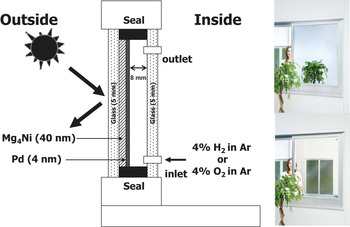
Finally, the energy performance of the switchable mirror window is key to its application. A prototype gasochromic switchable mirror window with a size of 0.8 × 1.2 m was fabricatedReference Yoshimura, Yamada, Bao, Tajima and Okada33 (Figure 3). Two transparent glasses with a thickness of 5 mm make up the double-glazing. Mg4Ni alloy and Pd thin films are deposited on the inner side of the outer glass as a switching layer. Inlet and outlet pipes are connected to an inner side glass pane for gas introduction and extraction. Thin-film deposition was done using a large-scale sputtering machine with a Mg target onto which a couple of Ni pieces were added to reproduce the desired composition. The cooling required to keep a room at constant temperature when equipped with a switchable mirror window has been compared to that of a room equipped with a normal transparent double window (Figure 3). It was found that the smart window reduces the required cooling power by more than 30% on a hot summer day.Reference Yoshimura, Yamada, Bao, Tajima and Okada33
Schematic representation of a prototype gasochromic switchable mirror window; (right) test window in the transparent state (lower panel) and the mirror state (upper panel) in an experiment to measure the reduction in cooling load that can be obtained by such a window.Reference Yoshimura, Yamada, Bao, Tajima and Okada33

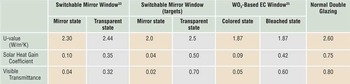
As shown in Table I, the heat transfer coefficient is not improved in smart windows. The advantage is mainly a reduction of the solar transmittance, which is further reduced on switching. The optical switching property and durability of large-scale gasochromic switchable mirror windows make them ready for commercialization. For the commercialization of this window, a PV-powered electrolyzer and gas switching system needs to be developed. The development of WO3-based gasochromic windows has shown that this is feasible.Reference Georg, Graf, Schweiger, Wittwer, Nitz and Wilson34
Comparison of window performance compared to target values and the WO3-based technology.

U-value is the heat transmission rate through a window; solar heat gain coefficient is the fraction of incident solar radiation admitted through a window; and visible transmittance values are given.
Sensors
Cheap, reliable hydrogen sensors are an important enabling technology for the large-scale introduction of hydrogen as a fuel or storage medium (see Hübert et al.Reference Hübert, Boon-Brett, Black and Banach36 for a recent review). For example, in a hydrogen powered car, more than 10 sensors are being envisaged. At present, the detection of hydrogen is mainly carried out using catalytic resistor detectors or electrochemical devices. A disadvantage of this technology is the use of electrical leads, which can induce sparks at the sensing points. Moreover, these systems are relatively large and expensive, and need to be calibrated regularly. The optical changes in metal hydrides allow for the development of optical fiber sensors. The optical detection of hydrogen is attractive since it does not involve any current leads and is thereby intrinsically safe. In the past decade, hydrogen detection schemes using metal hydrides have been developed using either intensity modulation or frequency shift of the utilized optical transducer. In principle, the latter is more reliable since this type of sensor is insensitive to fluctuations of the light source. However, the implementation of such a device is more complex.
Intensity modulation sensors
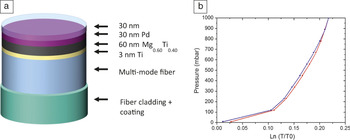
Butler initiated the development of metal thin films as quantitative hydrogen sensors in a micro-mirror fiber-optic sensor configuration.Reference Butler13 He showed that a thin Pd film can be used as a hydrogen detector in which the plateau pressure represents the threshold level. In principle, more subtle concentration changes can also be detected along the pressure-concentration isotherm, albeit with much smaller optical contrast. In fact, Pd alloys are more suited for such a purpose, and moreover offer the advantage of minimal hysteresis. Since, in general, the optical contrast decreases with the increasing concentration of alloying elements, a compromise has to be sought, which has been found in Pd-Au and Pd-Ta alloys.Reference Westerwaal, Duim, Nieuwenhuijse, Perrotton, Dabirian, van Leeuwen, Palmisano and Dam37 The attainable pressure range of these materials, however, is limited. Hence, Slaman et al.Reference Slaman, Dam, Pasturel, Borsa, Schreuders, Rector and Griessen38 introduced a detector in which Pd only serves to catalyze the dissociation/association of hydrogen and simultaneously serves as a filter for selective absorption by the underlying metal (Figure 4).
(a) Schematic representation of the multi-mode optical fiber sensor. A 60-nm-thin Mg0.60Ti0.40 detection layer is deposited on a cleaned and cleaved multi-mode fiber end with a 3-nm Ti adhesion layer and a 30-nm-thin Pd catalytic layer. The Pd layer is capped with a 30-nm sputtered Teflon film to protect the sensor from degradation in humid air. This detector measures in the range below 1 mbar. (b) Replacing the detection layers by 60-nm Pd93Ta7 pressures above 1 mbar are measured as is shown here by the log of the normalized optical transmission of a thin film at room temperature as a function of the hydrogen pressure. Note the small hysteresis when reducing the pressure. Reprinted with permission from Reference 37. © 2012 Elsevier.

Using Mg-based thin films, much larger optical contrasts are obtained at around the lower explosion limit of hydrogen in ambient conditions. Depending on the Mg:Ti ratio, the hydrogen pressure, in principle, can be measured over a wide pressure range.Reference Gremaud, Baldi, Gonzalez-Silveira, Dam and Griessen39 Essential for the proper operation of these sensors under ambient conditions is the use of a protective coating to prevent poisoning of the catalytic Pd layer. While the exact mechanism has not been fully resolved, it appears that RF sputtering of a Teflon target produces a coating that allows the sensor to operate at high humidity conditions.Reference Slaman, Westerwaal, Schreuders and Dam40 In fact, it was shown that it was possible to measure the concentration of dissolved hydrogen in a liquid using the Henry relation.
Plasmonic frequency shift sensors
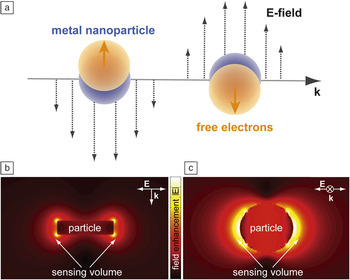
When near-visible light interacts with a metallic surface or a nanoparticle, resonant and collective oscillations of its free electrons can be excited. For the case of a continuous metal film, these so-called surface plasmon resonances (SPRs) can be considered as propagating longitudinal collective charge density waves. When metallic nanoparticles are considered, the electronic excitations are termed localized surface plasmon resonances (LSPRs) and can, in a simple picture, be understood as time-dependent oscillating electric dipoles (Figure 5a).Reference Langhammer and Larsson42 Both SPR and LSPR are most efficiently excited on/in surfaces/nanoparticles of the noble metals gold and silverReference Kreibig and Vollmer41 but can, in principle, be excited with varying efficiency in/on any (metallic) surface or nano-entity with a sufficient amount of “free” electrons.
(a) Interaction of near-visible light with a nano-sized metallic particle can excite resonant collective oscillations in the electronic system—localized surface plasmon resonances (LSPRs). (b) Cross-section and (c) top view through/onto a Au nanodisk with a diameter of 80 nm and a thickness of 20 nm illuminated at the LSPR wavelength. The color-coding schematically illustrates the locally enhanced dipolar field surrounding the particle, as calculated by the finite-difference time domain method. The enhanced field region constitutes a spatially nanoconfined sensing volume, extending a few tens of nanometers from the particle surface, within which even tiny local polarizability changes can be detected. The plotted local field amplitudes |E| are normalized to the incident light. Reprinted with permission from Reference 42. © 2012 American Chemical Society.

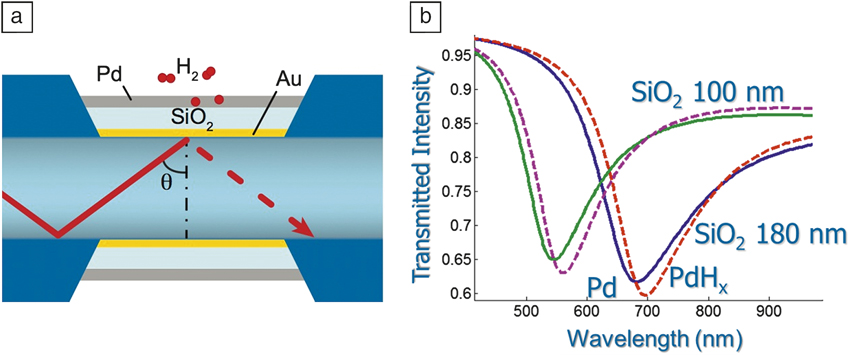
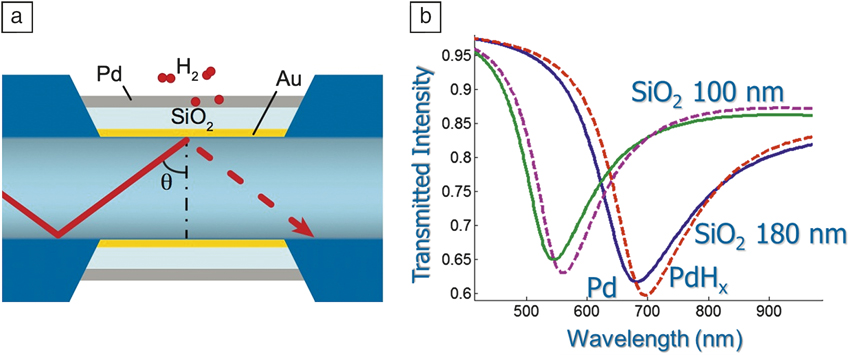
Bevenot et al. used SPR for the first time for hydrogen sensing,Reference Bevenot, Troullet, Veillas, Gagnaire and Clement43 which was based on Chadwick’s demonstration of the SPR effect in thin Pd layers.Reference Chadwick and Gal44 In Bevenot’s study, the hydrogen concentration is detected by measuring the change in intensity of light transmitted through an optical fiber for a specific light input angle and wavelength. Perrotton et al.Reference Perrotton, Westerwaal, Javahiraly, Slaman, Schreuders, Dam and Meyrueis45 showed that an optical response can also be obtained upon collective excitation, thus allowing for a very simple optical fiber layout. Moreover, the resonance frequency can be tuned by replacing the Pd layer with a Au/SiO2/Pd stack and varying the SiO2 thickness.Reference Perrotton, Westerwaal, Javahiraly, Slaman, Schreuders, Dam and Meyrueis45 In this way, several points of measurement may be obtained in a single fiber (see Figure 6). In principle, the same layout can be used when replacing Pd with, for example, a Mg/Pd stack. The equilibrium pressure of the MgH2 then largely determines the optical response, which results in a hydrogen detector operating at lower hydrogen pressures.
(a) Schematic representation of the cross-section of an optical fiber onto which a thin gold layer is deposited; the surface plasmon is induced in this gold layer. The resonance frequency depends on the dielectric function of the surrounding material. By changing the SiO2 thickness, several resonance frequencies can be generated along a single fiber. (b) Pd is deposited on top of the SiO2 layer; changes in the dielectric properties of Pd due to hydrogenation have a small but measurable effect on the resonance frequency (dotted lines). Reprinted with permission from Reference 45. © 2013 Optical Society of America.
Emerging nanotechnologies, which facilitate the efficient fabrication of nanoparticles and nanostructures, offer alternative opportunities for the development of hydrogen sensors that exploit the LSPR in metallic nanoparticles. This has the advantage of a very simple optical readout and immense miniaturization potential. Nanoparticles that support LSPR interact very strongly with near-visible light via efficient light absorption and scattering and are very sensitive to several structural parameters, such as nanoparticle size and shape as well as to the chemical nature of the used metal itself.Reference Zoric, Zäch, Kasemo and Langhammer46 Furthermore, the polarization of the electronic system of the plasmonic nanoparticle creates local strongly enhanced electromagnetic fields (with respect to the incoming light field), as illustrated in Figure 7b–c. In this way, a spatially nanoconfined sensing volume, extending a few tens of nanometers from the plasmonic particle surface, is created. Within it, even tiny changes of the polarizability or volume of a material can be detected as a slight mutation of the optical response of the plasmonic particle.
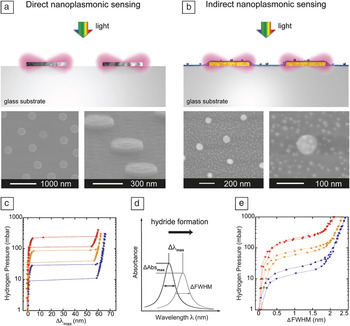
(a) Schematic illustration of a direct nanoplasmonic sensing arrangement where Pd nanoparticles, in which localized surface plasmon resonance (LSPR) is excited upon illumination with white light, constitute a sensor and hydride-forming material at the same time. (b) Schematic illustration of an indirect nanoplasmonic sensing arrangement where gold nanoparticles constitute the inert LSPR-active sensor entities. They are covered by a thin dielectric layer onto which a hydride-forming material is deposited; Pd nanoparticles in the 5 nm size range were used here. Through the enhanced plasmonic electric field surrounding the gold sensors, hydride formation in the Pd particles was probed. (c) Optically measured pressure-Δλmax isotherms at 30°C (blue), 55°C (orange), and 80°C (red) for the hydride formation and decomposition in 300-nm-sized Pd nanodisks. These were obtained by relying on the direct sensing principle. The Δλmax signal is proportional to the hydrogen concentration. Reprinted with permission from Reference 56. © 2011 Wiley-VCH Verlag GmbH & Co. (d) Corresponding optical isotherms obtained by the indirect sensing approach for 5 nm Pd nanoparticles. Even in this case, the full-width-at-half-maximum signal is proportional to the hydrogen concentration. Reprinted with permission from Reference 50. © 2010 American Chemical Society. (e) Schematic illustration of the used readout: shifts of the LSPR peak as obtained from an optical transmission, reflection, or dark-field scattering experiment.

As a consequence, plasmonic nanoparticles have been widely explored for biosensing applications since the end of the 1990s.Reference Englebienne47 Since then, a large number of LSPR-based biosensors have been developed, as summarized in recent reviews (e.g., Anker et al.).Reference Anker, Hall, Lyandres, Shah, Zhao and Van Duyne48 Furthermore, the capability and potential of single particle-based plasmonic sensing for ultimate miniaturization of a sensor device was realized and demonstrated early on.Reference McFarland and Van Duyne49
Due to the simple design of the sensor and necessary optics, remote readout and flexibility of the LSPR was also soon identified as an interesting transducer for chemosensing applications. As in the SPR case, we recognize two layouts. In so-called “direct nanoplasmonic hydrogen sensors,” the hydride-forming material simultaneously constitutes the plasmonic transducer (Figure 7a) and the chemically active element.Reference Zoric, Larsson, Kasemo and Langhammer56
In a second arrangement, utilizing the enhanced local electric field around gold plasmonic particles to probe the nano-environment, the LSPR excitation in the gold particles can be used to detect the interaction of hydrogen (or another analyte molecule) with an adjacent material, which is tailored to interact strongly with hydrogen by hydride formation (Figure 7b). To date, this active material is palladium. However, other materials discussed previously could, in principle, also replace it, which makes this approach more flexible. Since in this arrangement the LSPR in a gold particle (which itself does not interact with the hydrogen) probes a material adjacent to it, we classify these types of arrangements as “indirect nanoplasmonic hydrogen sensors.”Reference Langhammer, Larsson, Kasemo and Zoric50,Reference Larsson, Langhammer, Zoric and Kasemo51
Both of these methodologies have been successfully employed in the recent development of nanoplasmonic hydrogen sensors based on Pd and Pd/Au composite nanostructures, including recent theoretical efforts and reports on measurements of individual isolated sensor entities.Reference Langhammer, Larsson, Kasemo and Zoric50,Reference Langhammer, Zhdanov, Zoric and Kasemo52–Reference Tittl, Kremers, Dorfmuller, Chigrin and Giessen60
In all these examples, a specific type of plasmonic nanoparticle is used as the transducer, which translates the hydrogen interaction with a material (typically the hydride formation process in palladium nanoparticles), into a slightly changed resonance condition for the LSPR. The latter, in turn, is reflected in a (often tiny) shift of the resonance wavelength (corresponding to a “peak in an optical extinction spectrum,” Figure 7d), Δλmax, a change of the peak full-width-at-half-maximum), ΔFWHM, or a change in the amount of light absorbed or reflected from the sensor (Figure 7d). These signals are then read off remotely by means of rather simple optical transmission or reflection spectroscopy and related to the amount of hydrogen present in the environment. For both direct and indirect sensors relying on palladium, it has been shown experimentally and theoreticallyReference Langhammer, Larsson, Kasemo and Zoric50,Reference Zoric, Larsson, Kasemo and Langhammer56,Reference Ameen Poyli, Silkin, Chernov, Echenique, Diez Muino and Aizpurua59 that the response of the respective sensor is a linear function of hydrogen concentration in the considered spectral range. Figures 7c (for a direct nanoplasmonic sensor using palladium nanodisks as transducers) and 7e (for an indirect nanoplasmonic sensor) show optical pressure-composition isotherms for palladium nanoparticles obtained at three different temperatures, illustrating the high sensitivity of these devices to hydrogen gas.
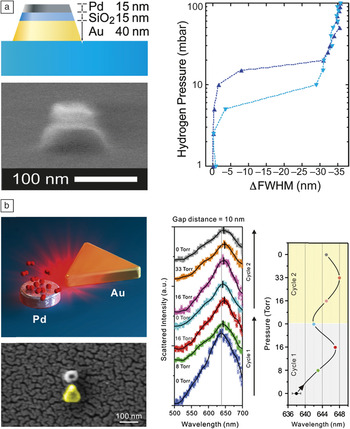
As mentioned previously, LSPR-based sensing offers the unique opportunity to address individual nanoparticles. Figure 8 illustrates the potential of nanoplasmonics to facilitate miniaturized hydrogen sensors at the single particle level. Figure 8a shows a stacked Au/SiO2/Pd nanocone arrangement, which Shegai et al. successfully used to measure optical pressure-composition isotherms for hydrogen sorption in a single palladium nanoparticle.Reference Shegai and Langhammer55 This design follows the indirect sensing principle since the hydride formation in the palladium element is probed by the adjacent gold particle in the sandwich arrangement. Figure 8b shows a slightly different planar arrangement of a gold sensor and palladium hydride-forming nanoparticle arrangement where the plasmonic “nanofocus” produced by the gold triangle is utilized for probing the adjacent palladium nanoparticle.Reference Liu, Tang, Hentschel, Giessen and Alivisatos57
(a) Left: scanning electron microscopy (SEM) image and schematic depiction of a stacked single particle plasmonic hydrogen sensor consisting of an approximately 40 nm high truncated Au nanocone (the sensor) with a nominal base diameter of 105 nm, covered by a 15 nm SiO2 spacer layer (to avoid alloying between Au and Pd) and a Pd particle with approximate dimensions of 75 nm × 15 nm on the tip, which interacts with hydrogen via hydride formation. Right: Corresponding optical hydrogenation isotherm that indicates that the hydrogen concentration in the environment can be quantitatively measured using a single nanoparticle. Reprinted with permission from Reference 56. © 2011 Wiley-VCH Verlag GmbH & Co. (b) Left: sketch and SEM image of a plasmonic nanofocus arrangement where the triangular plasmonic Au sensor probes the hydrogen absorption in the proximal Pd nanoparticle at the single particle level for hydrogen sensing. Right: Optical-scattering measurements of a single Pd-Au triangle antenna on hydrogen exposure. The hydrogen partial pressure is raised from 0 Torr to higher pressures and back, at room temperature. The right diagram shows the localized surface plasmon resonance peak shift, Δλmax, on increasing and decreasing hydrogen concentration, respectively. Reprinted with permission from Reference 57. © 2011 Nature Publishing Group.

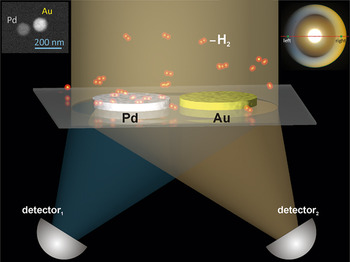
Finally, we also highlight a slightly different approach to LSPR-based hydrogen sensing, which exploits a nanoplasmonic color routing process.Reference Shegai, Johansson, Langhammer and Kall54 This novel single-wavelength LSPR-based approach can take full advantage of the wide availability of cheap and robust monochromatic laser sources and simple single channel detectors as well as the inherent miniaturization potential of nanoplasmonic sensorsReference Shegai, Chen, Miljkovic, Zengin, Johansson and Kall61 caused by internal optical phase shifts in bimetallic plasmonic structures. Such heterometallic optical nanoantennas in the form of closely spaced Pd and Au nanodisks (“dimers”) were used for single-wavelength self-referenced measurements of hydrogen across the α-β transition in the palladium-hydrogen phase diagram, as shown in Figure 9.
Schematic depiction of a self-referenced plasmonic hydrogen sensor based on directional light scattering from heterometallic dimer nanoantennas. The heterodimers built from closely spaced Au and Pd nanodisks (see left inset for scanning electron microscopy image) exhibit pronounced directional scattering, that is, for particular wavelengths, much more light is scattered toward the Au than toward the Pd particle in a dimer. This effect is caused by optical phase shifts associated with material asymmetry and is therefore highly sensitive to changes in the permittivity of Pd induced by hydrogen sorption. The right inset is a Fourier color image obtained for incident polarization perpendicular to the dimer axis after applying a hydrogen partial pressure of 100 mbar.Reference Shegai, Chen, Miljkovic, Zengin, Johansson and Kall61

Conclusion
The application of metal hydrides is not limited to the field of storage. In addition, research into optical properties and related applications is also a fruitful field of materials science. Smart window research shows that this technology has huge potential to reduce the energy cost involved in the heat and light management of buildings. So far, the cost to implement this technology has been prohibitive. The recent discovery of a visible-light-induced photochromic effect in YOyHx exemplifies that simpler, low-cost technologies might be possible.Reference Mongstad, Platzer-Bjorkman, Maehlen, Mooij, Pivak, Dam, Marstein, Hauback and Karazhanov62
The field of sensors is rapidly growing. In addition to the intensity modulation sensors, plasmonic frequency shift sensors have been developed. In plasmonics-based hydrogen sensors, the plasmonic nanoparticles or thin films are used as transducers, which “translate” the hydrogen sorption and hydride formation in an active material (which is either the plasmonic particle itself or a material adjacent to it, to date usually Pd) into a shift of the absorption wavelength. The high temporal resolution, robustness, and generally simple arrangements needed for readout paired with high sensitivity make nano-plasmonic hydrogen sensors very attractive. As the main challenge, we identify (as is common for other Pd-based sensors) the potential cross-sensitivity of the sensors for other species as well as the well-known risk for poisoning by, for example, carbon monoxide or sulfur species.