1. Border management and economics
The management of people at the border includes legal and illegal approaches at ports of entry (POEs) and the typically undocumented or illegal attempts to cross between POEs. Management of these flows is the responsibility of the Department of Homeland Security primarily through its U.S. Customs and Border Protection (CBP) component. The vast majority of those approaching the border represent the admissible flow of travelers and workers with documentation, even if some later violate terms of their entry. Other cases can be more complex such as undocumented people seeking asylum and various categories of inadmissibility including criminals and illegal attempts to cross the border. This analysis focuses on those who are initially identified as inadmissible, about 1 million in the base year of this analysis, 2017. This population is later divided into those who are legally granted entry – successful asylees – and the remainder who are not granted legal access into the USA. Many of these inadmissible individuals are at the southern U.S. border that has a long history intertwined with immigration, legal and illegal work, and humanitarian policy involving refugees and asylum seekers.
Border management has elements of standard economics where inputs are combined to produce multiple outcomes including screening and treatment among adults, families, children, criminals, Get Aways, and turn-backs – some of whom who may try to re-cross later. Different management technologies, including different policies, can affect probabilities and value of these outcomes. This research is the first to value (shadow price) and synthesize using benefit–cost principles the numerous outcomes at the border to estimate the net present value (PV) of border control activities. The results inform both the aggregate net benefit of policy in 2017 and the residual un-managed costs while providing new disaggregated estimates about the value of successful asylees, removed criminals, and fiscal effects among others. The net benefits of illustrative potential policies are explored, but nothing definitive can be stated about future policies in the absence of cost and specific effectiveness information.
The economics of border management references many literatures. Perhaps most directly related are studies of immigration economics such as those by the National Academy of Science (2017), Borjas (Reference Borjas2014), West (Reference West2011), Karoly and Perez-Arce (Reference Karoly and Perez-Arce2016), and Congressional Budget Office (CBO) (2007) that look at outcomes inside a country or state and not uniquely at the border. These studies identify the generally positive contribution of immigrants to economic activity and growth while investigating distributional consequences in labor markets, such as possible effects on native-born workers, and fiscal impacts at the federal and state levels. Literature related to the costs of crime is used here to value criminal actions (e.g., Cohen & Piquero, Reference Cohen and Piquero2009; Miller et al., Reference Miller, Cohen, Swedler, Ali and Hendrie2021). The literature on criminal deterrence involves both probability and severity which in the immigration context can be both specific to an individual near the border and general for those more distant (e.g., Nagin, Reference Nagin and Tonry2013; Hoekstra & Orozco-Aleman, Reference Hoekstra and Orozco-Aleman2017; Bazzi et al., Reference Bazzi, Hanson, John, Roberts and Whitley2021; Bansak et al., Reference Bansak, Blanco and Coon2022). Using the literature on the value of a statistical life (VSL) is more complex than usual here due to its application to the deaths of foreign nationals (Dana, Reference Dana2009; Viscusi & Masterman, Reference Viscusi and Masterman2017). Further, a wide range of administrative policy and data on border management including the treatment of asylees, children, and families (e.g., GAO, 2020; 2021; DHS 2019; 2021; Humane Borders, 2021) is central to the analysis. Finally, in contrast to studies about all immigrants when in the U.S. interior, a benefit–cost study of border management requires careful delineation of who has standing, that is, whose benefits or costs are counted (Whittington & MacRae, Reference Whittington and MacRae1990; OMB, 1993; 2003). While this delineation may be offensive to some, it is designed to be consistent with current law and policy, thus setting up analyses of changes to law or policy. Further literature issues are discussed in the context of specific estimation issues although the reader is referred to the original literature for details on controversies that here are primarily addressed through sensitivity analysis.
The article is organized as follows: Section 2 presents the analytical framework, Section 3 reviews the frequency of the outcomes and the base case for 2017, Section 4 presents major estimation issues, their literature, and valuation estimates, Section 5 reports results for both the managed and unmanaged outcomes, Section 6 investigates the sensitivity of results to key parameters, Section 7 analyzes the benefits of illustrative potential policies, and Section 8 summarizes.
2. Analytical framework
Central to border management is screening that directs individuals into legal- or policy-identified categories and implements policy for those categories. There are analogies to policing in a city and to pollution control. With policing, the challenge is to not disturb legal activity while preventing or after the fact investigating potentially illegal actions and then taking legal and policy consistent action. Benefits come from illegal activities interrupted and deterred, sorting occurs between the innocent and the guilty, sometimes with error, and implementation costs exist. The analogy to pollution control is based on optimal pollution control. Even optimal control is not expected to be complete as some residual pollution occurs (e.g., Hanley, Shogren and White, Reference Hanley, Shogren and White2007; Farrow, Reference Farrow2015). Border management is analytically simpler than pollution control in that the government carries out the actual control and does not act indirectly through firms, but in place of residual pollution there are unmanaged individuals from imperfect control, an important element of this study.
Returning to the policing analogy and focusing on potentially illegal activity, what appears to be illegal can become legal if the person is screened at a cost and found “innocent,” analogous to those initially inadmissible who are granted asylum. The benefits are the economic and security gains from the person newly entering the USA. An actual illegal entry that is stopped has a benefit of the costs avoided had the illegal activity continued in the interior of the country. An illegal activity that is not stopped has a cost, but it is a residual social cost that would have occurred without policing. Deterrence avoids costs and occurs as a function of enforcement. Outcomes also have impacts that may persist for years as when a person is granted asylum with permission to work, or alternatively an illegal entrant removed across the border may only be deterred for a short time.
This analysis computes the net benefits and residual costs of the border technology in place in 2017. The actual outcomes of that year – the managed, unmanaged, and deterred as a function of the managed – represent the “with policy” scenario. In contrast, the “without” border management counterfactual has all the initially inadmissible individuals plus those deterred hypothetically entering the USA successfully but illegally. The same laws would exist, but there would be no enforcement. This is the initial type of uncontrolled comparison used in most textbooks. One might imagine dramatic dynamic changes in immigration if there were actually no enforcement, but an estimate of those deterred in 2017 provides an analytical basis for the “without-policy” baseline of activity. New applications of the model that might help design policies such as those explored in Section 7 would estimate incremental changes compared to the 2017 “with policy” scenario while requiring additional policy specific cost information. An economic optimum is highly unlikely to be achieved so that policies tend to be evaluated on an incremental basis while leaving a residual, unmanaged, portion.
2.1. Benefit–cost, decision analysis or both?
Both benefit–cost and decision analyses (BCA and DA) are core techniques to inform the welfare impacts and net benefits of government investment decisions (Boardman et al., Reference Boardman, Greenberg, Vining and Weimer2018; Weimer & Vining, Reference Weimer and Vining2017). BCA is most familiar to economists and identified in government guidance as the appropriate tool for U.S. Government investments in general and for analyzing regulation (OMB, 1993; 2003). The DA structure will be useful however to present results by outcome categories, such as removing an illegal immigrant or granting asylum in contrast to BCA impact categories such as fiscal costs or asylee income. Presenting results in both formats increases the relevant metrics without changing the bottom-line expected value.
3. Outcomes
Flows of people at the U.S. border are large and variable over time. National and international economic, policy, and political conditions affect business and leisure travel, migration, refugees, asylees, and so on. The approach here is to fix those conditioning factors by using a base year, 2017, for which data were generally available and prior to expanded family separation by the Trump Administration, COVID-19, and the initial policies of the Biden Administration which are here viewed as short-term shocks until border policy becomes more settled. Future analyses could alter parameters and flows as the analyst sees fit in comparison to this base yearFootnote 1. This section reports the size of the initially inadmissible portion of those flows in the context of total flows and identifies major categories of the initially inadmissible.
The initially inadmissible, here defined as those apprehended between POEs, or deemed inadmissible at POEs, but omitting illegal maritime and airport flows, is a small proportion of total presentations at the border, less than 1 %. The focus of this article is about 800,000 events (some individuals are encountered more than once) in 2017.
Three categories of events do not result in direct interaction with the border management system. The Get Away category, estimated at 20 % of the total cases, is based on observation at the border and model estimates of total attempted crossings (DHS, 2019). These individuals are assumed to add to the population of illegal immigrants in the USA. Turn Backs, 12 % of the total cases, are based on indirect and direct observation (DHS, 2019) of those who illegally enter the USA but return to their country without being apprehended or becoming a Get Away. Some of these will try to re-cross the border. Both Turn Backs and Get Aways are assumed to be a mixture of non-criminal and criminal individuals consistent with proportions from observed enforcement actions. DHS also reports about 300 individual deaths within the USA that they investigate on or near the Southwest border, whether in the desert or along waterways. As DHS does not investigate all such cases, the number reported by DHS is adjusted by evidence in the Tucson sector. That evidence suggests that actual deaths are about 70 % greater than the reported number of deaths (Humane Borders, 2021; GAO, 2021) such that mortality is about 0.06 % of the total cases.
Enforcement actions include those deemed inadmissible by the Office of Field Operation (OFO) or Apprehended by the Border Patrol (BP), both part of CBP. Within these categories are humanitarian actions comprising about one-third of all cases in 2017. Humanitarian cases are those people seeking asylum or are unaccompanied children who are likely to be taken at least temporarily into custodial care, a controversial issue.
Those seeking asylum, either affirmatively as they arrive or defensively as they are in the process of being removed, must go through a complex process central to which is establishing “credible fear” if they were to be in their home country. Of these humanitarian cases, Unaccompanied Minors (UAMs), Family Units (FUs), and Adults (Other Humanitarian) were about 7, 13, and 12 %, respectively, of total cases in 2017 although there are somewhat ambiguous and overlapping sources of information (DHS, 2019). Each of these categories has three further sub-groups depending on the resolution of their case. Resolution can be: (1) achieve legal asylum status, (2) removal from the USA after being denied asylum, or (3) Removed in Absentia (RIA), essentially becoming a Get Away. Pending improved information, these three outcomes for all Humanitarian categories are assumed to follow long-run averages reported by the Department of Justice (DOJ, 2019) of 59 % being removed, 27 % Get Away/RIA, and 14 % achieving legal asylum status.
The remaining non-humanitarian, enforcement actions resulting in removal account for 34 % of the total cases (DHS/CBP, 2021). For valuation purposes, this category is further divided into non-criminal (32 % of the total; 93 % of this category) and criminal cases (2 % of the total; 7 % of this category). Information about the types of prior criminal convictions informs both the benefit of removing a criminal and the cost of a Get Away criminal.
3.1. Managed and residual outcomes
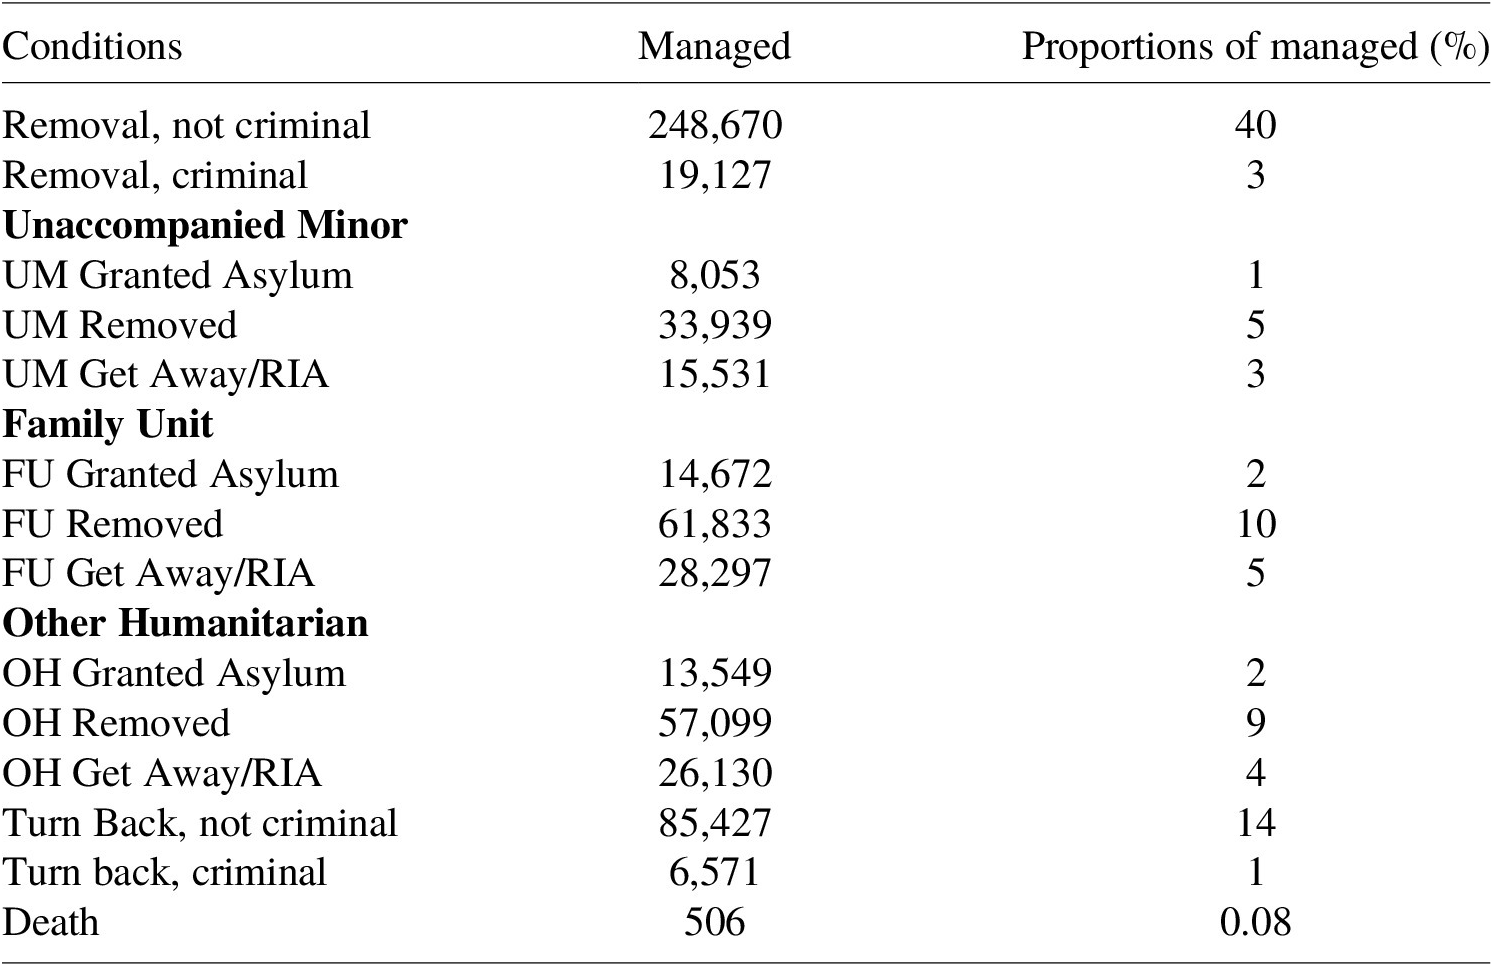
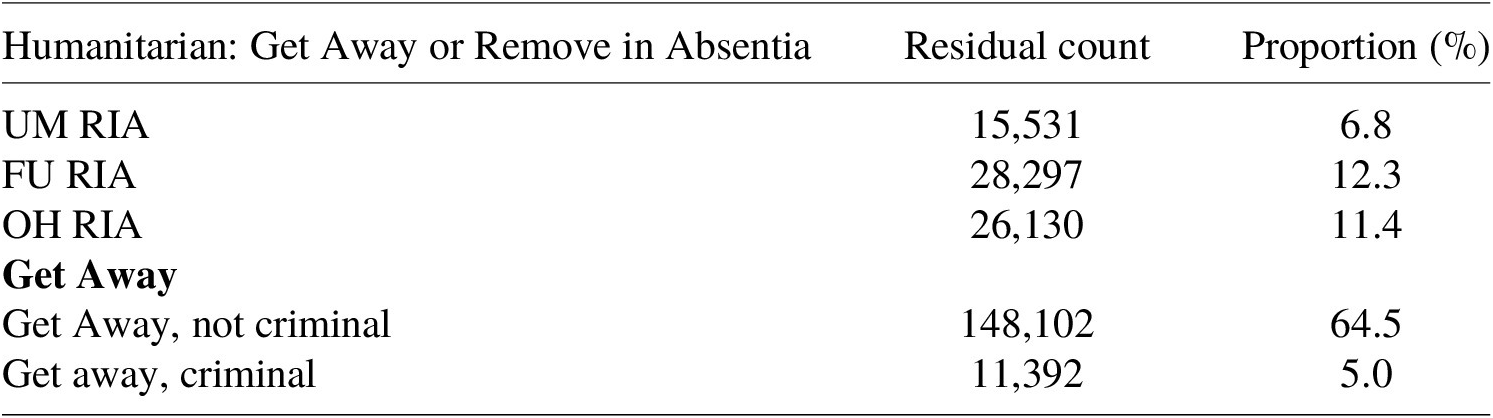
There are 16 unique outcomes for analysis as identified in Tables 1 (14 outcomes) and 2 (unique Get Away outcomes). Importantly, total outcomes from above will be identified as “managed” and others identified as “residual.” These outcomes result from the interaction of people approaching the border and DHS implementation of screening at the border. Screening decisions are here assumed correct in that there are no adjustments for false positive or false negatives due to lack of data on such rates. Proportions of the managed are presented in Table 1 below which will be used as outcome probabilities for estimating expected net benefits. For example, removals at the border account for 43 % of the total managed with 3 % of those being criminals. Additional removals, in each of the humanitarian categories of UAMs, FUs, and Other Humanitarian, account for 24 % of those managed.
Managed outcomes analyzed, 2017.

Residual outcome analyzed, 2017.

Source: author’s calculations based on public DHS data.
The residual or “unmanaged” outcomes in Table 2 are the basis for residual costs that are unchanged from the baseline with the existing technology. The two new outcomes are those who Get Away, whether criminal or non-criminal. Further, some humanitarian cases who are initially managed in Table 1 are RIA and essentially get away from the asylum process as presented in Table 2. Note that the humanitarian RIA cases appear in both Tables 1 and 2 to facilitate tracking the different kinds of costs they impose on the system or in the interior of the country. The residual outcomes are particularly useful for potential prospective analyses.
4. Assumptions and valuation data
The structure of a decision tree is first used to integrate the probabilistic elements and branch outcomes for the analysis. The endpoint frequency-based probability of each outcome is from Table 1. Most attention is devoted here to valuing, using benefit–cost principles, each of the 14 managed outcomes and 2 (unique) residual outcomes. As there are also, by happenstance, 16 potential components to the aggregate value for any particular branch, each year of the analysis has the potential for 256 combinations of component values and outcomes (16 × 16). Fortunately, many of these hundreds of items are either zero or repeat estimates elsewhere, sometimes with opposite signs. This section highlights assumptions for some of the more controversial items.
4.1. Noteworthy issues in valuation
4.1.1. Standing
BCAs should clearly define the population whose benefits and costs count, the determination of standing. That population could be everyone in the world, a country, a state, a region, a city, etc., although the determination is usually left as a policy matter to those who would use the analysis (e.g., Whittington & MacRae, Reference Whittington and MacRae1990). Guidance on the topic sometimes takes the form of “social constraints” as to what is legal in a jurisdiction. To that end, including only legal activity is common practice such that benefits and costs to a law breaker are not counted (e.g., Rowel & Wexler, Reference Rowel and Wexler2014). Further, U.S. Government guidance for conducting BCAs for both investment and regulatory purposes states that “Your analysis should focus on benefits and costs that accrue to citizens and residents of the United States” (OMB, 2003).
The implications of standing are central to this analysis. Regarding those initially inadmissible, all those whose activities are deemed illegal do not have their own benefits and costs count, for example, income earned by a Get Away within the USA does not count although there is an effect on the labor market and profits. The assumption of standing results in many zero category entries for benefits or costs for those deemed illegal. However, benefits and costs do count for those whose activities are deemed legal, specifically those granted asylum. Further, costs borne by U.S. taxpayers and residents do count when they are associated with a person without standing, there is no offsetting benefit to the person receiving those benefits. However, a person with legal status, such as a successful asylum seeker, receives a counter balancing benefit (transfer) to a cost borne by a U.S. taxpayer with a net social impact of zero in some categories. It is the opinion of the author that this BCA practice also helps clarify some issues in the public debate.
4.1.2. Benefit to successful asylum seekers
Successful asylum seekers are legally in the USA, and their benefits and costs are included. The reasons people migrate are many and varied (National Academy of Sciences, 2017). They often include expected improvement in their standard of living, but a successful asylum application must also demonstrate “that there is a ‘reasonable possibility’ that he or she will be tortured in the country of removal or persecuted on the basis of race, religion, nationality, political opinion, or membership in a particular social group” (American Immigration Council, 2021). This adds a security or “credible fear” dimension to the migration and asylum decision. Successful asylees come from all over the world through all types of entry including airports, but in 2017, the top 5 countries from which asylees were granted (affirmative) asylum were: Venezuela, People’s Republic of China, Guatemala, El Salvador, and Mexico (DHS, 2020). This report uses Mexico and Central and South American countries as its statistical focus for external land borders.
The benefits to successful asylum seekers are quantified by their income over time and the value of improved securityFootnote 2. While the (legal) income benefit to successful asylees is clear, counting income as a benefit for the previously unemployed (in the USA) is somewhat unusual in a BCA. One argument is that in comparison to the base case, production is changed from a non-countable region – another country – to within the USA. This is the approach taken in a multi-market model (more below) of the impact of immigrants – newly legal labor expands the productivity capacity of the economy not only by the net gains of those who employ them but also by the income paid to those individuals (National Academy of Science, 2017).
The income estimate for successful asylees is based on evidence from Mexico. The record of Mexican immigrants, both legal and illegal, to the USA is among the most studied. Borjas (Reference Borjas2014) depends heavily on evidence from those of Mexican origin. Recent immigration is from those with relatively lower skills. Such immigrants on average earn income at the17th percentile of the U.S. income distribution and may only gradually reduce the gap compared to native-born workers (Borjas & Katz, Reference Borjas, Katz and Borjas2007). For the calibration year of 2017, an initial income per adult of $20,000 (rounded) and annual real growth in income of 1 % are used as the gross income benefit to successful asylees.
The value of increased security for successful asylees who must demonstrate credible fear is based on risk differences in intentional homicide rates between the USA and the country of emigration and the VSL. Data from the United Nations (UN, 2021) are used to compute the difference in the homicide per capita rate in Mexico and the Northern Triangle countries of Guatemala, El Salvador, and Honduras compared to the USA. In addition to the improvement in average security (reduced risk), a near arbitrary “credible fear” multiplier is used to increase the security improvement. This analysis uses a baseline multiplier of 3 meaning that those demonstrating credible fear for asylum have 3 times the average exposure to intentional homicide in their home country, but far short of the maximum multiplierFootnote 3. A VSL can then be used to value that change in risk. As legal asylees, an estimated U.S. VSL of $10 million based on meta-analysis data in Viscusi and Masterman (Reference Viscusi and Masterman2017) and reviews in Boardman et al. (Reference Boardman, Greenberg, Vining and Weimer2018) is used to value the estimated change in mortality risk rates. This leads to a rounded annual security benefit of $12,000 per successful asylee that includes the credible fear multiplier and persists over time.
4.1.3. Minor asylum seekers or unaccompanied children
Management of children is one of the most controversial decisions at the border. In general, children are treated under official and complex humanitarian protocols with policies that have changed over time (DHS, 2020 and earlier years). One classification with children is called a FU in which a child under 18 is accompanied by a parent or a legal guardian. Children are generally not separated from at least one parent in this situation and an asylum process usually proceeds, with a low rate of granting asylum. Another classification is UAMs (or Child). Unaccompanied children less than 18 may in fact arrive unaccompanied. Other children of any age may have arrived with an adult but were separated due to a failure of the adult to establish parenthood or legal guardianship, or if the adult has a criminal record or from varying policy implementation. Although most popular and statistical attention is paid to those reported by the BP and arriving between POEs, about one-third in these categories arrive at POEs and are tabulated by the OFO (GAO, 2020). UAMs are remanded to the Department of Health and Human Services for housing until relatives, family, or other housing is found. They must in general still go through the asylum process.
Valuing outcomes for UAMs is highly uncertain. Those outcomes here involve detention, separation, and aging until employment. Different approaches were taken here for minors less than 15 and those between 15 and 18 who are granted asylum (the average age in 2017 was about 14). Children in a FU (with parent or guardian) are assumed to have the same success rate at receiving asylum as adults and if granted asylum begin work starting at age 18. Unaccompanied teenagers 15 or over are assumed to be avoiding a year of child maltreatment elsewhere, a benefit, if they are accorded asylum as they must establish credible fear, and to begin earning income at age 18 as an adult. Child maltreatment is valued at the U.S. rate as a successful asylee is evaluated on a U.S. basis (Miller et al., Reference Miller, Cohen, Swedler, Ali and Hendrie2021). Unaccompanied children less than 15 are assumed to incur a cost equal to an event of child maltreatment due to separation (Bouza et al., Reference Bouza, Camacho-Thompson, Carlo, Franco, García Coll, Halgunseth, Marks, Stein, Suárez-Orozco and White2018) and to start work at age 18. Detention costs are included for all in this category, but for those who are not granted asylum, their own costs and benefits do not have standing although they may have certain rights.
4.1.4. Fiscal costs and net receipts from illegal immigrants
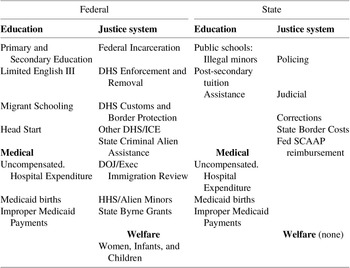
Much attention on illegal immigration is devoted to costs paid by U.S. taxpayers on behalf of illegal residents through their use of the health care, education, and justice systems, and so on (Karoly & Perez-Arce, Reference Karoly and Perez-Arce2016; FAIR, Reference O’Brien, Raley and Martin2017; National Academy of Science, 2017). This study uses data from the 2017 edition of a periodic report prepared by the Federation for American Immigration Reform (FAIR, Reference O’Brien, Raley and Martin2017), a group that seeks to tighten immigration. The FAIR report is a relatively thorough compendium of the individual components of Federal, State, and Local expenditures from public documents resulting from the presence of about 12 million illegal immigrants in the USA. The categories are reasonably consistent with Karoly and Perez-Arce (Reference Karoly and Perez-Arce2016). FAIR reports they are unable to estimate some costs such as fraudulent access to programs intended to be limited to U.S. citizens or residents. Their report has been criticized for various assumptions (Nowrasteh, Reference Nowrasteh2017). This analysis makes some adjustment to the FAIR estimates, the primary one is excluding their estimated costs associated with children born in the USA to illegal immigrant parents. These children are U.S. citizen by law and so have standing in this BCA. Consequently, fiscal costs to support this group are transfers from U.S. taxpayers to other U.S. citizens with the usual BCA outcome of a zero net effectFootnote 4. With that exclusion, cost estimates from FAIR are included from the categories listed in Table 3 below and for which more detail is available in the cited report.
FAIR fiscal categories excluding U.S.-born children.

FAIR cost estimates most directly associated with border management were computed per person attempting to cross the border or an appropriate sub-population. In particular:
-
• average border control cost – CBP (excluding Customs) per illegal crossing attempted. This is the base per-person cost for all managed outcomes except those granted asylum for whom this is a transfer. Some outcomes, such as criminals and children, have higher costs based on special conditions or longer detention time. These per-person costs range from about $9000 to $27,000. No such cost is recorded for the un-managed residual individuals.
-
• average child management cost – -the HHS/Alien Minor program that houses and manages children in the asylum process per annual child entering the program (FAIR, p. 17). This was part of the per-person cost for unsuccessful child asylees.
-
• average asylum judicial process – a portion of the DOJ Executive Office of Immigration budget per total number of asylees. This is part of the per-person cost for unsuccessful asylees and assumes the office operates at a steady state although a significant backlog exists.
Costs most associated with the total (cumulative) illegal immigrant population who get away into the interior were analyzed separately using the estimated total (cumulative) population of illegal immigrants in the country (DHS, 2018). These are primarily the FAIR costs associated with government expenses in the interior of the USA and are a cost for an unmanaged individual, a benefit for a removed individual, and is zero for a legal asylee since it is a transfer in the latter case. These costs were used, for example, as a cost of a Get Away into the country or as one benefit from removing an illegal migrant.
Illegal immigrants also generate positive tax receipts. FAIR reports these primarily as income, sales, Social Security, and Medicare taxes when they are collected. These tax receipts are a cost item for those removed (a loss of tax revenue), and a benefit from a legal asylee and from an unmanaged entry into the interior.
4.1.5. Costs and duration of criminality
A small proportion of enforcement actions are identified as criminals by DHS, and the same proportion is assumed to be a part of Turn Backs and Get Aways. Identification of an illegal immigrant “criminal” can be complex and reporting varies across components of DHS involved in the detention and removal process. Here, the definition of criminal is based on a prior conviction and not a “pending” or “no known” criminal charge (DHS/CBP Enforcement Statistics, 2018). Nonetheless, a large proportion of these prior convictions result from immigration cases with a restriction on illegally retrying to enter the country (DHS/BP Non-citizen Criminal Statistics, 2018). The exact proportion is not known due to multiple criminal counts for many cases.
For the purposes of this forward-looking analysis, the concern is what crimes might be committed and costs incurred if a criminal individual gets into the country illegally or its inverse, the benefit from crimes prevented if they are barred from entryFootnote 5. The first element is a residual cost, and the second is a managed benefit. Costs of criminal events are highly variable, and the benefit–cost literature tends to develop costs based on the type of crime (Boardman et al., Reference Boardman, Greenberg, Vining and Weimer2018). For instance, this analysis estimates the initial year cost of an illegal but non-criminal Get Away at about $5,000 putting the first-year cost about equivalent to that of a Police Reported Burglary (Cohen & Piquero, Reference Cohen and Piquero2009; Miller et al., Reference Miller, Cohen, Swedler, Ali and Hendrie2021). However, a second literature exists on the costs of a lifetime criminal who may engage over time in a variety of criminal activity from low cost to high cost (Cohen & Piquero, Reference Cohen and Piquero2009). The approach used here for the most likely value is based on the prior conviction record of those apprehended at the border (ICE, 2019). Essentially, if a criminal gets away into the USA, they are assumed to duplicate their prior career, with an empirical multiple for estimated crimes that did not result in convictions (Cohen & Piquero, Reference Cohen and Piquero2009). The average multiplier for non-homicide crimes from three surveys reported in Cohen and Piquero (Reference Cohen and Piquero2009) is usedFootnote 6. Each crime type is valued at the U.S. value with categories approximating the 29 conviction types reported by ICE (Miller et al., Reference Miller, Cohen, Swedler, Ali and Hendrie2021). Crimes are assumed to be spread out over 10 years and a PV computedFootnote 7. The prior convictions approach leads to lower criminal costs than the lifetime criminal approach. The latter is used as a high value in a later sensitivity analysis.
4.1.6. Deterrence
At-border and distant deterrence effects are an important but difficult to quantify element of border management. They play a role in this analysis as a function of those managed but was also used as part of computing the total number of border crossing attempts for the without-policy baseline.
At or near border deterrence: CBP explicitly incorporates concern for deterrence into their policy which adjusts probability and consequences to deter various types of illegal activity (DHS, 2019a; Border Patrol, 1994). There is evidence of displacement of border-crossing effort (Hoekstra & Orozco-Aleman, Reference Hoekstra and Orozco-Aleman2017; Bansak et al., Reference Bansak, Blanco and Coon2022) and some evidence related to spatial probability and consequence (Bazzi et al., Reference Bazzi, Hanson, John, Roberts and Whitley2021). CBP reports varying annual rates of re-apprehension given the type of punishment. CBP further reports one measure of deterrence based on surveys conducted in Northern Mexico that asks about expectations to attempt to re-enter the USA. While variations exist depending on when the survey is taken and the time period that is being questioned, about one-third of those removed to Northern Mexico planned to attempt re-entry within 90 days in 2017 (DHS, 2019). This effect is modeled in the first year as a lack-of-deterrence in that a full year’s benefit of removal is first estimated for two-thirds of those removed but the remaining one-third are credited with only 3 months of avoided costs. When the analysis is extended for the PV analysis, the result is that in each future year only about 75 % of the potential benefit is achieved when a non-criminal person is removed at the border. A much more skeptical analysis of deterrence by Massey et al. (Reference Massey, Durand and Pren2016)) still estimates decreased probability of successful entry into the USA in the later years of their data. The time path of outcomes for a criminal is assumed to be different. A criminal removed is always assumed to retry after the first year but is entirely deterred for the first year while a criminal Turn Back is assumed to retry almost immediatelyFootnote 8. Results reported as “Direct” include this retry or limited border deterrence effect where appropriate.
Distant deterrence: A separate deterrence effect is one that keeps individuals from ever leaving their home locations that can be interpreted as general deterrence (Nagin, Reference Nagin and Tonry2013). This effect may result from increased real or perceived probability of apprehension, expected consequences if caught at the border, or other factors that shift incentives such as relative improvements in conditions in the home country. Nagin (Reference Nagin and Tonry2013) discusses the challenges to identify such deterrence in the broader context of illegal activity. In the current study, an econometric analysis by Roberts (Reference Roberts2017) is used to estimate the effect of border management on deterring illegal border crossing at a distance. His analysis uses a time series of survey data on Mexican migration decisions, data on U.S. enforcement involving both probability and consequence, economic conditions, an index for potential illegal entry, and geographic and socioeconomic control variables. Instruments are used for U.S. enforcement effort. Roberts estimates that illegal attempts from working age, male Mexican nationals would have been about 50 % higher in 2015 without the border management policy of the time. When adjusted here for the assumed causes of the deterrence – removal or death – the adjusted estimate is about 0.9 males deterred per person removed or turned-back.
Further, the deterrent effect of probability and consequences on those from other countries, other ages, genders, and purposes is unknown. These other groups are assumed to be more difficult to deter such that the overall deterrence effect is adjusted to one-half that estimated for Mexican males. The result is an estimate that about 0.45 of a person is deterred in their home country per removed, permanently turned back, or border death in the USA. That distant deterrence is valued as the border control and interior fiscal costs avoided and do not include any illegal activity. The magnitude of the effect is significant but not dramatic, valued at about $7500 in additional benefits per removal although the benefits do not persist over time unless border removals continue. An analysis by Massey et al. (Reference Massey, Durand and Pren2016)) also has components of distant deterrence within Mexico, albeit with substantially less econometric control for enforcementFootnote 9. Their overall conclusion of essentially little or no distant deterrence is evaluated by presenting sensitivity results with and without distant deterrence, which is also a part of a later scenario analysis.
4.1.7. Valuing the statistical life of foreigners
Perhaps the most controversial aspect of standing is valuing the statistical life of those who die having illegally crossed into the USA, an outcome that happens hundreds of times each year. They are not citizens and are carrying out an illegal activity. The valuation usually accorded mortality in BCAs, the VSL, would not be included due to lack of standing and so could result in a value of zero for lives lost. However, DHS spends a modest but observable sum to rescue border crossers in dire trouble (DHS/BP, 2016) indicating that the U.S. value for lost foreign and here illegal lives is not zero. Nor do surveys indicate that U.S. citizens value foreign lives at zero (Dana, Reference Dana2009). This analysis follows an increasing concern that values for another’s well-being are sometimes legitimate to include in BCAs. The value to be included for a lost foreign life on U.S. soil is based on an observable trail of funding from U.S. citizens through U.S. Government aid to impute values for the lives of foreign individuals. Kopczuk et al. (Reference Kopczuk, Slemrod and Yitzhaki2005)) quantitatively estimate how the U.S. Government implicitly values the lives of foreigners through its pattern of foreign aid and the varying conditions, including mortality, around the world. Values for foreigners from Mexico, Central, and South America (most of the population of concern) are less than 10 % of the value that the USA places on its own citizens as identified above. The proportional value estimated by Kopczuk, Slemrod, and Yitzhaki for U.S. citizens to reduce mortality for Mexican citizens, 6.84 % or $684,000, is used here as a central measure. This estimate is a useful topic for later sensitivity analysis while noting that the central value is larger than some estimates of foreigner’s own VSL.
4.1.8. Impact on U.S. labor market, company owners, and consumers
A channel of potential multi-market effect is through the impact of migration on the labor market. The effect of illegal immigrants on wages in the aggregate labor market is thought to be close to zero (NAS, 2017). That result masks an uncertain negative effect, here estimated at 1.9 % in the base case, on U.S. native-born workers with a high school education or less and slight positive effects on other workers (Borjas & Katz, Reference Borjas, Katz and Borjas2007; Borjas, Reference Borjas2014; Karoly & Perez-Arce, Reference Karoly and Perez-Arce2016; National Academy of Science, 2017). This analysis carries through, on a per-person basis, the gain or loss in income to native-born workers with high school or less education resulting from the various outcomes. For instance, a removed person has an effect of increasing native-born, less-educated incomes but a legal asylee lowers that income. Income effects from unmanaged individuals are all negative. A somewhat larger gain accrues to consumers and owners of capital (Borjas, Reference Borjas2014, p. 163) from lower input costs. A sensitivity analysis sets all these effects equal to zero that is consistent with some analyses in the literature (NAS, 2017). The counterbalancing labor market and output market effects have little overall effect on the primary results, although they point to important distributional aspects of illegal immigrationFootnote 10.
4.1.9. Equity distributional adjustment/Welfare weighting
The Biden Administration seeks implementable methods to include “equity” or “distributional weighting” into government decisions (White House, 2021). Equity is incorporated here as a sensitivity analysis of the base case. While there can be many dimensions to equity, this analysis weights individual benefits and costs for differences in income rather than population characteristics such as race. The welfare weights used increase benefits or costs for those in the lower part of the income distribution and reduce benefits or costs for those in the upper part of the distribution. The weights applied are those consistent with the income elasticity of the VSL and policy pronouncement of the DHS keeping the VSL constant for policy purposes (Farrow, Reference Farrow2011; Farrow, Reference Farrow2021). The implication of holding the VSL constant can imply a weight of 2.1 for the lower quintile and 0.75 for the upper quintile and 1 for all others instead of an arbitrary weighting approach. The weights are applied here only to income flows to low-income legal immigrants and native-born workers in the USA (increased weights) and to owners of capital (reduced weights). The issue of state-based equity, considering that the southwest border states likely bear a large proportion of the impacts, is not addressed here. For instance, the fiscal and environmental burden during an initial period may be largest in a border state while the benefits of legal asylees may be more diffuse as further internal U.S. migration occurs.
4.1.10. Timing and duration for present value
Numerous impacts have a time dimension. For the impact duration of illegal immigrants, DHS estimates the time in residence of the unauthorized immigrant population (DHS, 2018). At any given point in time, unauthorized immigrants have been resident for varying periods of time. Usual BCA practice is to include a modal value. The median duration (50th percentile) is between 16 and 20 years, but that median is changing over time compared to 2007 (DHS, 2018). Legal asylees may also have an impact that extends across generations and that gets increasingly uncertain and difficult to model. For the purposes of this analysis, a maximum of 20-year duration of impact is used in the PV analysis of a single year’s cohort for those impacts that persist. Note that analyzing a technology that has a life cycle of 20 years implies a forecast impact 40 years into the future based on 20 individual annual cohorts.
Further, the duration of any specific outcome may vary. The initiating phase of many effects, the direct impacts, occurs in an initial time period and some, but not all, persist depending on the outcome or impact category. For instance, the benefit–cost (BC) categories of Border Expenditures and the impact of Criminal Removal are assumed to only exist for the first year and do not persist. The BC category of security benefits for successful asylees and the impact of those who Get Away persist at a steady level for 20 years. Another example is that the income of adult and child successful asylees increases over time, but children begin earning at a later date as they reach age 18.
The PV over time of each impact is based on standard discounting using a real discount rate of 3 %, one of the currently recommended rates for U.S. government BCAs (OMB, 2003).
4.2. Per person, conditional outcome values
After quantifying monetary impacts as above for individual impact categories for each outcome (identified later in Table 8 plus an equity impact), the categories are summed to compute the conditional per-person point estimate for each outcomeFootnote 11.
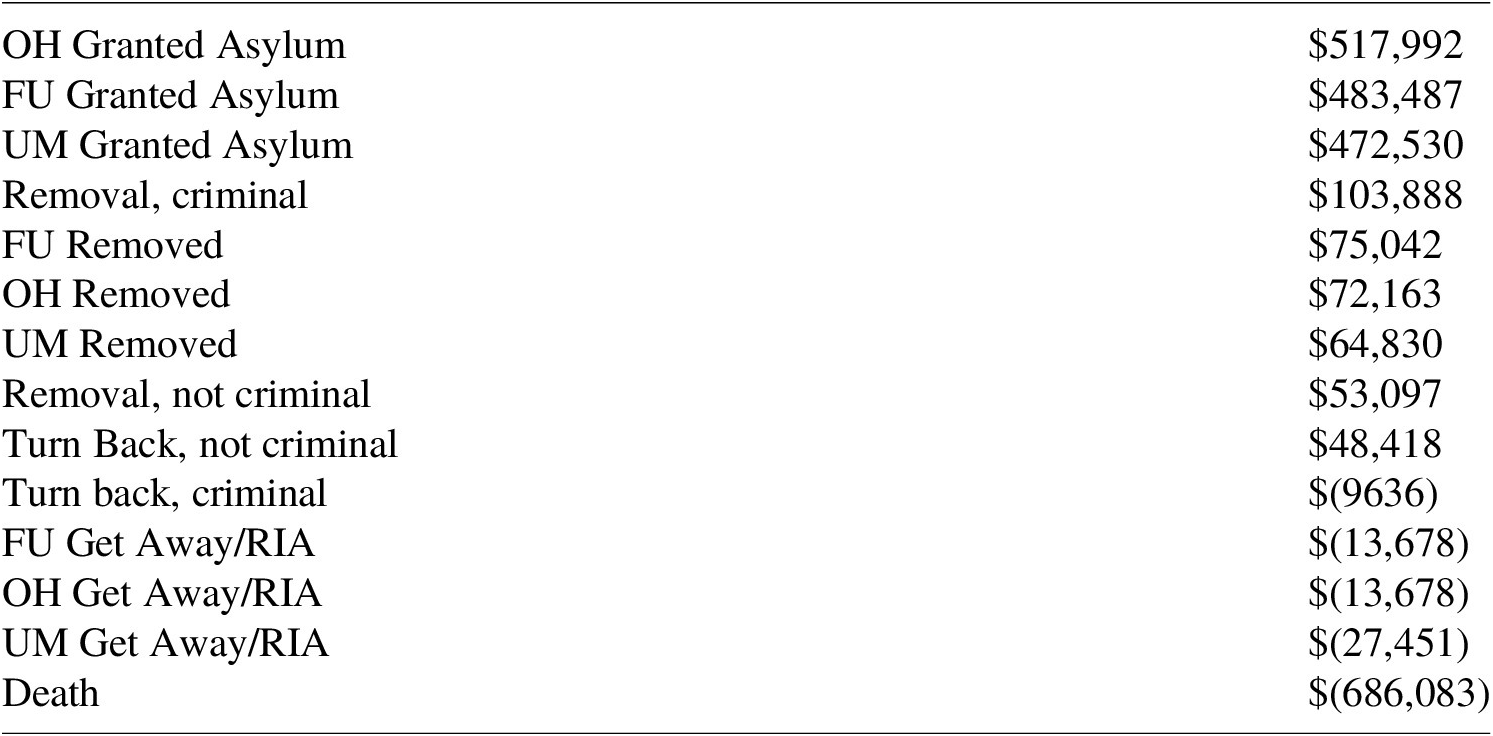
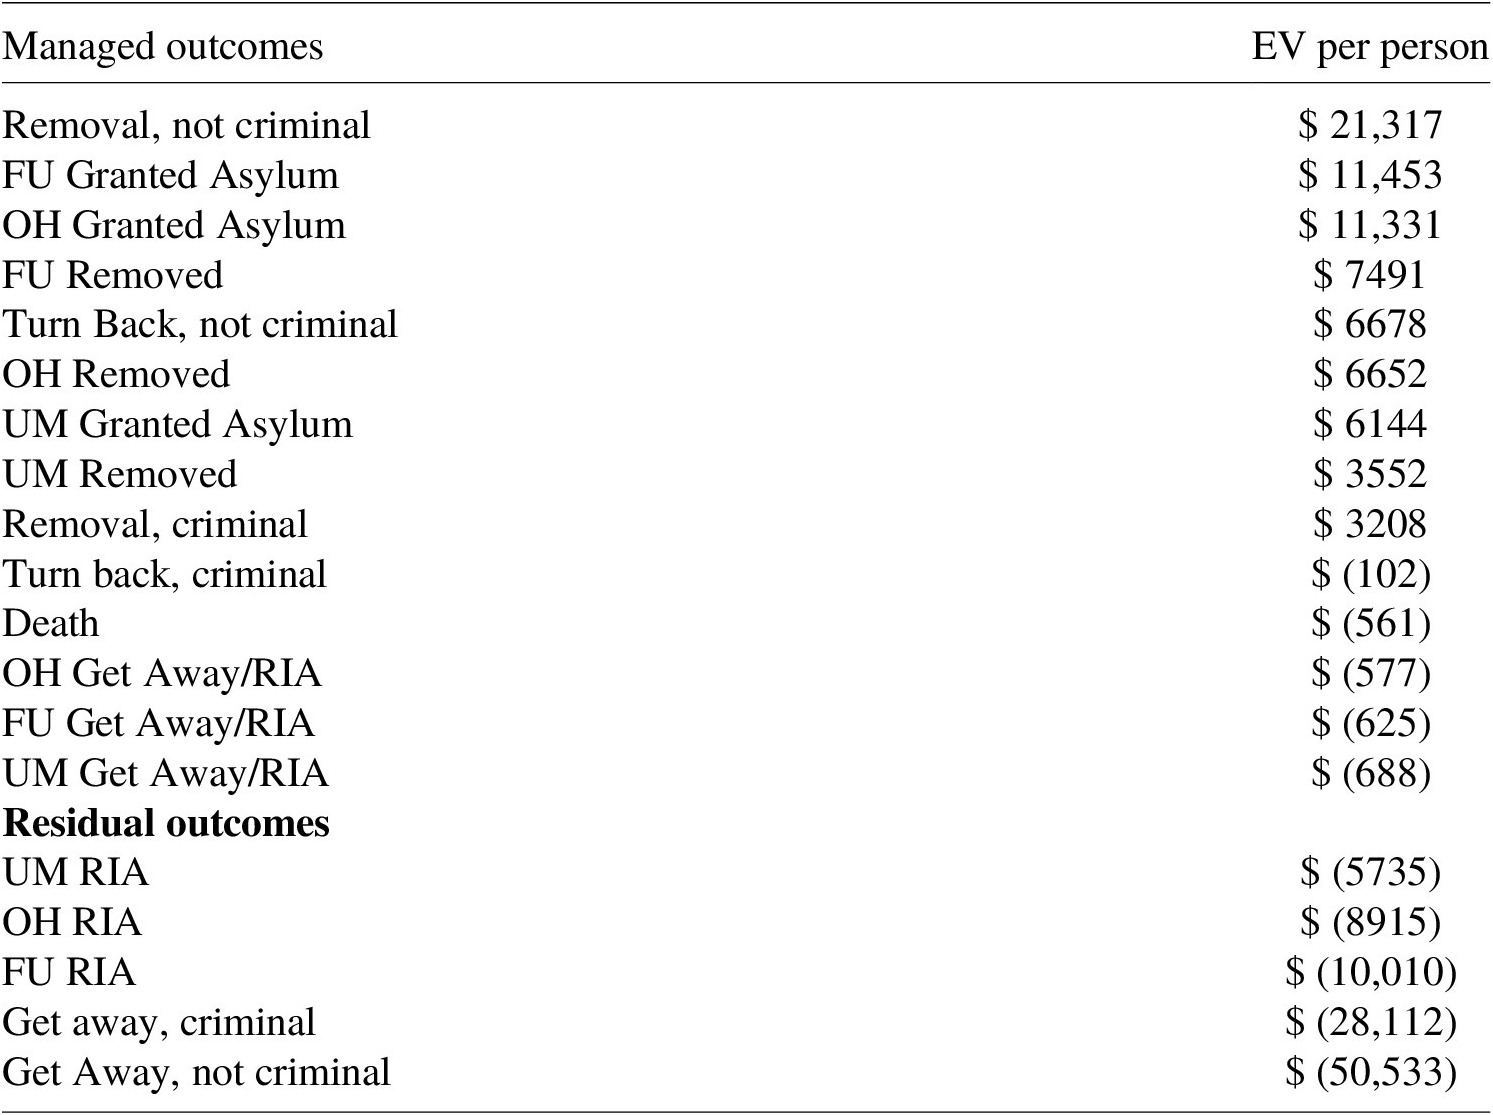
The conditional values reported in Table 4 are the base analysis that includes direct effects, distant deterrence, and multi-labor market effects but exclude equity weighting. These are also new “shadow prices” (Boardman et al., Reference Boardman, Greenberg, Vining and Weimer2018) for the value of the identified outcome. The values are the PV per person for the year of attempted entry and for impacts as described up to 20 years thereafter. The values are arranged in descending order of costs and benefits. For instance, if a person is a successful Other Humanitarian asylee (OH, not FU or UAM), the value is about $518,000 of positive, PV net benefits over 20 yearsFootnote 12. In contrast, an OH who is RIA after entering the asylum process results in managed costs of about $14,000 and residual costs (see Table 5) of about $78,000. Anticipating later results, the total PV net benefits of a technology can be estimated by multiplying the unit values in Table 4 by the total number of outcomes in each category, or the expected value can be computed by multiplying the total (sum) expected value per managed person by the total number of managed attempts.
Ranked, point estimates of conditional PV per managed person.

Residual, ranked conditional PV per person.

The conditional values for the residual cost outcomes are presented in Table 5. By far the largest residual conditional cost outcome is a criminal Get Away, estimated to cost about $565,000, who is assumed to continue a criminal career for years as discussed above in addition to Federal, State, and Local costs incurred and a variety of tax receipts as estimated by FAIR. A non-criminal Get Away and the Humanitarian Get Away categories appear in both Tables 4 and 5 as there is some management cost for these individuals with the current technology, but if they Get Away, they cause additional residual social costs. The conditional values of these outcomes are in the neighborhood of $80,000 and differ slightly due to varying estimates of income and sales tax generated.
5. Results: Total expected net PV and its decomposition
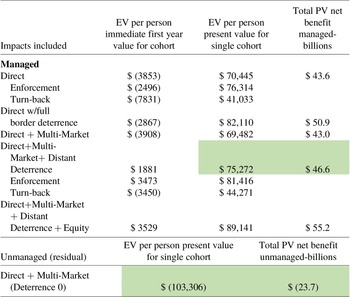
Alternative models of increasing scope are presented below in Table 6 that depend on including various individual components. Several decompositions of the total are also presented. Each row identifies the impacts that are included in the metric starting with the most restrictive, the Direct impacts, and adding additional elements with the complete set including multi-market, distant deterrence, and equity elementsFootnote 13. The highlighted metric that includes Direct, Multi-Market, and Distant Deterrence is referred to as the base case unless otherwise identified. The expected values are taken across the entire set of managed outcomes and their conditional values. In the base case, the point estimate of the immediate (first year) expected value is $1881 per person. The PV per person is much higher, $75,272. Also reported for some results are the intermediate elements of the expected value of enforcement outcomes and the expected value of Turn Backs.
Summary of expected value per person and total value.

Several insights emerge from the per person results in Table 6:
-
1. Scale: The per-person, expected PV Direct effect (with less than full border deterrence) is relatively large, about $70,000.
-
2. First year versus PV: The first year compared to the PV results changes substantially and sometimes changes sign. This shows that multi-year effects are central to understanding border management.
-
3. Near border deterrence: The “retry” effect near the border is significant as the PV would be about 15 % higher, about $82,000, if there were full border deterrence.
-
4. Adding multi-market effects: The income gains of relatively unskilled native workers from removals are outweighed by the losses of owners of capital and consumer although the aggregate impact is relatively small, a reduction to about $69,000. These results highlight distributional impacts within the aggregate.
-
5. Adding distant deterrence changes the sign of the immediate impact from negative to positive and improves the PV by about 8 % compared to the multi-market model. The relatively larger effect in the short run is because “deterrence” is a single year effect that must be repeated each year.
-
6. Equity weighting: Weighting leads to the largest shift in the PV numbers among the metrics, a gain in PV per person of about 18 %.
-
7. Unmanaged or residual per-person expected value: The cost per unmanaged person is substantial and larger on a per-person basis that for managed people.
-
8. Total (aggregate) preferred expected value: A positive $46.6 billion net benefit for a single year cohort of managed individuals and a negative $23.7 billion net cost for the unmanaged cohort.
5.1. Decomposition: Outcomes
The results presented in Table 6 aggregate impacts over outcomes. Table 7 ranks the individual outcomes by their EV per person for the base case, the conditional value times its probability. Hence, a large conditional outcome value can be small in expected value due to low probability (e.g., death), or a modest conditional value can be large if associated with high probability (e.g., removal of a non-criminal). The sum of these expected values is $75,272 as reported in Table 6. The residual EVs at the bottom of the table have similar expected value logic; the largest expected value cost is for a non-criminal Get Away as that has a high probability even if a medium conditional valueFootnote 14. The sum of the residual expected values is -$103,306 as reported in Table 6.
Ranked expected value by outcome per person, 2017.

5.2. Total value of the managed and unmanaged
Results that aggregate from the per-person results of Table 6 can be informative for investment decisions. Calibrating to the year 2017, with about 620,000 cases managed in the base case and about $75,000 in expected value per person, yields annual expected net present value (AENPV) benefits of $46.6 billion as reported in Table 6. Incorporating equity effects yields AENPV benefits of $55.2 billion.
For comparison, the AENPV for a 1-year cohort of the unmanaged (residual) cases is -$23.7 billion, 51 % in absolute value of the size of the net benefits of the managed casesFootnote 15. Like residual pollution, these results quantify the substantial costs that a new policy might avoid and hence be potentially recorded as benefits.
It is worth noting that the net PV of one annual cohort does not represent the value over the lifetime of a technology. There are likely multiple annual cohorts affected by a new technology. For example, the lifetime of the technology might be 20 or more years, for other technologies a shorter time. While there are alternatives on how to treat salvage value beyond an illustrative 20 years, if one truncates the net benefits of late cohorts that extend beyond 20 years, it can be shown that the resulting 20-year PV is about 9.5 times the initial, single year PV. A different approach is to include the entire future value that would lead to a higher life-cycle value. These technological lifetime impacts are not included here but would be important in assessing specific policy proposals involving long-term infrastructure.
5.3. Decomposition: Benefit and cost categories
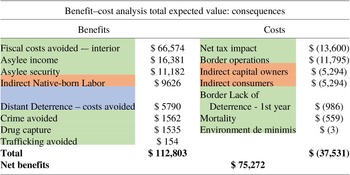
Presenting results in a BCA format provides complementary information on the value of impact categories and their importance. Aggregating results for each impact rather than output for the base metric (Direct, Multi-Market, and Deterrence) yields the values and identifies the specific benefit and cost categories in Table 8 (without the equity adjustment). The bottom-line expected net benefit per person is exactly equal to the outcome-based value from Table 6; $75,272. This value, when multiplied by the number of managed attempts, yields the same Total Net Benefit as previously of $46.6 billion.
BCA format of results by impact category, per person expected PV.

This alternative breakdown informs some of the more contentious debates surrounding border management and more clearly defines the metrics in Table 6. Green cells are recorded as the Direct effects, orange cells are the multi-market effects, and the blue cell is the Distant Deterrence. On the benefits side, the largest benefit category is avoided Federal, State, and Local fiscal costs. The next largest benefit accrues to successful asylees based on their income and improved security. The indirect effect on native-born unskilled labor resulting from removing potential immigrant labor is also a significant benefit while drug and human trafficking benefits are relatively small in expected value. Distant deterrence is a mid-sized benefit. Total expected benefits per person are about $113,000.
Regarding costs, the PV of taxes lost is the largest cost item, an offsetting item to the benefits from fiscal costs avoided. The costs of border operations and processing are somewhat smaller. Also, somewhat larger than the benefits to native-born labor from managing the border are the indirect costs to owners of capital and consumers whose costs are higher with less immigrant labor. The equality of these two indirect effects is by assumption of relative supply and demand elasticities that define the incidence of price changes. The near border (lack of) deterrence cost reports only the first-year adjustment to benefits, later year effects lower the PV of other impacts, such as fiscal costs avoidedFootnote 16.
The expected mortality costs of those trying to cross the border are relatively small, in part due to the low probability but also the lower valuation placed on foreign rather than U.S. lives. Finally, environmental costs appear small, primarily due to the limited impact that is included, only that of trash along migrant trails in the USA. However, some technologies may have a larger environmental impact, such as building a wall, and so this category remains as a potentially important placeholder. Total costs per person are about $38,000 leading to net benefits of the current system of $75,272: the same as the outcome-based DA result.
6. Sensitivity/uncertainty and accuracy
The previous results are subject to many types of uncertainty. There are individually uncertain parameters, uncertain sets of the parameters, and the model may incompletely capture the full border management context. This section investigates: (1) scope (category) sensitivity, (2) selected individual parameter uncertainty, (3) scenario uncertainty affecting multiple variables, and (4) simulation of aggregate uncertainty. Consequently, the focus of the uncertainty analysis is on parameters affecting the value estimates. These explorations suggest caution in the use of exact values, although the qualitative results are not changed.
6.1. Scope sensitivity
The summary results of Table 6 present the sensitivity of the per-person expected value based on additional impacts, some of which are controversial. One can immediately infer the impact of excluding impact categories based on differences in the results. As an example, the core Direct analysis includes less than full near border deterrence for non-criminal removals and Turn Backs. If there were full local deterrence for these outcomes (no retries), the per-person value would increase significantly to about $82,000. Consequently, the core Direct model result effectively includes a 15 % reduction due to non-criminal retries. As another example, spatial labor market studies tend to suggest that the labor component of multi-market effects is closer to zero instead of the negative effects of immigrant labor estimated here (NAS, 2017Footnote 17). Including the labor market effects reduced the per-person PV by $963, about 1.3 % of the initial value. This effect is the sum of a positive effect on the income of lower educated and a negative effect on owners of capital and consumers due to higher input prices so that on net, the multi-market effect was slightly negative. As a sensitivity test, if the labor market effect is zero, then the combined effect is zero and the per-person value reverts to that of the direct effects only. Similar bounding analyses can be done for other components of Table 6.
6.2. Individual parameter sensitivity
The expected values of outcomes in Table 7 provide the sensitivity of the result from a proportional change in each value (say due to mismeasurement) due to homogeneity of degree one of the expected value equation. An equi-proportional change in all the values would retain the same ranking as in the table but change each value by the proportional amount.
A more detailed sensitivity is based on seven factors of mortality, crime, asylee income and security, and fiscal cost along with the two deterrence factors. These seven values are all uncertain and each is a function of a key parameter for that value even if it affects multiple impacts.
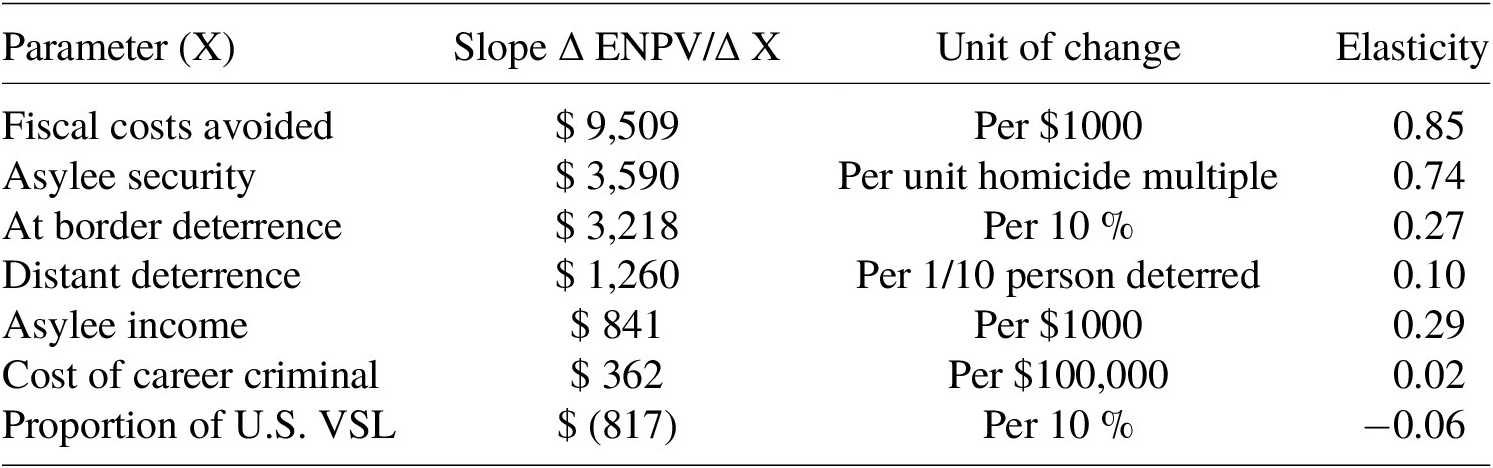
The incremental uncertain effect for each variable is investigated by computing the slope and the elasticity of the aggregate EPV in the neighborhood of the base case valueFootnote 18. Table 9 presents these slopes and their units, each of which is approximately linear in the range studied, and the (arc) elasticity.
Sensitivity of EPV to parameters of highest value metrics.

The EPV per-person results are most sensitive to the fiscal costs avoided that can occur over a period of years. If such annual costs increase by $1000 (from a base of $6800), then the EPV increases by $9509 and vice versa for reduced fiscal costs. Asylee security, the second largest slope, depends importantly on the comparative intentional homicide rate between the home country and the USA and a resulting multiplier. If the multiplier increases by 1 from a base of 3, then the EPV per person goes up by $3590 primarily because security benefits accrue over time. Asylee income is an important determinant of benefits because it also continues and grows slightly over the 20-year time horizon. The base case income is about $20,000 per year. The estimated slope is $841 per increase of $1,000 in asylee annual income. The slope for income implies an equivalency of about $4000 in annual income to a unit change in the security multiplier. The two deterrence, at border and distant, are relatively large. The base at border deterrence for non-criminal return or removal is a 66 % chance the person will not try to re-enter in the next quarter year. The slope of $3,218 is the increase should deterrence increase to 76 %. Distant deterrence is measured by 0.1 persons deterred from a base case value of 0.46. The slope of $1260 is the change from, for instance, an increase in deterrence to 0.56 persons. The costs of a career criminal are large and uncertain. The slope per $100,000 in cost of a criminal career is $362 with an elasticity of 0.02, relatively small given the small proportion of criminals. The final sensitivity is the U.S. citizen and resident VSL for an initially illegal foreign national (see Section 4.2). The base case uses a value of about 7 % of the value of a U.S. citizen. The estimated slope indicates that for each 10% increase in the proportion of a U.S. VSL, for example, from 0.07 to 0.17, then the aggregate EPV decreases by $817. If the U.S. VSL is used as a cost for mortality (changing from 0.07 to 1), then the aggregate EPV decreases by about 10 % as the EPV per person would be about $67,000.
All elasticities are less than unitary, meaning that the EPV changes by less than 1 % for a 1 % change in the variable. However, there remains large variation among the parameters in part due to the probabilities affecting the expected value. For instance, the fiscal costs avoided enter many outcomes while the cost of a career criminal affects a limited number of outcomes even though its conditional effect is large.
6.3. Scenarios and macro-simulation
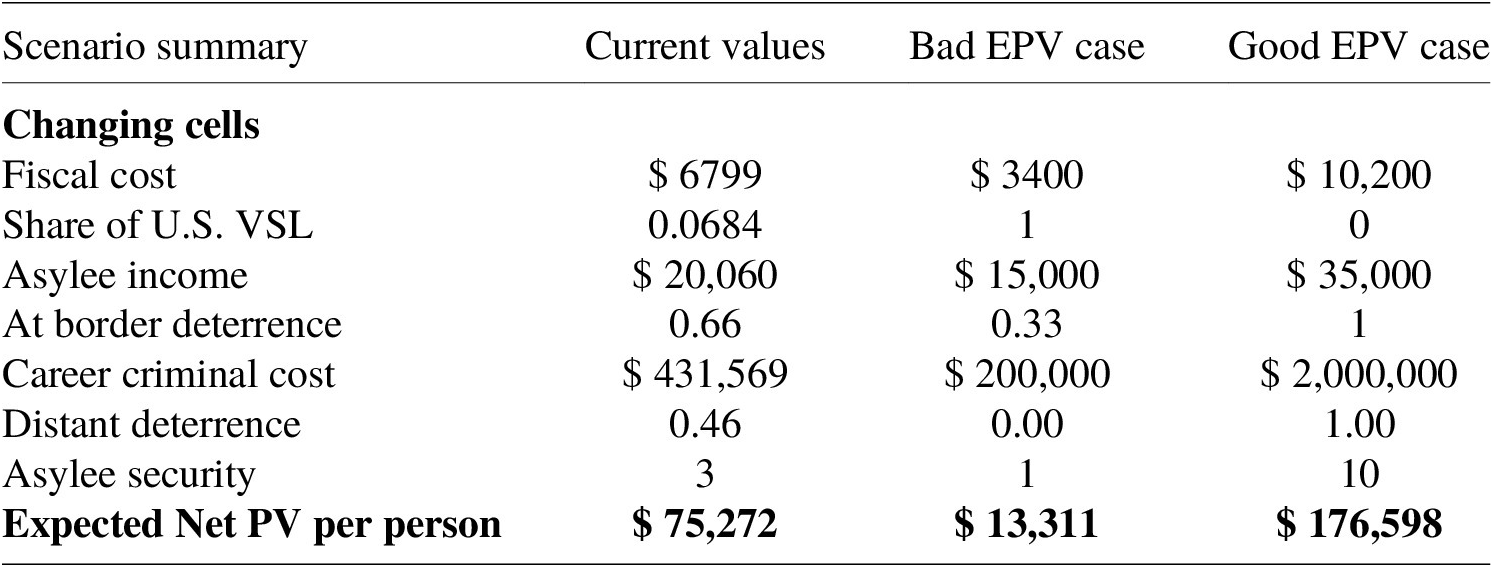
Many variables can be simultaneously uncertain. A common approach is to attach a statistical distribution to each uncertain variable and use simulation methods to obtain a distribution for the outcome. That approach is not reasonable at this stage of data availability and model development. Instead, two scenarios representing sets of parameter assumptions are defined as “Bad for EPV” and “Good for EPV” cases. Table 10 focuses on parameters representing the largest impact categories.
Scenarios used to define extreme cases of EPV.

The scenario results indicate that the Bad scenario reduces the per-person EPV by about 82 %, although the metric remains positive. The Good scenario more than doubles the already positive per-person EPV. These results indicate the robustness of the positive EPV finding while providing information about the range of the base case result from parameter uncertainty.
An illustrative distribution for EPV can be derived using a triangular distribution defined by using the point estimate as the most likely value and the two extreme scenario cases as the minimum and maximum (each increased by 5 % to offset behavioral biases and variables not included in the scenarios). The distribution from 10,000 trials of the per-person EPV (not shown) is skewed to the right indicating that parameter values in the Good scenario increase the EPV by more than the Bad scenario decreases it. Consequently, the simulated mean (about $88,000) and median (about $85,000) are larger than the base case point value of $75,272 indicating that the uncertainty captured in the scenarios tends to increase the central tendency of the point estimate. All simulated outcomes were positive.
7. Potential benefits from alternative border management policies
The net benefits of specific policy alternatives or different years can be evaluated by changing the number of people, the proportions, or the values associated with different outcomes. The benefit from differing policies can be illustrated even in the absence of cost information. Such analysis is incomplete, but it can also provide a net benefit break-even value for the implementation cost given a particular impact. While improvements for the managed can increase net benefits, an obvious area for improvements are ways to reduce the residual cost. Of the $23.7 billion in residual cost, $5.7 billion per annual cohort results from RIA outcomes while $18.0 billion results from Get Aways. Further, there is a cumulative population in residence.
Five potential policies are used to illustrate the use of the BCA information without exhausting the many possibilities. Evaluations based on new actions at the border are (1) increased apprehensions, (2) reduced deaths, and (3) reduced Remove in Absentia. Evaluations based on interior actions are (1) interior removals and (2) amnesty.
7.1. Increased apprehensions at the border
Increased apprehensions might occur from improved monitoring and assignment technologies at the border, more human or physical assets, or differing conditions that increase the number of attempts. The per-person net benefit from Table 6 can be immediately applied to estimate the potential benefit. If an average group of 25,000 more people were apprehended, about 15 % of those getting away in 2017, then the 1-year cohort PV net benefit is $1.9 billion. If the lifetime of the technology used to increase the apprehensions is 20 years, then the PV is $28.0 billionFootnote 19. Greater apprehensions would increase these values linearly. This illustrates the potential for further government investments but is not a net benefit measure as new implementation costs are not included.
7.2. Reduced deaths
The per death avoided conditional value from Table 4 of $686,083 can be used directly as a benefit per death avoided. That value includes some deterrence effect and existing costs to DHS. A new technology or policy that reduces deaths by 20 % (about 100 deaths) yields a single year benefit of $69 million and a 20-year lifetime benefit of $1.0 billion. An increase in deaths has the opposite sign. This estimated benefit does not include the cost of any new policy.
7.3. Reduced remove in absentia
If a policy manages people at the border in a way that reduces the Remove in Absentia portion of asylum seekers, then additional benefits would result. The changes in net benefits from converting an RIA into a successful asylee or into a removal were constructed using the conditional values of Table 4 Footnote 20. A weighted average based on the success rate of becoming a legal asylee is an EPV of about $115,000 per person. About 70,000 cases of RIAs occurred in 2017. If a new policy such as faster asylee evaluation at the border reduced RIAs by 20 %, then the net benefits in a single year are $1.6 billion and $23.9 billion over the lifetime of a 20-year technology prior to consideration of costs of implementation. Net benefits increase proportionally with reductions in RIAs. These benefits do not include the cost of any new policy.
7.4. Interior removals
A policy of apprehending and removing Get Aways or RIAs would be evaluated using the residual conditional values of Table 5. Recall that these estimates do not include any value to the individual themselves as they lack standing. The benefit of an interior removal would be the proportion of PV cost that is avoided. For instance, if a criminal is caught in the interior after 3 years (out of 10 for a criminal career), the approximate benefit is the PV difference between the previous full cost and the now truncated cost already occurredFootnote 21. If removed in year 3, the benefit is about $367,000 and increases by $66,000 for each year removed sooner or decreases by that amount for each year later. These benefits do not include the cost of any new policy.
7.5. Amnesty for those in the interior except criminals
In contrast to removing someone from the interior as above, granting amnesty changes the person’s standing. Costs when illegal, such as fiscal costs, are now transfers. Income earned is now a legal benefit given amnesty such that the person is essentially a successful asylee. However, it is unclear if the significant security benefit received by asylees would also be appropriate if amnesty is granted. While assumptions could be changed, a straight-forward valuation would be to use the conditional expected value for a successful asylum seeker from Table 4, times the annual number of people in each get-away/non-criminal and RIA category. The result is $111.3 billion PV net benefits per annual cohort. If amnesty were granted to the 12 million undocumented immigrants estimated to be resident in the USA in 2017, then the benefit (using the adult asylum value) would be $ 6.2 trillion dollars in PV. This latter value would not repeat. Either policy would be a large policy change that may well induce dynamic changes in behavior at the border that are not analyzed here, nor are any costs of implementing an amnesty policy included.
8. Conclusion
The border management cup can be viewed as both half full and half empty. The existing management system, the half full part, is estimated to yield large net benefits on a per-person and total net benefit basis although uncertainty exists. At the same time, there is significant potential to improve net benefits as there are large residual costs. Whether or not an actual new technology can yield positive net benefits depends on its effect on the proportions of outcomes, total number of outcomes, and the cost of the technology or the value of consequences.
Numerous intermediate results appear consistent with expectations. Identifying outcomes, quantifying values, and computing explicit expected values provide new estimates for discussions about border management. For instance, public concern with criminals and asylees – whether minors or adults – and fiscal impacts are all shown to be central elements of the analysis. At the same time, the highest total expected value (outcome) benefit is the “typical” non-criminal removals even though one criminal is much more damaging than one non-criminal. Note that this discussion reports two types of expected values, those associated with outcomes such as the criminal population, and those associated with impact categories, such as fiscal impacts. The DA presentation monetizes the outcomes; the BCA presentation monetizes the impact categories. Both are informative and have the same aggregate expected value.
Structural assumptions regarding who has standing and time duration are central to the analysis. More clearly stated, laws that define legal immigration are the primary determinants of values. For example, fiscal costs, the largest category, would become transfers with no net impact on the bottom line under a different set of immigration and residency laws. However, traditional “crimes” would retain their costly impact. Further examples of the importance of law in defining this analysis are that successful asylees generate substantial benefits by earning income, while Get Away non-criminals create costs by using services over time, but their income is excluded from benefits.
Equal welfare weighting in the base case is revealed as an important assumption. Welfare (equity) weighting substantially increases the EPV although its sign does not change.
There are many suggestions for improvement, which suggests there are weaknesses. The modeled outcomes, processes, and impacts may not be fully consistent with real-world practice as known by subject matter experts within DHS or elsewhere or fully capture the complexity of some debates in the literature. The analysis provides new generalizable approaches in areas such as security benefits, child maltreatment, valuing the lives of foreign nationals, and welfare weighting. Further discussion and investigation on these topics could improve the analysis. The current uncertainty analysis yields insight but could be expanded.
What uses might be made of this analysis? First, there are 16 unique and new shadow prices for use in other studies as reported in Tables 4 and 5. The results quantify and communicate why some types of initially inadmissible individuals are either costly or beneficial. The aggregate results indicate that border management is generating large net benefits for the country, although there are also large residual costs that could be reduced with appropriately targeted investments. The individual outcome and impact information could also inform new policy choices regarding asylees and criminals by using the shadow prices as provided here. The policy examples further illustrate the potential uses of the information.
Acknowledgments
The core of this research was supported by the U.S. Department of Homeland Security (DHS) through the National Center for Risk and Economic Analysis of Threats and Emergencies (CREATE) under Basic Ordering Agreement No. HSHQDC10BOA19. However, any opinions, findings, errors, and conclusions or recommendations in this document are those of the author and do not necessarily reflect views of the DHS or the University of Southern California (USC). Some data corrections and updates have occurred since that contract without significantly changing the results. The original work was not reviewed by DHS. Appreciation is extended to the Landscape project group at CREATE/USC: Detlof von Winterfeldt, Richard John, Adam Rose, Dan Wei and Isaac Maya; to the RESECON internet group for lively feedback on the value of a foreign life, to Bryan Roberts and Lynn Karoly for research suggestions, to Dinah Bear for additional near-border context and data, and to three anonymous referees.
Supplementary Materials
To view supplementary material for this article, please visit http://doi.org/10.1017/bca.2023.2.