1. Introduction
Urban areas suffer from high concentrations of small particulate matter of 2.5 microns or less (PM2.5), mainly due to industrialization, urbanization, population growth, and urban transportation systems (Cheng et al., Reference Cheng, Li and Liu2017). While developed countries have been able to significantly reduce air pollution, efforts made by developing nations, such as South American countries, are far from sufficient for properly dealing with this environmental issue (Cheng et al., Reference Cheng, Luo, Wang, Wang, Sharma, Shimadera, Wang, Bressi, Maura de Miranda, Jiang, Zhou, Fajardo, Yan and Hao2016). The risk to human health due to the lack of proper abatement measures is substantial. The Lancet Commission's 2017 report on pollution and health indicates that PM2.5 caused more than 4 million deaths in 2015, and it is associated with various health problems, such as cardiovascular and pulmonary diseases (Landrigan et al., Reference Landrigan, Fuller, Acosta, Adeyi, Arnold, Basu, Baldé, Bertollini, Bose-O'Reilly, Boufford, Breysse, Chiles, Mahidol, Coll-Seck, Cropper, Fobil, Fuster, Greenstone, Haines, Hanrahan, Hunter, Khare, Krupnick, Lanphear, Lohani, Martin, Mathiasen, McTeer, Murray, Ndahimanjara, Perera, Potočnik, Preker, Ramesh, Rockström, Salinas, Samson, Sandilya, Sly, Smith, Steiner, Steward, Suk, van Schayck, Yadama, Yumkella and Zhong2017). This report also presents new evidence suggesting an association between PM2.5 and children's health problems, such as autism and hyperactivity.
In the Latin American context, Chile stands out because, in 2018, it accounted for 60 per cent of the 15 most polluted regional cities in Latin America and the Caribbean. The highest annual mean PM2.5 levels were found in southern Chilean cities, such as Padre las Casas (43.3 μg/m3), Osorno (38.2 μg/m3), and Coyhaique (34.2 μg/m3) (IQAir, 2018). This result might be associated with – among other things – Chile's permissive national air quality standard, which has established an annual mean PM2.5 concentration threshold of 20 μg/m3 (Ministry of the Environment of Chile, 2011), while the World Health Organization (WHO) recommends an annual mean exposure lower than 10 μg/m3 (WHO, 2016).
Although air pollution seriously affects quality of life in several Latin American countries,Footnote 1 empirical assessments of air pollution's economic impacts are limited and mostly concerned with these countries’ capital cities. For example, among the most recent research are two hedonic analyses for México City performed by Fontenla et al. (Reference Fontenla, Goodwin and Gonzalez2019) and Chakraborti et al. (Reference Chakraborti, Heres and Hernandez2019), as well as one study for Bogota, Colombia, performed by Carriazo and Gomez-Mahecha (Reference Carriazo and Gomez-Mahecha2018). For Chile, there are only a few hedonic studies dating from the 1990s and the first decade of the 2000s and, as in México and Colombia, these mainly focus on specific Chilean communes, such as Santiago (Rogat et al., Reference Rogat, Firinguetti and Figueroa1996), Concepcion, and Talcahuano (Mardones, Reference Mardones2006). More recently, however, scholars began expanding the geographical scope of their research. For example, Lavín et al. (Reference Lavín, Dresdner and Aguilar2011) examine air pollution in 44 communes, while Mendoza et al. (Reference Mendoza, Loyola, Aguilar and Escalante2019), using the life satisfaction approach to compute people's willingness to pay for reduced air pollution in Chile, focus on 70 municipalities.
In this context, the present study aims to estimate the effect of cross-commune PM2.5 concentration on housing rental prices in Chile. To meet this objective, following the precedent of Lavín et al. (Reference Lavín, Dresdner and Aguilar2011), we employ the spatial equilibrium approach (Rosen, Reference Rosen, Mieszkowski and Strashaim1979; Roback, Reference Roback1982) but focus solely on the housing market.Footnote 2 Under this model, the housing market capitalizes site-specific differences on (dis)amenities (e.g., PM2.5); therefore, city differences in housing rental prices – after controlling for structural attributes – reflect site characteristics, which affect the wellbeing of residents. The methodological approach corresponds to the first stage hedonic model which – besides estimating the association between housing values and air pollution – might be used to perform welfare analyses based on marginal changes in PM2.5.
This paper's contribution is twofold. First, in addition to updating the empirical assessment of the effect of PM2.5 on housing rental prices in Chile, this paper expands the geographical scope of the research compared with previous studies, by examining 312 urban communes, representing 87 per cent of all Chilean communes. To accomplish this, we use ordinary kriging to predict PM2.5 concentration in communes without a monitoring station. Though spatial interpolation is most commonly used to predict within-city levels of air pollution, some researchers have corroborated its utility for interpolating inter-city values. For example, Luechinger (Reference Luechinger2009) has employed it to predict sulfur dioxide (SO2) values in German counties, and Ferreira et al. (Reference Ferreira, Akay, Brereton, Cuñado, Martinsson, Moro and Ningal2013) used it to interpolate air pollution across 248 regions in Europe. Second, to identify the effects of air pollution on housing rental prices, this paper takes advantage of PM2.5 emissions at a communal level to create instrumental variables, as proposed by Bayer et al. (Reference Bayer, Keohane and Timmins2009). This allows us to improve the quality of the estimates by lessening the potential bias due to measurement errors and omitted variables.
The study's main findings confirm the negative effects of PM2.5 concentration on housing rental prices in Chile. The preferred model indicates that a 1 μg/m3 increase in PM2.5 produces, on average, a 4.1 per cent decrease in housing rental prices. Based on this estimate, the monthly marginal willingness to pay for a 1 μg/m3 decrease in PM2.5 averages US$12.31. This monetary assessment of air pollution is akin to the values found in México City (Chakraborti et al., Reference Chakraborti, Heres and Hernandez2019) and in a recent study for Chile (Mendoza et al., Reference Mendoza, Loyola, Aguilar and Escalante2019).
The remainder of this paper is organized as follows. Section 2 addresses the economic approach to valuing environmental amenities and briefly reviews the recent empirical evidence on housing values and air quality in Latin America. Section 3 presents the study case, interpolation techniques, and datasets. Section 4 outlines the econometric strategy and instrumental variables. The results are presented in section 5. Finally, section 6 offers concluding remarks and discusses some of the policy implications of the main findings and avenues for future research.
2. The economic valuation of air pollution
According to Rosen's (Reference Rosen1974) seminal paper, final housing prices can be empirically assessed as a function of their structural and site-specific attributes. A few years later, these local attributes represented the key inputs for modeling cross-city differences in housing prices under a spatial equilibrium framework (Rosen, Reference Rosen, Mieszkowski and Strashaim1979; Roback, Reference Roback1982). Under this model, individuals choose their locations to maximize their utility. In so doing, they sort across cities according to their preferences, reaching spatial equilibrium, where there are no utility differences across space for workers with identical preferences and skills (Winters, Reference Winters2009).
As Ferreira and Moro (Reference Ferreira and Moro2010) assert, under the spatial equilibrium approach, researchers may follow three alternative empirical methods to value environmental (dis)amenities. The first two methods are the stated-preference and life satisfaction approaches. The latter is relatively novel compared with the former, and it directly estimates the effects of an amenity on individual subjective wellbeing – which acts as a proxy for individuals’ utility – to compute the marginal willingness to pay for improvements in environmental attributes.Footnote 3 However, this study follows the third approach – the traditional revealed preference approach – using a hedonic equation to assess the effects of PM2.5 concentration on housing rental prices.
In what follows, we present the main characteristics of the hedonic model following Freeman et al. (Reference Freeman, Herriges and Kling2014) and Carriazo and Gomez-Mahecha (Reference Carriazo and Gomez-Mahecha2018). Under this model, a household's utility function may be represented as $U(x,\; \boldsymbol{Q})$ , where x is a composite good and $\boldsymbol{Q}$
 is a vector of the characteristics that affect housing rental price, such as housing, neighborhood, and commune attributes (including PM2.5 concentration). If the housing market is in equilibrium, the housing rental price can be represented as $P(\boldsymbol{Q})$
 . This expression is reminiscent of the well-known hedonic equation, in which housing rental price depends on a vector of attributes $\boldsymbol{Q}$
 .
In equilibrium, a household chooses the optimal level of the attribute that maximizes its utility, subject to the budget constraint $M = \boldsymbol{x} + P(\boldsymbol{Q})$ . Since the price of x is 1, the optimal consumption of attribute ${q_1}$
 is reached where the marginal rate of substitution between the attribute and composite good equals the implicit price of the attribute – that is, $((\partial U/\partial {q_1})/(\partial U/\partial x)) = ((\partial P(\boldsymbol{Q}))/\partial {q_1})$
 . Importantly, using this condition, an expression for the marginal willingness to pay (MWTP) might be found for changes in the ${q_1}$
 attribute (e.g., PM2.5). For a log-linear hedonic function, this can be computed as:

where $\hat{\beta }$ is the estimated coefficient for attribute ${q_1}$
 of the hedonic equation. As stressed by Freeman et al. (Reference Freeman, Herriges and Kling2014), it is important to bear in mind that equation (1) only allows estimation of the household's MWTP for small changes in ${q_1}$
 , keeping the utility level constant. This expression, however, does not provide the function itself. The estimation found via equation (1) makes up ‘first stage studies,’ while empirical research aimed at estimating the willingness to pay function are known as ‘second stage studies.’ The estimation of the willingness to pay function is useful for performing welfare analyses to measure, for example, how welfare is modified under different scenarios of air pollution (e.g., Carriazo and Gomez-Mahecha, Reference Carriazo and Gomez-Mahecha2018), which is particularly relevant from a policy perspective.Footnote 4
The main motivation behind using first stage studies in this research is to perform welfare analysis to account for marginal changes in air pollution. As mentioned, this task differs from second stage studies which may compute welfare effects of non-marginal changes in air quality. In this context, since air pollution dampens the wellbeing of residents (i.e., an environmental (dis)amenity), the empirical first stage hedonic equation should reveal the negative effect of air pollution on housing rental prices.
The use of the housing market to assess the impact of environmental attributes has a long tradition in the empirical literature. From the pioneering study developed by Ridker and Henning (Reference Ridker and Henning1967) for the St. Louis metropolitan area, to the analyses of Davis (Reference Davis2011) and Currie et al. (Reference Currie, Davis, Greenstone and Walker2015), who study the impact of power plants and industrial plants on housing values in the United States, numerous scholars have used housing markets to infer the value of environmental amenities. The economic assessment of air pollution has followed this pattern – as noted by Smith and Huang (Reference Smith and Huang1995), who have performed a meta-analysis of 37 studies on air particulate matter and housing values in the United States between 1967 and 1988, and, more recently, by Yusuf and Resosudarmo (Reference Yusuf and Resosudarmo2009), who incorporate additional hedonic studies, including Seoul and Taipei.
Evidently, the extant body of literature keeps providing new empirical studies. However, while research among developed economies and China is plentiful,Footnote 5 empirical analyses of air pollution in Latin American countries, aside from Chile, are limited to only a few studies for México and Colombia. For México, scholars have studied PM10 concentrations across states (Rodríguez-Sánchez, Reference Rodríguez-Sánchez2014) and, more recently, attention has been paid to México City with two studies: Chakraborti et al. (Reference Chakraborti, Heres and Hernandez2019), who analyze four air pollutants (PM10, PM25, SO2, O3) and Fontenla et al. (Reference Fontenla, Goodwin and Gonzalez2019), who only focus on PM10 in México City. In Colombia, Carriazo et al. (Reference Carriazo, Ready and Shortle2013) and Carriazo and Gomez-Mahecha (Reference Carriazo and Gomez-Mahecha2018) analyze air pollution in Bogota. Both studies focus on PM10 and, while the former employs a stochastic frontier model to address omitted variable bias, the latter estimates the second stage hedonic model to identify the demand function for PM10 reduction. These studies, besides using different methodological approximations and air pollutants, confirm the negative effect of air pollution on residents’ quality of life.
3. Study case, interpolation, and data
3.1 Study case
Air pollution is a severe environmental issue in Chile. The annual median PM2.5 concentration level in urban areas is approximately 25 μg/m3, while the recommended annual mean level is 10 μg/m3 (WHO, 2016). In 2018, according to the World Air Quality Report, nine Chilean cities were classified as the most polluted in Latin American and the Caribbean. From this group, the Chilean capital of Santiago is one of the most polluted cities, while the remaining cities are located in the southern part of the country. According to the 2017 census, the Metropolitan Region, where the political capital of Santiago is located, concentrates more than 40 per cent of the Chilean population; therefore, except for Santiago, the highest levels of air pollution are not necessarily correlated with the most populated Chilean communes. This scenario also reflects how communal levels of air pollution vary according to their sources. In the Metropolitan Area of Santiago, according to the Ministry of the Environment of Chile (2017), air pollution can be attributed to the urban transportation system, industrial activities, resident activities due to wood burning use, and a unique topographic position, which facilities pollutant accumulation.
In southern communes, air pollution is closely associated with wood burning. This excessive use of wood can be explained by the low quality of housing, cultural preferences, and the increasing demand for energy (Jorquera et al., Reference Jorquera, Barraza, Heyer, Valdivia, Schiappacasse and Montoya2018). It is important to stress that wood burning also plays a major role in increasing indoor pollution which, unlike outdoor pollution, results from household activities, such as cooking and smoking. Although northern communes are not classified as highly polluted, the literature has also documented high levels of PM2.5 in the northern commune of Tocopilla, where one of the main pollution sources is related to thermal power plants (Jorquera, Reference Jorquera2009).
3.2 Air pollution interpolation
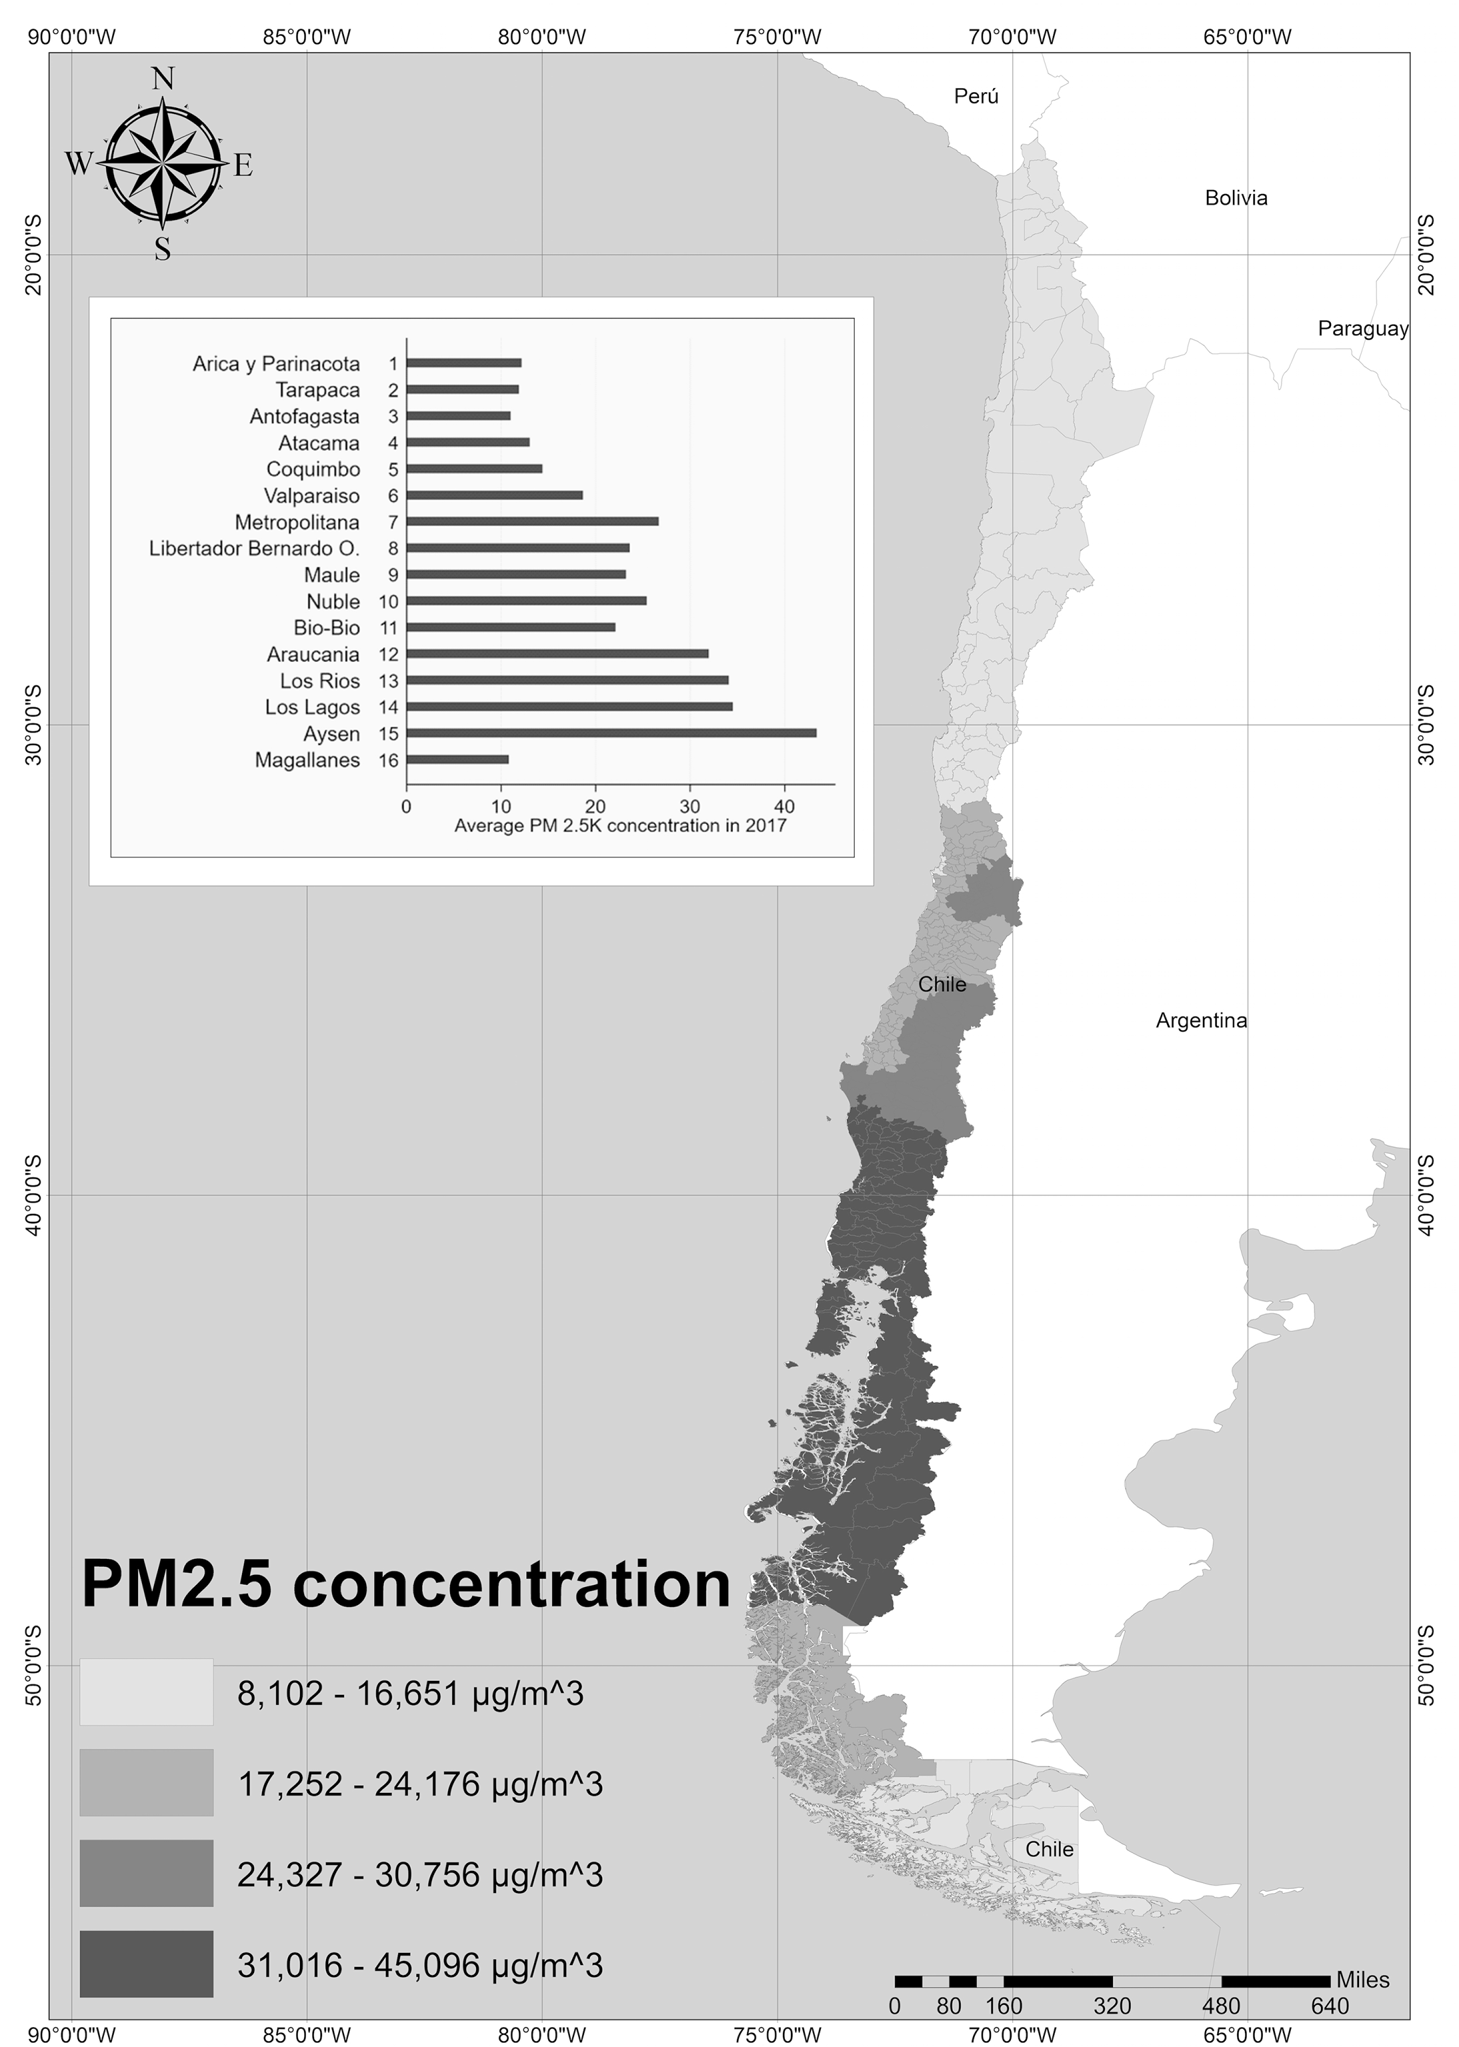
As mentioned above, this study expands the geographical scope of current research by analyzing 312 communes. To accomplish this, it employs spatial interpolation to predict PM2.5 concentration for communes without a monitoring station. This process involves two stages. First, PM2.5 levels have been obtained from the National Air Quality Information System (SINCA, in its Spanish acronym) for 47 monitoring stations with valid data for 2017, distributed across 41 communes. As figure A1 in the online appendix shows, although monitoring stations are distributed along the whole territory, they are overrepresented in and around the Metropolitan Region in the middle of Chile.
Second, to predict missing commune levels of PM2.5, we employ ordinary kriging techniques. Although there seems to be no consensus about whether, in general, the kriging method provides more reliable results compared to other techniques, it is recommended over inverse distance weighting – the other common interpolation technique – because of its precision and model fit (Naoum and Tsanis, Reference Naoum and Tsanis2004; Anselin and Le Gallo, Reference Anselin and Le Gallo2006; Brereton et al., Reference Brereton, Moro, Ningal and Ferreira2011).
The prediction derived from ordinary kriging results from a linear combination of observed points using a weight structure (Xie et al., Reference Xie, Chen, Lei, Yang, Guo, Song and Zhou2011). A general formula can be expressed as follows:

where $\hat{Z}({c_0})$ represents the predicted PM2.5 concentration in commune ${c_0}$
 ; N corresponds to the monitoring stations; $Z({c_i})$
 is the observed value in commune i; and ${w_i}$
 is the weights. The derivation of weights represents the key difference between kriging and other methods because these weights are determined with the objective of minimizing variance (Oliver and Webster, Reference Oliver and Webster1990).
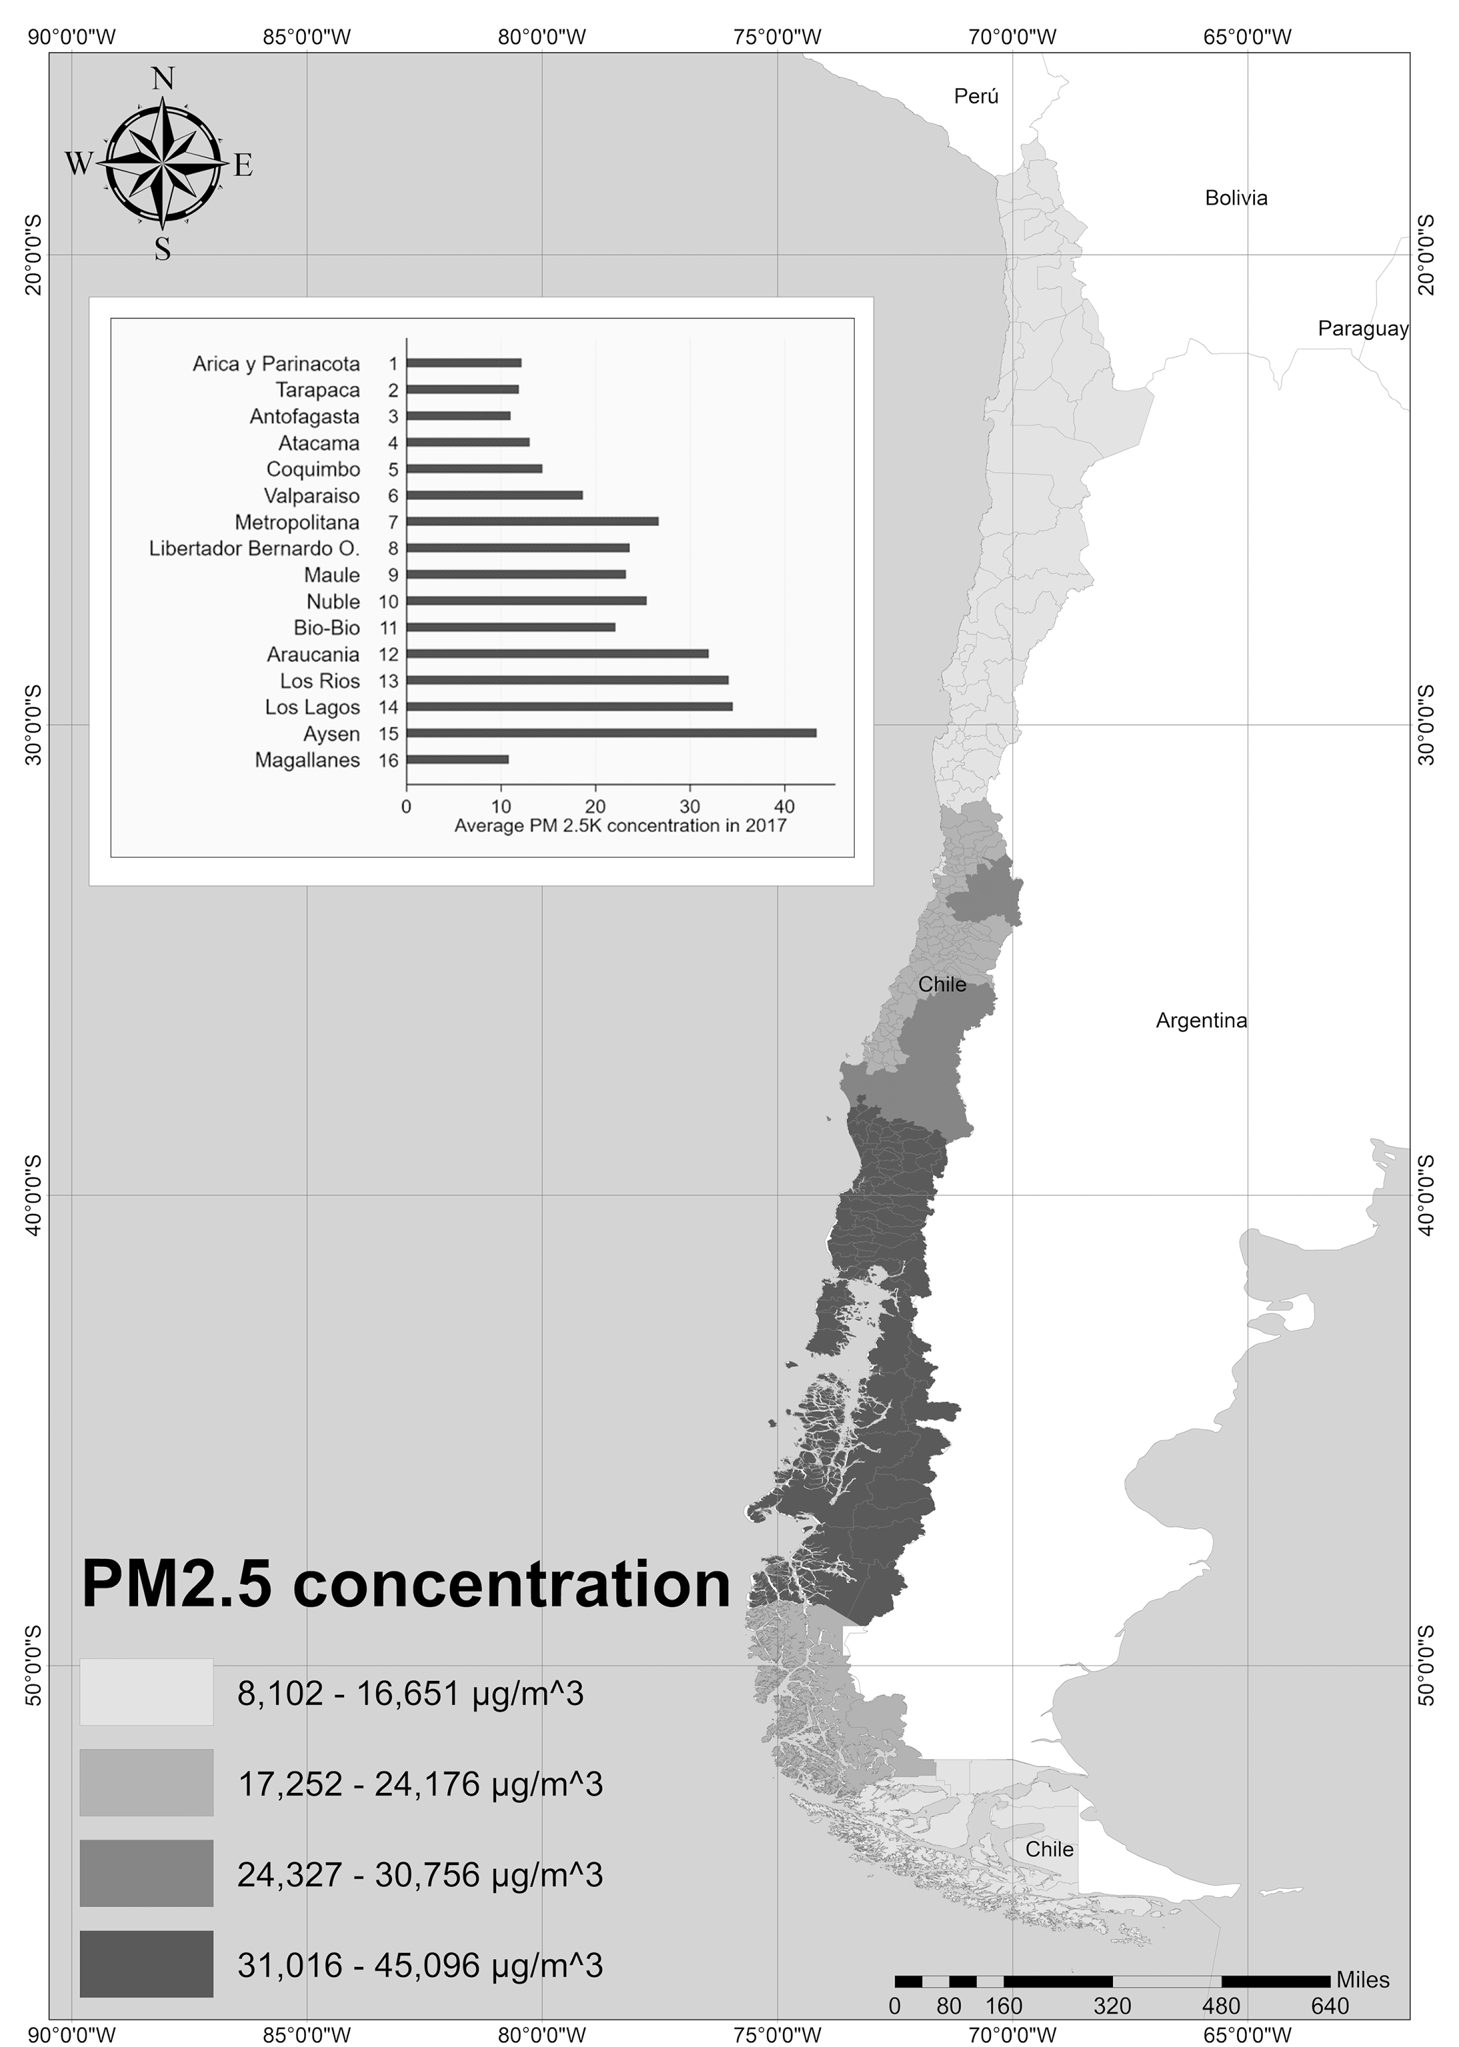
Figure 1 displays a map with the interpolated PM2.5 concentrations for Chilean communes. The highest levels of air pollution are in the middle of Chile and in the southern communes. As previously mentioned, poor air quality in these communes is related to urban transportation, topographic conditions, and wood burning. In the upper-left corner of figure 1, a graph displays regional interpolated values sorted according to their geographical position. This confirms that the highest values are found in the Metropolitan Region of Santiago and in the southern regions of Araucanía, Los Rios, Los Lagos, and Aysén. These regions contain the nine most polluted Chilean communes, according to the 2018 World Air Quality Report; therefore, this result provides suggestive evidence to support the accuracy of our interpolated measures.
Interpolated commune PM2.5 concentration.
Source: Authors’ own elaboration
3.3 Data
This study's main dataset comes from the Chilean National Socioeconomic Characterization Survey (CASEN) for 2017. This survey contains detailed information on housing characteristics, such as monthly housing rental prices, quality indexes, numbers of bathrooms, numbers of bedrooms, and square meters. From the total sample, we selected single-family households with a positive imputed rental price.Footnote 6 After handling missing values, the final sample corresponded to 49,649 dwellings distributed across 312 urban communes.Footnote 7
To control for neighborhood characteristics, the ideal scenario would be to have the specific spatial location of housing within each commune. The CASEN, however, does not offer such data. Rather, it asks respondents (using categorical questions) to provide information about how close their houses are to a set of services, such as public transport, educational centers, and supermarkets. Additionally, other questions capture residents’ perceptions regarding delinquency and pollution in their neighborhoods. In moving forward to commune-level attributes, we have controlled for natural sanctuaries (natural amenities) and a group of urban (dis)amenities, such as population density, typical places, cultural supply,Footnote 8 homicide rate, and the key independent variable of PM2.5 concentration.Footnote 9
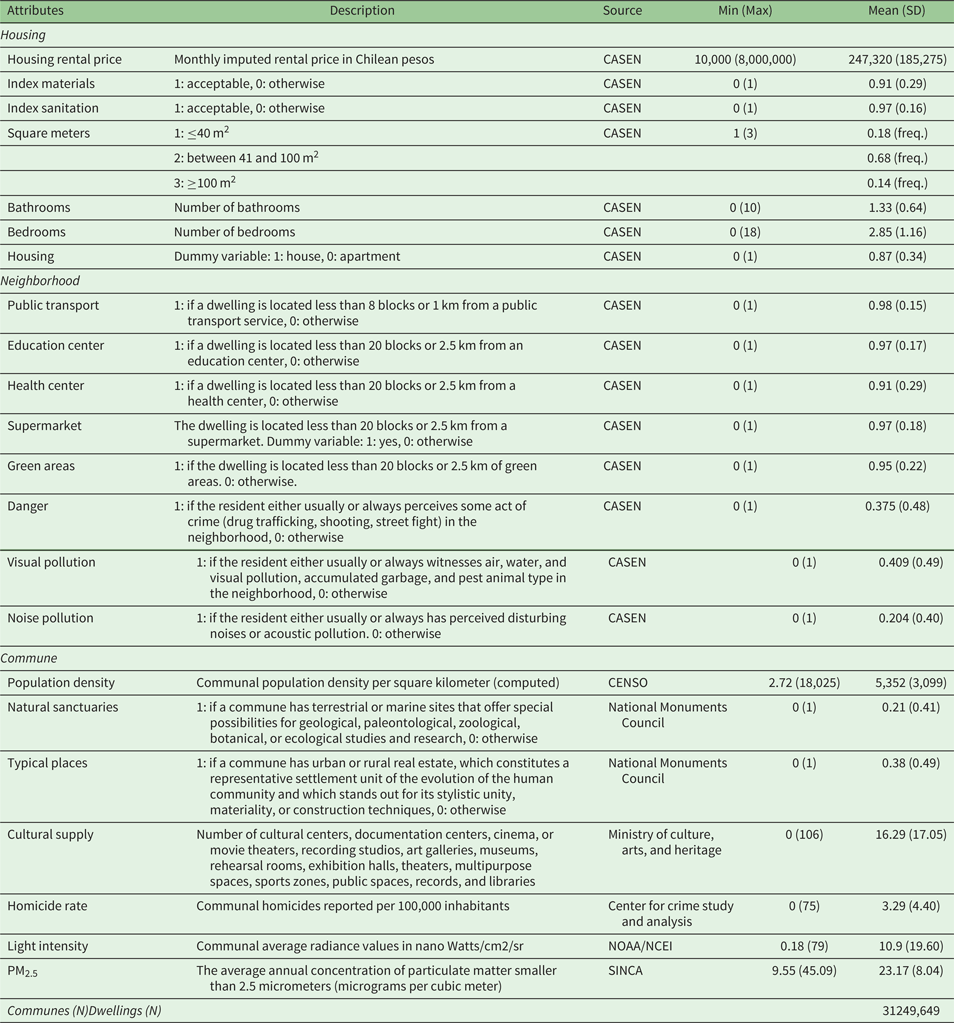
In addition to these control variables, it is important to highlight that the spatial distribution of air pollution closely relates to several (omitted) local activities, which also affect housing rental prices, such as local economic activity (e.g., industry and transportation), as stressed by Bayer et al. (Reference Bayer, Keohane and Timmins2009). Although the identification strategy will be addressed below, to begin mitigating omitted variable bias, we have taken advantage of satellite data, using nighttime light intensity as a proxy for communal economic activity (Donaldson and Storeygard, Reference Donaldson and Storeygard2016). As noted by Henderson et al. (Reference Henderson, Storeygard and Weil2012), the use of light increases as consumption and investment rise; therefore, light can be a proper measure of economic activity. To construct this variable, following the precedent of Soto et al. (Reference Soto, Vargas and Berdegué2018), we sum nighttime light within communal urban boundaries via the Visible Infrared Imaging Radiometer Suite (VIIRS) Day/Night Band (DBN), which has several advantages over previous light data used by researchers in different fields, as noticed by Elvidge et al. (Reference Elvidge, Kimberly, Mikhail, Feng and Tilottama2017). Table 1 displays the set of variables, as well as their descriptions, sources, and summary statistics.
Definition of variables, sources, and summary statistics
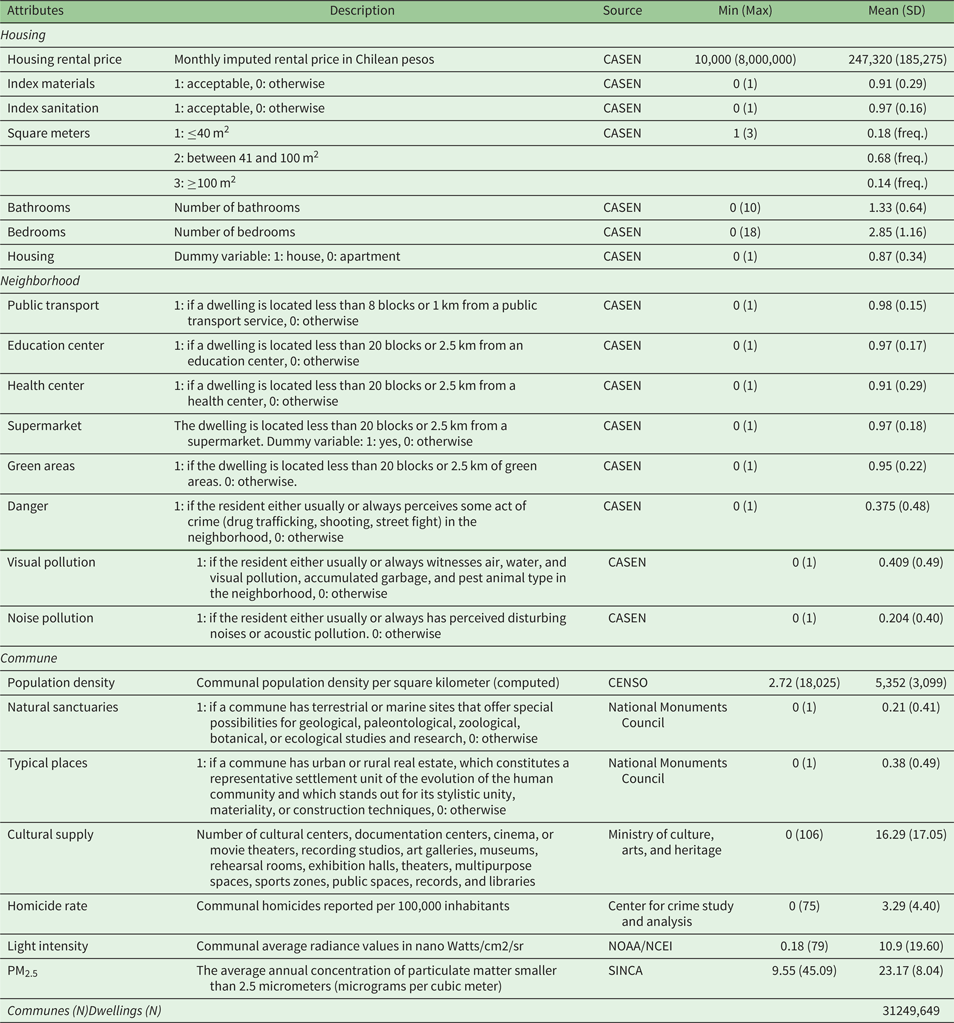
Note: All variables correspond to 2017.
4. Econometric strategy
To assess the effects of air pollution on housing rental prices, we estimate the following empirical model:

where the dependent variable is the natural log of the monthly housing rental price of dwelling i located in commune j. Vector X includes housing and neighborhood characteristics, while Z is a vector of commune-level variables, and $\varepsilon$ is the residuals. The parameter of interest in this case is $\gamma$
 , which measures the marginal effect of PM2.5 on the log of housing rental price.
The estimation of equation (2) will provide a mere adjusted statistical association between PM2.5 and a log of housing rental price. To reliably approximate the causal effect, two empirical challenges must be faced. First, as recognized by Anselin (Reference Anselin2001), interpolation methods are associated with measurement errors, which means that the true level of air pollution is measured with errors. In the regression analysis, these errors are captured by the residuals which produces measurement error bias in the parameter of interest. Additionally, as suggested in the previous section, omitted variable bias also represents a serious concern because commune levels of air pollution are closely related to unobserved local conditions contained in the residuals such as industrial activity and traffic congestion which, in turn, are positively associated with both housing rental prices and air pollution (Bayer et al., Reference Bayer, Keohane and Timmins2009). This results in an upward biased ordinary least squares (OLS) estimate, making the estimated coefficient show a smaller negative effect than it should.Footnote 10
To handle endogeneity concerns, we follow an instrumental variables approach. We must, then, find an instrument meeting two conditions. It must be correlated with the endogenous variable (relevance), and it must be orthogonal to the error term (exclusion). We partially follow the identification strategy proposed by Bayer et al. (Reference Bayer, Keohane and Timmins2009), which employs pollution sources across US counties to create an exogenous local shock for each county. To the best of the authors’ knowledge, although Chile has detailed information about PM2.5 emissions, unlike the US context, it does not have a matrix reflecting pollution transmission across communes. To overcome this issue, following the precedent of Rodríguez-Sánchez (Reference Rodríguez-Sánchez2014), this research takes a simple approach, by computing, for each commune, the weighted sum of the PM2.5 emissions (in tons) from communes farther away than 100 km but nearer than 500 km:Footnote 11
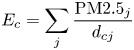
The total emissions $(E)$ affecting commune c is the sum of the emissions of all communes j, located farther than 100 km away but nearer than 500 km $(100 < {d_{cj}} < 500)$
 . We also create another instrument by applying equation (3), restricting it to communes farther than 500 km away. As shown by Li et al. (Reference Li, Li and Zhang2018), since PM2.5 emissions tend to exhibit a significant spatial correlation, we expect that the instrument will pass the relevance test, showing that commune-levels of PM2.5 are significantly associated with emissions from distant sources. Importantly, because the computation of equation (3) is limited to those communes farther than 100 km away, we also expect that the instrument will meet the exclusion restriction; that is, it should not be related to the housing rental prices of commune c.
5. Results
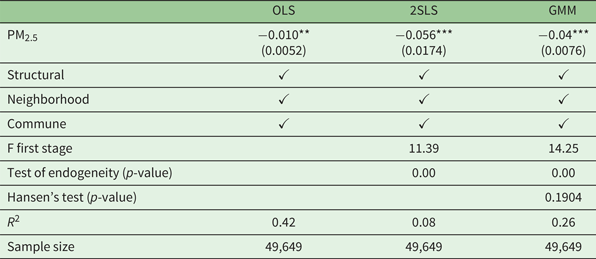
Table 2 summarizes the main results. As a baseline model, we began estimating equation (2) via OLS, followed by two-stage least squares (2SLS) and generalized method of moments (GMM) estimators. (The full estimates are provided in table A1 in the online appendix.) As expected – after controlling for housing, neighborhood, and commune attributes – the OLS estimate shows a negative association between cross-commune PM2.5 concentration and housing rental prices. Ceteris paribus, 1 μg/m3 increase of PM2.5 is associated with, on average, a 1 per cent decrease in housing rental price in Chile.Footnote 12
The effect of PM2.5 concentration on housing rental prices
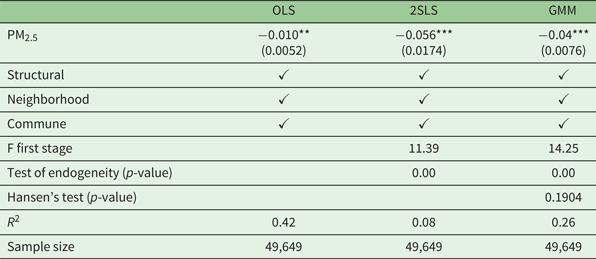
Dependent variable: log of monthly housing rental price.
Notes: Robust cluster standard errors by commune are shown in parentheses. Instrument 1 corresponds to the weighted sum of emissions from communes farther than 100 km away but nearer than 500 km. Instrument 2 corresponds to the weighted sum of emissions beyond 500 km. Test of endogeneity for 2SLS corresponds to a regression-based test using a cluster-robust variance matrix. Test of endogeneity for GMM corresponds to C statistic. **p < 0.05, ***p < 0.01.
Although the estimated coefficient is significant with the expected sign, this result is a mere statistical correlation if endogeneity issues are not addressed. As previously explained, due to omitted variables bias coupled with measurement errors, it is most likely that the OLS estimate is biased upward. Therefore, if the bias is significantly reduced, the estimated coefficient should decrease, showing a larger negative effect of pollution on housing rental price.
To identify the parameter of interest, we employ distant emissions from communes between 100 and 500 km away (Instrument 1) and sources beyond 500 km (Instrument 2) as exogenous shocks over the local level of air pollution. Column 2 shows the 2SLS results using Instrument 1, while GMM estimates, using both instruments, are displayed in Column 3.Footnote 13 As expected, when alleviating endogeneity, the estimated coefficient exhibits a larger negative effect of pollution on housing rental prices. According to column 2, the increase of 1 μg/m3 of PM2.5 would reduce housing prices by 5.8 per cent. The estimated effect is rather larger than the OLS estimates, suggesting that bias is a serious concern and can significantly diminish the consistency of the estimates. Also, emissions from distant communes are a strong instrument in the first stage, with an F-statistic above the rule of thumb of ten. This means that, after controlling for additional covariates, the adjusted correlation between Instrument 1 and the endogenous variable is significant. The regression-based endogeneity test rejects the null hypothesis (F(1,311) = 86.56 with p-value = 0.00) of consistency of the OLS estimate, supporting the use of an instrumental variables approach.
Although it can be argued that this instrument is reasonably exogenous, we cannot provide statistical evidence supporting this claim because the model is just identified. Column 3 displays the GMM estimates using both Instruments 1 and 2; therefore, the model is now overidentified.Footnote 14 Compared with 2SLS, the estimated coefficient for air pollution decreases by approximately 28 per cent, going from −0.056 to −0.04, although this is still rather larger than the OLS estimate. While the first stage F-test and the test of endogeneity are consistent with the results found using 2SLS, since the model is now overidentified, we can test the validity of their instruments. According to the Hansen test, the null hypothesis for the validity of the instrument is not rejected (p-value >0.1904); therefore, we can be certain enough that their instruments are exogenous and/or the model is correctly specified.
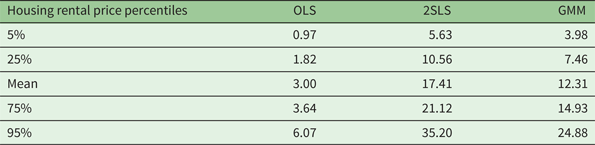
As a valuable additional analysis, with the estimated effect of PM2.5 on housing rental prices, the marginal willingness to pay for air quality improvement may be computed. In addition to providing a monetary measure of air pollution, this analysis is also useful for comparing these magnitudes with similar studies performed in Latin America – e.g., México and Colombia. Table 3 shows the MWTP at several housing rental price percentiles. To compute these values, we follow the structure of table 2. The second column presents MWTP using the OLS estimate, while the third and fourth columns employ 2SLS and GMM estimates.
MWTP for PM2.5 reduction (US$)
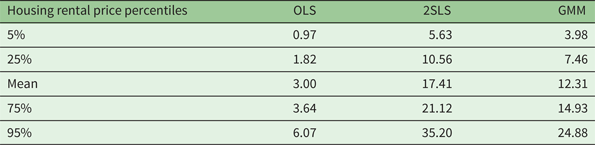
Several results are highlighted in table 3. First, as expected, the MWTP is severely underestimated when using the OLS estimates. Second, the MWTP varies significantly across housing rental price distributions, ranging from US$5.63 to US$35.20 and from US$3.98 to US$24.88 for 2SLS and GMM, respectively. According to column 4, the average monthly MWTP for a reduction of 1 μg/m3 of PM2.5 is approximately US$12.31 in Chile. Therefore, the question now is: How does this value compare with other Latin American countries?
To answer this, it is important to bear in mind that, although several scholars have studied particulate matter air pollution in Latin America, they have mostly focused on PM10. Regarding PM2.5, Chakraborti et al. (Reference Chakraborti, Heres and Hernandez2019) have analyzed air pollution in México City under a hedonic approach. Although the authors use land values as dependent variables, their MWTP for PM2.5 reduction ranges from US$9.14 to US$13.92 per m2 – values rather close to the mean of US$12.31 in column 4 of table 3. Similarly, for Chile, only one study has analyzed PM2.5, but it employs the life satisfaction approach (Mendoza et al., Reference Mendoza, Loyola, Aguilar and Escalante2019) in only 70 communes. According to Mendoza et al. (Reference Mendoza, Loyola, Aguilar and Escalante2019), the MWTP for reducing one unit of PM2.5 is between US$8.92 and US$13.00, measures akin to those found in México City and in the present study. Another salient conclusion, when comparing these results with those of Mendoza et al. (Reference Mendoza, Loyola, Aguilar and Escalante2019), is that the hedonic approach reveals similar MWTP with the life satisfaction approach, a result that deserves special attention because these approaches often yield different estimates.
Although PM10 is a larger particulate matter, since most empirical evidence in Latin America is associated with this pollutant, we will also provide a brief comparison of their MWTP with a sample from the most recent PM10 studies.Footnote 15 Interestingly, the average mean MWTP of US$12.31 is consistent with the same measure for PM10 in México City and Bogotá, Colombia. Specifically, Rodríguez-Sánchez (Reference Rodríguez-Sánchez2014), using a residential sorting model, has found a monthly MWTP for the reduction in PM10 to be between US$3.91 and US$23.64, whereas Carriazo and Gomez-Mahecha (Reference Carriazo and Gomez-Mahecha2018), using the estimated inverse demand function for PM10 – a second-stage study – compute a monthly MWTP for a decrease in PM10 of US$12.16. The estimate in the present research, however, is quite low compared with the total compensation per month of $83.96 found by Fontenla et al. (Reference Fontenla, Goodwin and Gonzalez2019) for México City. In Chile, Lavín et al. (Reference Lavín, Dresdner and Aguilar2011), considering 44 communes, has found an average MWTP between US$3 and US$6 for the reduction in PM10, values rather low compared with the present estimates.Footnote 16
Finally, since Chilean communes exhibit marked differences in housing rental prices (Iturra and Paredes, Reference Iturra and Paredes2014), it would also be worthwhile to examine the spatial distribution of the MWTP, in addition to considering its distribution across housing rental prices. As shown in figure A2 in the online appendix, although northern communes are not as polluted as southern communes, their MWTPs are significantly larger, while central communes, especially in the Metropolitan Region, display high MWTPs. Additionally, due to lower housing rental prices in some of the most polluted communes in southern Chile, their MWTP for a reduction in PM2.5 is also low.
6. Conclusions
This paper aimed to estimate the effect of communal PM2.5 concentration on housing rental prices in Chile. To meet this objective, the study faced two empirical challenges. First, since monitoring stations are scattered across the Chilean territory, information about PM2.5 concentration for several communes was missing. Second, a naïve regression of housing rental price on air pollution would produce an estimate that was biased upward.Footnote 17 To handle these issues, we first predicted the missing communal values of air pollution, making use of interpolation techniques. To accurately identify the parameter of interest, we also employed an instrumental variable strategy to reduce the bias due to omitted variables and measurement errors.
The main findings confirm the negative effects of air pollution on housing rental prices in Chile. The preferred model suggests that a 1 μg/m3 increase in PM2.5 produces, on average, a reduction of 4.1 per cent in housing rental prices. This result also confirms that upward bias is a serious empirical concern in the OLS model, showing a negative effect four times smaller than the GMM estimate. Based on these results, an average household in Chile would be willing to pay US$12.31 per month for a one-unit reduction in PM2.5 concentration. Similar results were found for México City and in an analysis of 70 Chilean communes.
Although this study provides compelling evidence that urban residents greatly value air quality improvements, it only contributes a small piece of evidence to the growing, but still scant, empirical analyses for Latin American countries. To enhance current understandings of the effect of this environmental issue, future research should broaden the scope of this study by reaching the second stage analysis proposed by Rosen (Reference Rosen1974). This would allow welfare changes to be computed under different scenarios, a useful task to assess, for example, a more stringent threshold of annual PM2.5 concentration. Also, scholars might address the inherent spatial dimension of air pollution in Chile by relaxing the assumption of a constant association between air pollution and housing rental prices across space. This analysis might reveal that this empirical association is heterogeneous across Chilean communes.
Finally, the results of this study are also valuable for policymakers because they might serve as an important support for implementing policies to reduce emissions from different sources, such as urban congestion and polluting industrial activities. More specifically, as in Chen et al. (Reference Chen, Hao and Ch2017), using the estimates in table 2 along with the 2017 census that contains the total number of dwellings, it is possible to compute an approximation of the total marginal welfare change – in terms of total monthly housing rental price devaluation – that urban residents must bear for the increase of 1 μg/m3 of PM2.5. These marginal changes for the five most polluted communes, according to the 2018 World Air Quality Report – Padre las Casas, Osorno, Coyhaique, Valdivia and Temuco – are US$0.23, 0.60, 0.35, 0.73 and 1.11 million respectively. These marginal welfare changes can be compared to marginal costs of abatement policies to assess how feasible their implementations are with the aim of improving the wellbeing of urban residents (Freeman et al., Reference Freeman, Herriges and Kling2014).
Supplementary material
The supplementary material for this article can be found at https://doi.org/10.1017/S1355770X20000522
Acknowledgements
The authors acknowledge financial support from CONICYT/Chilean Fondecyt 11170018 ‘City differences in the return to schooling’.