I. INTRODUCTION
With the rapid and increasing growth of wireless and mobile communication systems, the multi-band and multi-mode systems and applications for wide-area and local-area wireless systems are being actively researched and developed by many countries in the world [Reference McCune1], including WLAN 802.11a/b/g [Reference Banbury, Fayyaz, Safavi-Naeini and Nikneshan2], GSM800MHz/GSM1.8GHz [Reference Hossein, Lavasani, Chaudhuri and Kiaei3], and ISM2&5GHz [Reference Magnusson and Olsson4]. For the multi-band and multi-mode applications, however, the interference and image rejection of collocated active radios in both frequency and space become a crucial issue [Reference Raghavan, Gebara, Tentzeris and Laskar5]. To address this problem, the CMOS LNA with image rejection filters [Reference Chen, Chang, Huang, Jean and Yeh6, Reference Nguyen, Oh, Cha, Oh, Ihm and Lee7] and the differential phase rotator [Reference Raghavan, Gebara, Tentzeris and Laskar5] have been proposed as an active interference canceller. The CMOS LNA [Reference Chen, Chang, Huang, Jean and Yeh6, Reference Nguyen, Oh, Cha, Oh, Ihm and Lee7] employs a stacked common-gate topology, thus not suitable for differential amplification. The canceller system using the differential phase rotator [Reference Raghavan, Gebara, Tentzeris and Laskar5] is complex in circuit topology and provides an additional loss. In addition, these circuits have a difficulty to be applied to multi-band and multi-mode operation.
In order to address these problems, an SiGe HBT differential amplifier with frequency and rejection-level tunable, multiple stopband is devised mainly for WLAN 802.11 a/b/g applications. It employs a multiple LCR-tank circuit, which is cascaded in a stacked form and connected between emitters of the differential transistor pair to achieve multiple bandstop performance. Each LCR-tank circuit employs an active load comprised of a varactor diode represented as a variable C for frequency tuning and a common-base transistor represented as a variable R for rejection-level tuning.
Basically the multi-band amplifiers are categorized into three basic groups. The first group achieves multi-band performance by switching amplifiers, matching circuits, or bias [Reference Zhang, Madie, Bretchko, Makoro, Shumovich and McMorrow8]. The second group employs a concurrent matching technique [Reference Hashemi and Hajimiri9, Reference Nakajima and Muraguchi10]. The third group is a wideband amplifier [Reference Lin and Lu11]. The first group has a non-operating amplifier or matching circuits, leading to a large size and high power consumption. The circuit design of the second group is rather complicated, thus limiting the number of bands to dual band. The third group amplifies the unwanted signals at the same time. The stacked LCR-tank circuit presented in this paper has an advantage over the conventional groups in circuit size, circuit design simplicity, power consumption, suppression of the unwanted signals, and applicability of multiple bands [Reference Itoh, Shinohara, Shirata and Sakamoto12].
As a frequency-tunable device, the varactor-tuned, frequency-agile microwave filter with bandpass or bandstop performance is widely used [Reference Jachowski13]. Since it is comprised of distributed microstrip or coplanar lines combined with varactor diodes, the circuit size becomes much larger in the multi-band and multi-mode applications. To overcome this problem, lumped LC elements are utilized in this amplifier in order to achieve a miniaturized size. Moreover, with the use of a stacked configuration, multiple bandstop frequencies can be tuned independently by adjusting a control voltage of the varactor diode.
The amplifier presented in this paper has made great advances over the previously reported ones [Reference Itoh14, Reference Shirata, Shinohara, Sato and Itoh15] in that only frequency was varied in ref. [Reference Shirata, Shinohara, Sato and Itoh15] but frequency, rejection-level, and number of rejection peaks can be varied with the introduction of active loads. Moreover, the design approaches and measured results on how to improve noise figure and IIP3 are presented. The frequency and rejection-level tunable performance for multiple stopband are promising as an active interference canceller for the next-generation, adaptive and/or reconfigurable wireless radios.
II. CIRCUIT DESIGN
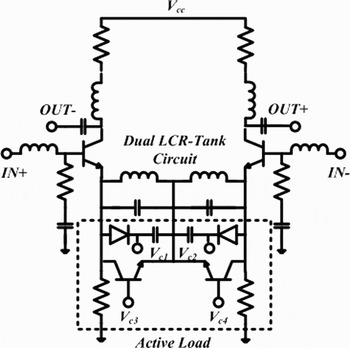
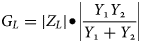
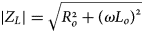
A schematic diagram of the frequency and rejection-level tunable differential amplifier with dual stopband is shown in Fig. 1. The amplifier employs a dual LCR-tank circuit with an active load in the design of the series feedback loops of the differential amplifier. The active load consists of a varactor diode as a variable C and a common-emitter transistor as a variable R. V c1 and V c2 are control voltage of the varactor diode and V c3 and V c4 are control voltage of the transistor. A low-frequency gain of the differential amplifier (G L) is given as [Reference Gray, Hurst, Lewis and Meyer16]

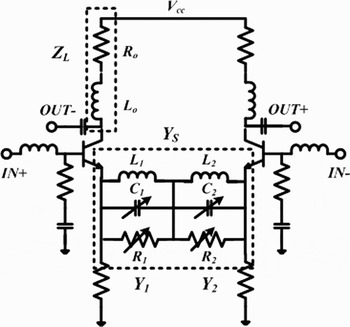
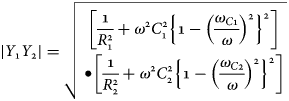
where Z L is a load impedance consisting of an inductor L o and a resistor R o. Y S is an admittance of the dual LCR-tank circuit. A simplified schematic diagram of Fig. 1 is shown in Fig. 2. An LCR-tank circuit is represented as a parallel connection of a fixed L, a variable C, and a variable R. With the use of the admittances of each LCR-tank circuit (Y 1 and Y 2) and the load impedance Z L, a low-frequency gain G L in Eq. (1) can be obtained as follows:


Schematic diagram of the frequency and rejection-level tunable differential amplifier with dual stopband.

Simplified schematic diagram of Fig. 1.

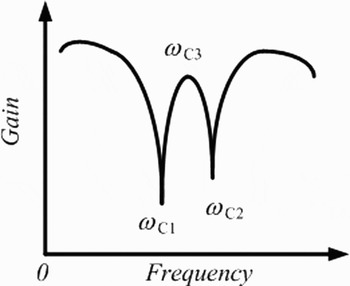
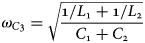
It is noted in Eqs (2) to (8) that a low-frequency gain G L has a single gain peak at ω C3 as well as double rejection peaks at ω C1 and ω C2, which is roughly displayed in Fig. 3. If ω C1 < ω C2, then ω C1, ω C2, and ω C3 necessarily satisfy the condition that ω C1 < ω C3 < ω C2. The frequency and rejection level can be tuned independently by controlling the value of C 1 (V c1), C 2 (V c2), R 1 (V c3), or R 2 (V c4). Cascading additional LCR-tank circuits in a stacked form can easily increase the number of rejection peaks.
Gain and rejection peaks of the amplifier.

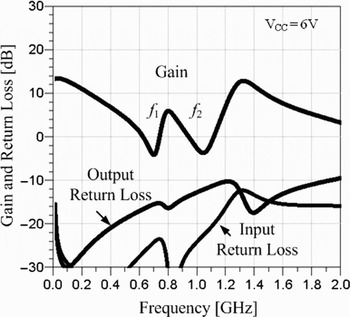
A design example of the simulated gain and return loss of the amplifier is shown in Fig. 4, where V cc is a supply voltage. The bias conditions are V cc = V c1 = V c2 = 6 V and V c3 = V c4 = 6.6 V, respectively. The circuit simulation was accomplished for the schematic diagram shown in Fig. 1, where 0.35 µm SiGe HBTs (Toshiba MT4S102T) with f t = 25 GHz and silicon varactor diodes (Toshiba 1SV279) with C 2V = 15 pF, C 10V = 6 pF are used. In Fig. 4, f 1 and f 2 are a stopband. Since an averaged gain of the amplifier without LCR-tank circuits is around 10 dB from 0.2 to 1.5 GHz, a rejection level of around 14 dB at f 1 and f 2 is accomplished. Input and output return losses are better than 12 dB at f 1 and f 2.
Simulated gain and return loss of the frequency and rejection-level tunable differential amplifier with dual stopband.

III. CIRCUIT FABRICATION
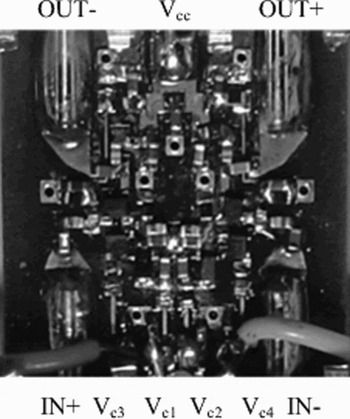
A photograph of the frequency and rejection-level tunable differential amplifier with dual stopband is shown in Fig. 5. The amplifier was fabricated on the FR-4 substrate with a dielectric constant of 4.5. 1005-type chip inductors, capacitors, and resistors are mounted on the substrate by soldering. The circuit size is 16 × 16 × 1.2 mm3.
Photograph of the frequency and rejection-level tunable differential amplifier with dual stopband.

IV. CIRCUIT PERFORMANCE
A) Gain and return loss
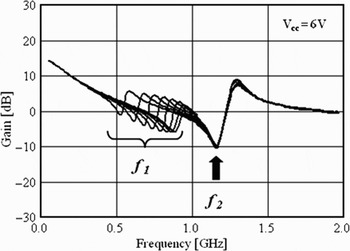
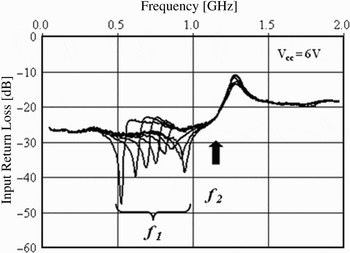
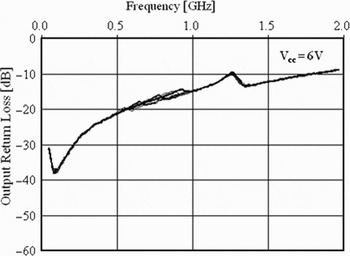
The measured gain and return loss of the amplifier are shown in Fig. 6. The measurement was done on the condition that V cc = V c1 = V c2 = 6 V and V c3 = V c4 = 6.6 V. The measured gain and return losses are in good agreement with the simulated ones in Fig. 4, showing a slight discrepancy for rejection level. As compared with the measured result of the amplifier that does not have a common-emitter transistor as a variable R [Reference Shirata, Shinohara, Sato and Itoh15], the overall gain drops by approximately 1 dB but the input and output return losses are almost the same.
Measured gain and return loss of the frequency-tunable, dual-stopband differential amplifier.

B) Frequency tunable performance
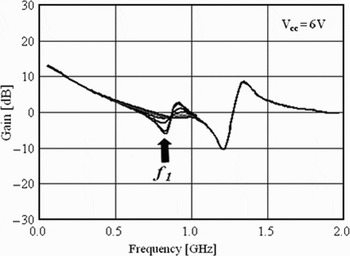
As mentioned above, the bandstop frequencies (f 1 and f 2) can be tuned independently with the control of V c1 or V c2. The measured results on the condition that f 1 is varied and f 2 is fixed are introduced first. Then the measured results on the condition that f 1 is fixed and f 2 is varied are demonstrated. The measured gain, input return loss, and output return loss are shown in Figs 7–9 on the condition that V c1 varies from 2 to 10 V for a fixed value of V c2 = 10 V.
Measured gain for a varied value of V c1 and a fixed value of V c2.

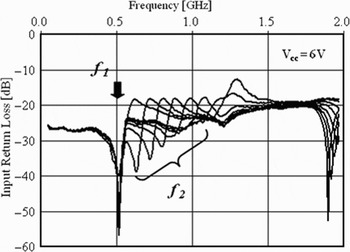
Measured input return loss for a varied value of V c1 and a fixed value of V c2.

Measured output return loss for a varied value of V c1 and a fixed value of V c2.

It is shown in Fig. 7 that the bandstop frequency f 1 can be tuned from 0.5 to 0.8 GHz for a fixed value of f 2 = 1.1 GHz. The rejection-level changes from 11.2 to 15.5 dB for a variation of f 1. As shown in Figs 8 and 9, the input and output return losses are better than 25 and 15 dB, respectively, for a variation of f 1. The measurement was done at V cc = 6 V and V c3 = V c4 = 6.6 V.
On the other hand, the measured gain, input return loss, and output return loss are demonstrated in Figs 10–12 on the condition that V c2 varies from 2 to 10 V for a fixed value of V c1 = 2 V. It is shown in Fig. 10 that the bandstop frequency f 2 can be tuned from 0.6 to 1.1 GHz for a fixed value of f 1 = 0.6 GHz. The rejection-level changes from 11.5 to 17.5 dB for a variation of f 2. As clearly shown in Figs 11 and 12, the input and output return losses are better than 17.5 and 11 dB, respectively, for a variation of f 2. The measurement was done at V cc = 6 V and V c3 = V c4 = 6.6 V.
Measured gain for a varied value of V c2 and a fixed value of V c1.

Measured input return loss for a varied value of V c2 and a fixed value of V c1.

Measured output return loss for a varied value of V c2 and a fixed value of V c1.

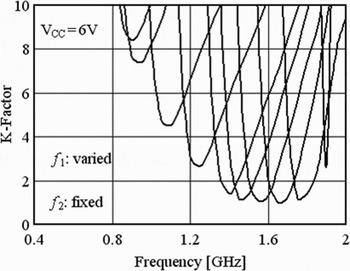
A stability factor for frequency tunable performance was calculated and plotted in Fig. 13. The calculated results are almost the same for both Figs 7 and 10. Thus only the calculated K-factor for Fig. 7 was shown in Fig. 13. As f 1 comes near to f 2, the K-factor decreases but becomes constant to around 1.2, showing an unconditionally stable condition.
Calculated K-factor for a varied value of f 1 and a fixed value of f 2.

C) Rejection-level tunable performance
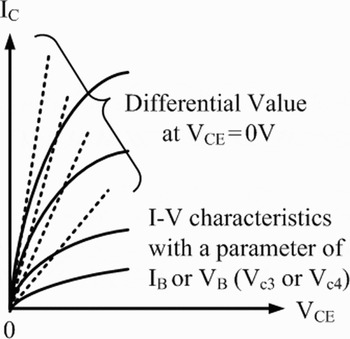
The rejection level at a stopband can be tuned by varying the value of R 1 or R 2 in Fig. 2. A variable R 1 or R 2 is obtained from a differential value of the I–V curves of the transistor at V CE = 0 V. A typical example of the I–V characteristics of the transistor is shown in Fig. 14. The solid and dotted lines show I–V curves and differential values at V CE = 0, respectively. As clearly shown in Fig. 14, a differential value of the I–V curves varies with a parameter of I B or V B at V CE = 0 V. Actually, a variable R 1 or R 2 is realized by using the output impedance of the transistor with a parameter of V B for V CE = 0 V.
I–V characteristics of the transistor.

The measured results on the condition that V c3 is varied from 6.6 to 7.4 V and V c4 is fixed to 6.6 V are shown in Fig. 15. Then the measured results on the condition that V c3 is fixed to 6.6 V and f 2 is varied from 6.6 to 7.4 V are displayed in Fig. 16. V cc, V c1, and V c2 are 6 V.
Measured gain for a varied value of V c3 and a fixed value of V c4.

Measured gain for a varied value of V c4 and a fixed value of V c3.

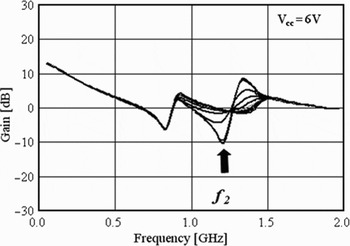
The rejection level varies from 1 to 6 dB at f 1 with the control of V c3. On the other hand, the rejection level varies from 0.5 to 10 dB at f 2 with the control of V c4. From these results, a rejection level up to 9.5 dB has been achieved across 0.53–1.16 GHz. No outstanding changes appeared for the input and output return losses. As similar to the frequency-tuning performance, the rejection level can be also varied independently.
In an actual application of the wireless systems, for example, the interference cancellation or image-rejection ratio of greater than 80 dB could be needed. The bandstop filters with 30 dB of band-rejection ratio are connected before and after the amplifier. Thus a band-rejection ratio of greater than 20 dB is required for the amplifier, which can be easily achieved by employing a multi-stage design.
D) Number of rejection peaks
As an application of the frequency-tunable performance, the number of rejection peaks (the number of stopband) can be varied. At a starting point, two bandstop frequencies (f 1 and f 2) are separated as far as possible. Then V c1 and V c2 are controlled so that two separate frequencies (f 1 and f 2) come near and finally become a single frequency (single band). The measured variation of the number of rejection peaks (the number of stopband) with the control of V c1 and V c2 is shown in Fig. 17. f 1 moves from 0.6 to 0.8 GHz for a variation of V c1 from 6 to 13 V. Inversely, f 2 moves from 1.2 to 0.8 GHz for a variation of V c2 from 13 to 6 V. In a similar way, a variation from single band to dual band is also possible.
Variation of the number of stopband with the control of V c1 and V c2.

E) Noise figure
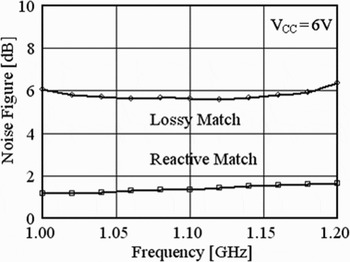
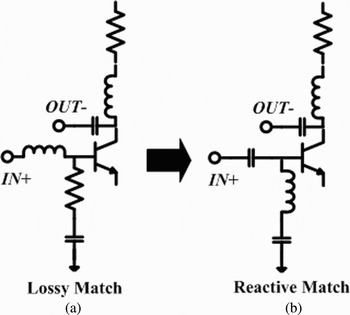
The noise figure measurement was done for the pass-band region from 1.0 to 1.2 GHz with f 1 = 0.8 GHz and f 2 = 1.1 GHz. The measured results are shown in Fig. 18. The measured best noise figure was 5.6 dB at 1.1 GHz. The bias conditions were V cc = 6 V and I c = 8 mA. Considering the F min of 0.4 dB at 1 GHz of the 0.35 µm SiGe HBT, the measured NF shows a poor performance because the amplifier employs a lossy match configuration to achieve a wide bandwidth and high stability. The noise figure can be improved with the employment of reactive matching in place of lossy matching, sacrificing bandwidth. A schematic diagram of lossy match and reactive match configurations is shown in Fig. 19. The noise figure was measured for the reactive match configuration in Fig. 19 (b) and also plotted in Fig. 18. The measured best noise figure was 1.2 dB at 1 GHz, showing a significant improvement of 4.4 dB. But the frequency tuning range becomes narrow from 0.53–1.16 GHz down to 0.8–1.2 GHz.
Measured noise figure performance of the lossy match and reactive match amplifiers.

Schematic diagram of the lossy match and reactive match configurations.

F) IIP3
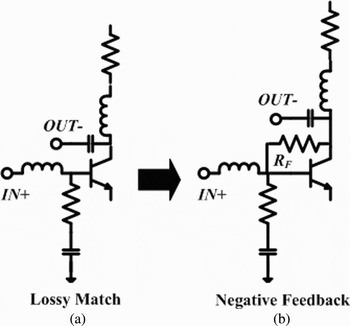
In order to achieve a high dynamic range of the low-noise amplifier, a low noise figure along with a high IIP3 is required. To achieve a high IIP3, the employment of negative feedback circuits and the increase of collector currents are a widely used approach. A schematic diagram of the lossy match and negative feedback configurations is shown in Fig. 20. Two-tone characteristics are measured for the negative feedback circuit in Fig. 20 (b) with a parameter of the feedback resistance (R F). Two tones of f 1 = 1.08 GHz and f 2 = 1.1 GHz were chosen. The measured gain and IIP3 with a parameter of R F are shown in Fig. 21. The measurement was done on the condition that V cc = V c1 = V c2 = 6 V and V c3 = V c4 = 6.6 V. As the feedback amount increases, that is, the value of R F becomes small, the gain drops steeply but IIP3 significantly improves. Two-tone characteristics are also measured for the lossy match circuit in Fig. 20 (a). The measured P 1dB is +3 dBm and IIP3 is 0 dBm with V cc = 6 V and I c = 8 mA, which corresponds to an infinity of R F in Fig. 21.
Schematic diagram of the lossy match and negative feedback configurations.

Measured gain and IIP3 with a parameter of R F for the negative feedback configuration.

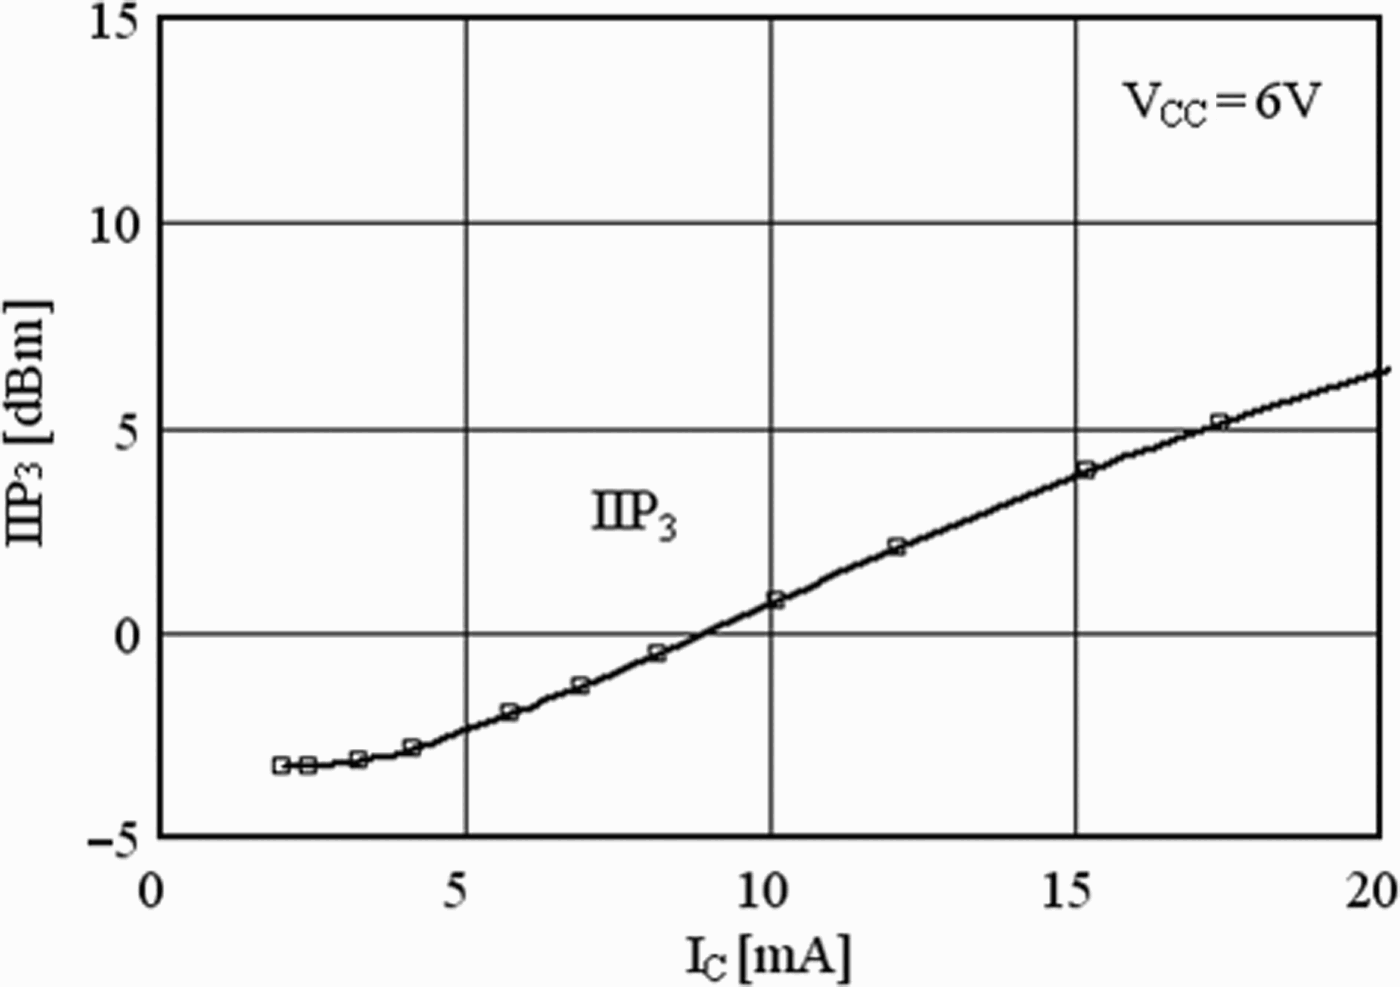
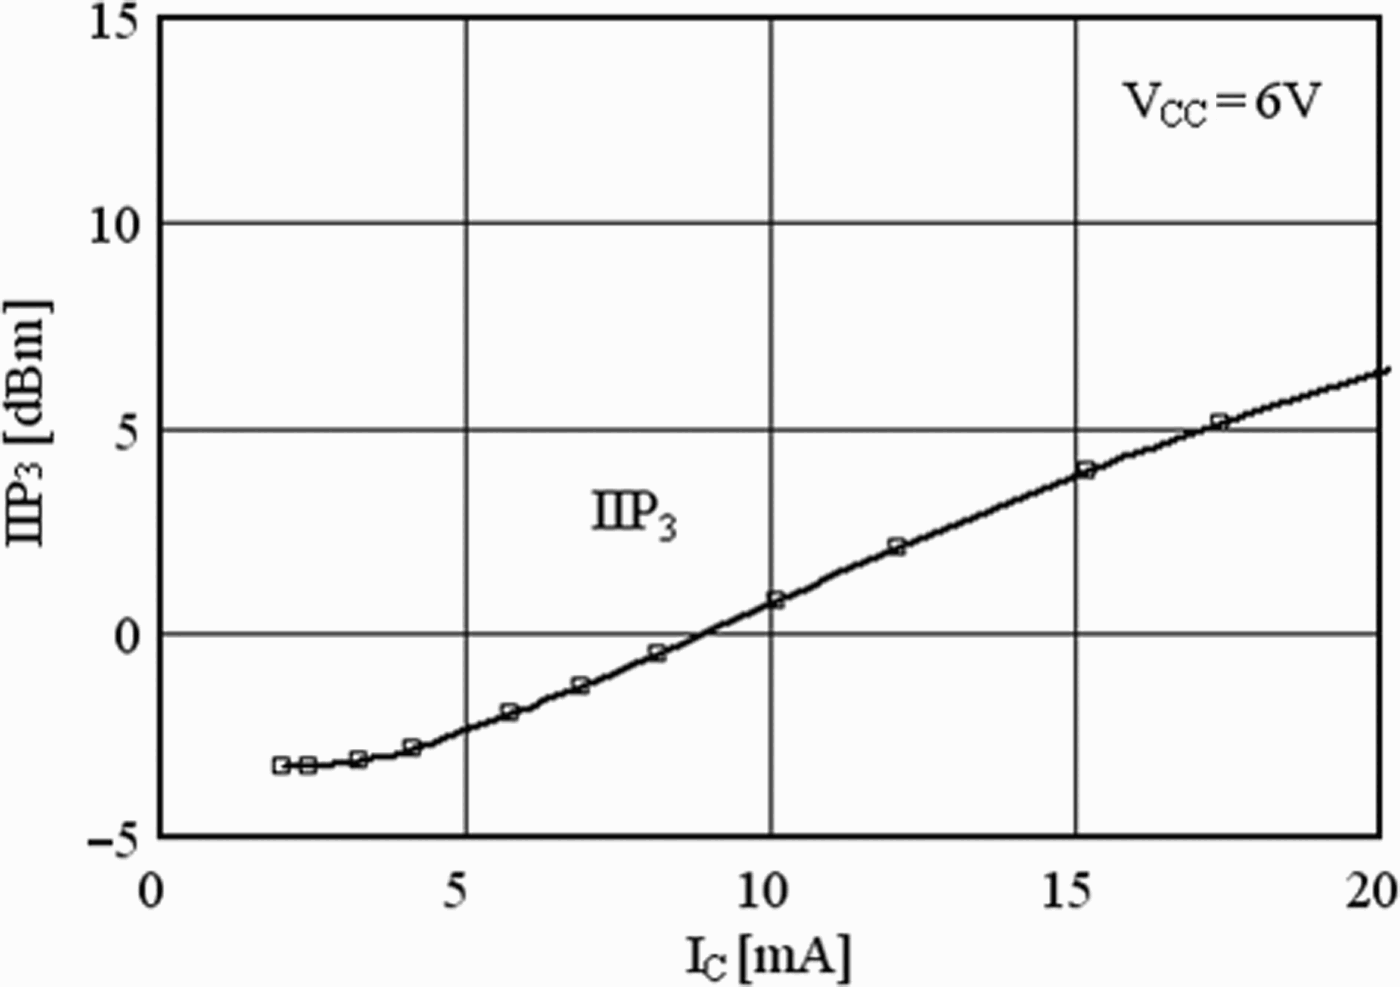
The other approach to improve IIP3 is to increase collector current (I C). The measured IIP3 with a parameter of I C is shown in Fig. 22. As I C increases from 8 to 20 mA, an improvement of IIP3 up to 6.5 dB has been achieved. This approach provides a compromise between IIP3, power consumption, and noise figure performance.
Measured IIP3 with a parameter of I C.
V. CONCLUSIONS
The L-band frequency and rejection-level tunable SiGe HBT differential amplifier with dual stopband has been presented. In order to achieve frequency and rejection-level tunable performance, dual LCR-tank circuit with an active load was incorporated into the design of the series feedback loops of the differential amplifier. The implemented 0.35 mm SiGe HBT amplifier with dual stopband shows a frequency tuning of 0.53–1.16 GHz and a rejection-level variation up to 9.5 dB. The input and output return losses are better than 17.5 and 11 dB over 0.2–1.5 GHz, respectively. The measured P 1dB is +3 dBm and IIP3 is 0 dBm with V cc = 6 V and I c = 8 mA. The data shown in the paper are limited to a 1 GHz band. For future WLAN applications, the operating frequency is due to be increased up to 2 and 5 GHz bands. The results obtained in the paper demonstrate that the frequency and rejection-level tunable differential amplifier with multiple stopband would be one of the candidates as an active interference canceller for the next-generation, adaptive and/or reconfigurable wireless radios.
 Masaki Shirata received the B.E. degree in electrical and electronic engineering from Shonan Institute of Technology in 2008. He is now a student of the master course of electrical and information engineering in Shonan Institute of Technology. His research interest is in microwave low-noise amplifiers for multi-band and multi-mode applications. He is currently a student member of IEICE Japan.
 Toshio Shinohara received the B.E. and M.S. degrees in electrical and electronic engineering from Shonan Institute of Technology in 2007 and 2009, respectively. He joined the Miharu Communications Inc. in 2009 and is now working on the research and development of CATV and optical communication systems. He is currently a member of IEICE Japan.
 Minoru Sato received the B.E. degree in electrical and electronic engineering from Shonan Institute of Technology in 2008. He joined the Chiyoda Keiso Co. Ltd. in 2008. He is working on the research and development of new clean energy systems, global environment-friendly technologies, etc. based on a wide range of constituent engineering technologies, which have been applied in various types of plants for the past several years.
 Yasushi Itoh received the B.S., M.S., and D.E. degrees in electronic engineering from Waseda University, Tokyo, Japan, in 1978, 1981, and 1989, respectively. He joined Tokimec Inc. in 1981, where he has worked on the R&D of broadband low-noise amplifiers and oscillators. In 1990, he joined Mitsubishi Electric Corporation, Information Technology R&D Center, where he has been engaged in the research and development of microwave and millimeter-wave low-noise and high-power MMIC amplifiers and solid-state power amplifiers. From 2000 to 2003, he has been a visiting professor of the Cooperative Research Center of the University of Electro-Communications, Tokyo, Japan. In 2003, he joined the Shonan Institute of Technology, Kanagawa, Japan, as a professor of the Department of Electrical & Electronic Media Engineering. In 2000, he received the Electronics Society Award from IEICE Japan. He is s Senior Member of the IEEE.