

I. Introduction
Because government depends on public administration for policy implementation and the supply of public services, a country’s bureaucracy is essential to the proper functioning of its political system.Footnote 1 Bureaucratic organization varies significantly across countries, including substantial divergence in key attributes, such as meritocracy in recruitment.Footnote 2 This variation matters because bureaucratic quality has an impact on economic and human development.Footnote 3 Yet even across regions within the same country, there is often divergence in bureaucratic performance.Footnote 4 Could imperial legacies contribute to this variation?
Scholars have discovered lasting effects of empires and colonial powers in many other dimensions,Footnote 5 including legacies of legal systems,Footnote 6 slavery,Footnote 7 and trade relationships,Footnote 8 as well as of political and economic institutions.Footnote 9 But few have looked at their long-term effects on bureaucratic institutions. Existing studies often do not measure bureaucratic characteristics directly and instead focus on perceptionsFootnote 10 or the social, political, and economic consequences thereof, including the quality of public goods.Footnote 11 Furthermore, many existing studies on administrative legacies have problems, such as high levels of unobserved heterogeneity and the potential of nonrandom selection into treatment, that could be addressed with a more rigorous research design.
The small number of studies exploring the specific relationship between imperialism and public administration is surprising for three reasons. First, an extensive literature highlights the relevance of bureaucracies for governing,Footnote 12 analyzing the importance of administrative law,Footnote 13 political appointments,Footnote 14 and the role of civil servants in the lawmaking process.Footnote 15 Second, in comparison with legal systems, the character of a country’s public administration may be a superior explanation for different levels of development.Footnote 16 Third, bureaucratic institutions are among the most powerful tools for controlling people and are thus a fundamental aspect of imperial rule.Footnote 17
Within the colonial origins literature there is a debate regarding the long-term effects of centralized versus decentralized rule. For example, Alexander Lee and Kenneth Schultz argue that decentralized British rule in Cameroon, which gave significant power to local actors, had positive long-term effects on public goods provision.Footnote 18 Similar findings are obtained by Lakshmi Iyer with respect to India.Footnote 19 But Matthew Lange finds that indirect rule had negative consequences for several development indicators.Footnote 20 And Lange’s results are echoed by Jan Pierskalla, Anna Schultz, and Erik Wibbels, who argue that exposure to central political authority has positive developmental effects.Footnote 21 Such findings are related to a broader literature on different types of colonial rule.Footnote 22 Building on this debate, I also seek to shed light on whether decentralized imperial rule results in better long-term bureaucratic performance.
To address these questions, I use an original data set of bureaucratic characteristics in Poland based on a survey of more than 650 local administrations. Poland is an ideal setting for exploring imperial legacies because its entire present-day territory was partitioned among “three very different Empires,” Austria, Prussia, and Russia, for 123 years (1795–1918).Footnote 23 Figure 1 shows the imperial borders of 1815–1914 and the boundaries of contemporary Poland (dotted line). Multiple studies support the claim of quasi-randomness for the imperial borders,Footnote 24 which allows the use of a geographic regression discontinuity design (rdd), among other empirical tools. In addition, this period of foreign rule includes 1850–1918, which is seen as the crucial time for the development of modern bureaucracies.Footnote 25
Another reason Poland is an appropriate case for a study on imperial legacies in bureaucratic organization is that its communist regime (1948–1989), which controlled the country in the aftermath of World War II, aimed for complete administrative homogenization using repression and political control to achieve its goals.Footnote 26 Four decades of communist repression and control should go far in wiping out imperial legacies, making a study of Poland a hard case for testing the long-term effects of foreign rule.
Imperial Partition of Poland (1815–1914)a

I find substantial regional variation in the performance of public administrations across Poland in the present day. Specifically, even though public administrations within the country are expected to deliver the same outputs (public goods and services) based on the organizational tasks assigned to them, the number of employees needed to conduct those tasks shows great regional variation. Multiple empirical techniques, including geographic rd analyses and matching, reveal that imperial legacies affect bureaucratic performance in multifaceted ways. Public administrations in the former Russian partition are characterized by the lowest levels of efficiency and meritocracy, indicating that there are negative long-term effects of nineteenth-century Russia’s highly corrupt and inefficient institutions. Moreover, I find some (but not conclusive) evidence that the bureaucracy in the former Austrian partition, which evolved from a decentralized model, is more efficient than bureaucracies in both the former Russian and Prussian partitions, lending additional limited support to the view that decentralized rule has positive developmental effects in the long run.
This article is organized as follows. To begin, I present a brief literature review. Then I discuss differences in the imperial bureaucracies and propose multiple hypotheses. After presenting the historical back-ground, I focus on the mechanisms of path dependence that could account for persistence in bureaucratic characteristics. I then introduce the research design, data set, and multiple techniques of empirical analysis in the empirical section. A discussion of the results of the empirical analyses follows, and the final section concludes. Additional discussions, robustness checks, and other supporting documentation are included in the supplementary material.Footnote 27
II. Imperial Legacies in Public Administration
Why would we expect legacies of empires in public administration? The characteristics of bureaucracies are known for being highly persistent, with qualitative and anecdotal evidence coming from work on France and Britain,Footnote 28 Germany,Footnote 29 the US,Footnote 30 and Russia,Footnote 31 as well as from several comparative studies.Footnote 32 These insights can be placed within a broader literature on the persistence of social institutions.Footnote 33
Comprehensive work on the relationship between imperialism, bureaucracies, and development exists in the field of public administration,Footnote 34 for example on Africa,Footnote 35 British legacies in the Asia-Pacific,Footnote 36 the impact of wars,Footnote 37 and Napoleonic rule,Footnote 38 but little quantitative evidence on imperial legacies is provided. As such, combining qualitative and quantitive evidence in a rigorous research design to comprehensively assess the persistence of bureacratic characteristic should be of interest.
Considering the shortcomings in the literatures described above, this article exploits the quasi-randomness of imperial borders in Poland to assess the long-term impact of external rule on present-day public administrations. Due to common language and legal-institutional framework, unobserved heterogeneity in the units of analysis is not as significant a problem in my research as it is in many other cases.Footnote 39 In addition, contrary to most existing studies, I measure bureaucratic characteristics directly instead of measuring the perceptions or consequences thereof.
Empirically, I focus on measurements of efficiency and meritocracy. One public administration is more efficient than another if it requires fewer human or financial resources to achieve the same outcomes. Moreover, a high level of meritocracy means that a public administration should be able to attract a large pool of applicants and thereby increase competitiveness of recruitment. A high level of meritocracy in recruitment has been shown to lower corruptionFootnote 40 and to increase economic growthFootnote 41 and business entry rates.Footnote 42 I discuss the operationalization of these concepts below.
A number of existing studies assess historical legacies in Poland. Irena Grosfeld and Ekaterina Zhuravskaya find several discontinuities at the former imperial borders.Footnote 43 Specifically, the formerly Prussian areas experience stronger support for anticommunist parties, whereas people in the formerly Austrian parts vote for more conservative and religious parties compared to voting patterns in the formerly Russian area. Similarly, Paweł Bukowski finds that in the vicinity of the historical borders, 6th grade and 9th grade students in the former Austrian partition score significantly higher on standardized tests than students in the former Russian partition.Footnote 44 Grzegorz Ekiert and Stephen Hanson analyze communist legacies in Poland and other Eastern European states, and Grigore Pop-Eleches and Joshua Tucker discuss different pathways through which those legacies perpetuate.Footnote 45 Additionally, Sarah Cramsey and Jason Wittenberg show that Polish elites forcefully “polonized” minority groups in the interwar period, and Michael Bernhard investigates the origins of Polish democratic opposition under socialism.Footnote 46 Other studies on the legacies of historical events include a contribution by Monika Nalepa and Pop-Eleches, who investigate the effects of population resettlement on the ability of the communist regime to infiltrate the Catholic church, and research by Volha Charnysh, showing how historically rooted levels of antisemitism influence attitudes toward EU policies.Footnote 47 Although these studies uncover historical legacies, ranging from imperial rule to postwar politics, none focuses on bureaucracy.
III. Historical Background: The Case of Divided Poland
In this section, I present an overview of Poland’s history and the imperial partitions, beginning with a discussion of border placement, to make the case for a geographic rdd, and including an analysis of the administrative systems of the three imperial powers.
The Placement of the Imperial Borders
When Poland was divided by Prussia, Austria, and Russia in 1795 and again in 1815—the latter as a consequence of the Napoleonic Wars—the borders were set without “the consideration of historical, ethnic, economic, or geographic factors.”Footnote 48 The placement primarily reflected the overall balance of power, did not overlap with any previous administrative boundaries, and even split several large estates. For these and other reasons, Grosfeld and Zhuravskaya conclude, “there is no reason to believe that social and economic outcomes at that time exhibited any jumps at the established frontiers.”Footnote 49 Moreover, these scholars, “using a wide list of geographic characteristics,” do not find statistically significant differences in those characteristics across the borders, with the exception of a minor jump in elevation between Austria and Russia.Footnote 50 Sascha Becker and colleagues use data on medieval city size, access to trade routes, and presence of a medieval diocesan town to support the notion that the Habsburg imperial border was quasi-random.Footnote 51
The Prussian Administrative State
In the nineteenth century, the Prussian administrative state was characterized by a high level of efficiency and meritocracy.Footnote 52 A rigorous legal framework governed its operation, a law degree was required for public service, competitive examinations were held, and an independent commission approved all applicants.Footnote 53 Thus, the Prussian bureaucracy was among the most modern in the world.Footnote 54 Moreover, Prussian bureaucrats enjoyed a reputation of “incorruptibility.”Footnote 55 Accordingly, Prussia’s bureaucracy was “extremely well organised and efficient.”Footnote 56
Beginning in 1794, Prussian administrative structures, including Prussian laws (Preußisches Landsrecht), were imposed on Poland’s western territories.Footnote 57 After 1815, limited autonomy was given to the province of Posen (Poznań), including the hire of Polish administrators.Footnote 58 But even Posen was eventually integrated into the Kingdom of Prussia. In 1876, a new policy of germanization began, imposing German legal and cultural institutions and making German the official language of the administration, courts, and most schools.Footnote 59
The Austrian Administrative State
In the eighteenth century, Austria implemented a series of reforms aimed at creating a more efficient administration.Footnote 60 The result was “a relatively well-functioning, respected bureaucracy.”Footnote 61 Alan Taylor describes the bureaucracy as hardworking and honest but also points out that it suffered from the production of mountains of paper work and other such flaws common to most modern administrations.Footnote 62 Although reforms stalled in the nineteenth century and corruption could not be entirely eliminated, the bureaucracy was comparatively meritocratic, offering positions and promotions to non-nobles.Footnote 63 Accordingly, the Habsburg bureaucracy was relatively efficient, but also had certain weaknesses.Footnote 64
In the 1780s and 1790s, Austria introduced its administrative system, staffed with Austrian bureaucrats, to its newly acquired territories in Polish Galicia, and implemented political censorship and repression.Footnote 65 In the first half of the nineteenth century, Austria made few concessions to the Poles and put a heavy tax burden on the relatively poor region.Footnote 66 After 1815, Austria retained Old Galicia (while giving up New Galicia, a territory it had controlled between 1795 and 1809, but which now became part of the Russian partition) and the contested city of Kraków was given the status of a republic under the trilateral protection of Prussia, Russia, and Austria—a status that lasted until 1846.Footnote 67
Iryna Vushko argues that despite the initially high levels of repression, not all Austrian bureaucrats had antagonistic relationships with the local population of Poles; some even developed strong ties to local elites.Footnote 68 Furthermore, the 1848 Austrian revolution led to progressive reforms by Vienna.Footnote 69 Beyond this first set of progressive reforms, following major military defeats of Austria in 1859 by France and the Kingdom of Sardinia and in 1866 by Prussia, a significant level of self-governance by the Poles was allowed.Footnote 70 This new strategy included both the local control of bureaucracies and the presence of Galician representatives in Vienna.Footnote 71 Accordingly, the public administration in Galicia was characterized by substantially higher levels of decentralization, which was appreciated by the Poles.Footnote 72
The Russian Administrative State
In contrast to Austria and Prussia, nineteenth-century Russia had a highly inefficient public administration.Footnote 73 Both social selectivity and patronage were much more predominant than in Prussia or Austria, while aspects of meritocratic recruitment (educational requirements, competitive examinations, and independent commissions) were either underdeveloped or nonexistent. Thus, the levels of meritocracy and efficiency were significantly lower than in the Prussian and Austrian bureaucracies, whereas corruption and arbitrariness were omnipresent.Footnote 74 Moreover, the hierarchical, military-like administrative structures systematically undermined personal initiative, and “[e]specially at the lower levels, the bureaucracy was radiantly corrupt.”Footnote 75 In general, “Russia was … characterized by the least efficient administrative apparatus … of the three empires.”Footnote 76
When Russia first acquired territory in northeastern Poland in 1772—and in 1796, after the third partition of Poland—it created new administrative provinces called gubernias.Footnote 77 But due to a “shortage of Russian administrators” and the absence of “a body of codified laws,” associated with an inability to build a modern public administration, Russia was initially unable to pursue a policy of russification.Footnote 78 This lack of administrative capacity also meant that compared to Prussia or Austria, the extent and quality of public goods was severely restricted.Footnote 79
The Congress Kingdom of Poland, founded in 1815, initially enjoyed administrative autonomy but this status ended when an uprising occurred in 1830–1831, leading to a period of repression.Footnote 80 During that time, Russia maintained the partition as an administrative unit of its core state but simultaneously “abolished the constitution, the Sejm [parliament] and the Polish army.”Footnote 81 It was a major defeat for the Polish desire for self-governance. Subsequently, the Russian army policed the partition with the aim of preventing another military uprising.Footnote 82
The Crimean War (1854–1856) led to administrative reforms within the Russian Empire. The central state began to monitor local governments more actively. But this did little to cure inefficiency and corruption, which in turn placed a great burden on the partition’s underdeveloped economy.Footnote 83 In part due to the war, Russia made limited concessions to the Poles.Footnote 84 Perceiving a weakened Russian state, the Poles took up arms against Russian rule in 1863 but were ultimately defeated.Footnote 85 As a consequence, previous concessions were dramatically scaled back and Russian was introduced as the official language of the administration, schools, and courts.Footnote 86 Russia then forcefully “pursued policies aimed at full standardization, conformity, and assimilation without any regard to the Polish culture and traditions.”Footnote 87
Operationalizing Efficiency and Meritocracy
Accordingly, stark differences in the levels of efficiency and meritocracy can be observed in the historical Prussian, Austrian, and Russian partition administrations in Poland. In this section, I focus on how these theoretical concepts can be operationalized to assess possible imperial legacies in the present day.
Operationalizing Efficiency
When measuring efficiency, we can focus on input (human resources used) or output factors. In the case of present-day Polish communes (gmina), a focus on input factors is more appropriate for the following reasons. With the exception of county-level (powiat) cities, all communes in present-day Poland have the same legally required set of outputs (organizational tasks) in terms of public goods and services. These include, for example, waste management, the maintenance of roads, and fire protection.Footnote 88 County-level cities provide additional services to citizens, such as issuing vehicle registration certificates. Given the uniformity of expected outputs that public administrations are required to deliver, I use the number of public administrators per one thousand inhabitants as a measure of inputs (of human resources). From an input-centered perspective, a more efficient public administration needs fewer employees to fulfill the standard set of organizational tasks.Footnote 89 Some geographic characteristics might influence the use of public services (and thus the number of required civil servants), but there are no significant geographic differences at the imperial borders.Footnote 90
The measurement of efficiency used in this article is not novel. If the expected outputs are held constant, the size of administrative organizations in terms of personnel—the key input factor—is often considered a possible measure of their efficiency.Footnote 91 Studies also show that larger public bureaucracies are frequently associated with more corruption and lower levels of economic growth, strongly supporting the notion that—holding all else constant, and especially output factors—personnel size is a good measure of administrative efficiency.Footnote 92
Operationalizing Meritocracy
In line with the argument that meritocracy has a strong effect on bureaucratic efficiency, Ernesto Calvo and Victoria Murillo and Juan Diaz imply that larger (or less efficient) bureaucracies could also suffer from patronage recruitment.Footnote 93 Meritocracy is associated with the level of selectivity in the application process, including the number of applicants per job. Therefore, to more directly measure meritocracy, I use two indicators. The first is the number of applicants relative to the number of job openings at the clerk level (urzędnik). More candidates per job increase the competitiveness/selectivity of the recruitment procedure. This measurement reflects both (1) the efforts of the public administration to find qualified candidates and (2) the attractiveness of working in it. In places where efforts to find qualified candidates are low and in places where the public administration is seen as inefficient/not prestigious, it attracts fewer candidates. The operationalization used for the second dimension of interest is also not novel. For instance, with respect to the American college admissions system, the number of applicants per position is considered a good measurement of competitiveness.Footnote 94
The second measurement is the number of distinct channels that a bureaucracy uses to advertise open positions (for example, on a website, in stores, or in print media). An administrative culture with high levels of meritocracy is reflected by extensive advertisement of positions to attract the most qualified candidates. In Poland, local public administrations are legally required to advertise open positions on their websites, and additional advertisement is at their discretion.Footnote 95
Accounting for Interwar Germany
I need to account for an important historical development resulting from World War II that could influence my analysis. After the war, many borders shifted. These changes included the boundaries of Poland and Germany. Former Prussian lands with German majorities were given to Poland. Associated with these transfers were massive population resettlements, primarily moving people from the eastern parts of Poland (the Russian partition and Eastern Galicia) to communes that had been part of interwar Germany (1918–1939).Footnote 96
Due to these comprehensive resettlements, I cannot treat communes of interwar Germany in the same way as the Prussian communes that became independent after World War I (which typically had a Polish population majority). Since my mechanisms of intertemporal transmission rest on sociocultural factors (as described below), I would expect significant differences between the communes of Prussia that belonged to interwar Poland and those that belonged to interwar Germany. Accordingly, I take this factor into account in the empirical analysis.
Summary and Hypotheses
To summarize, in relative terms, Prussia had a highly efficient and meritocratic public administration. Austria’s administration was comparatively efficient and meritocratic, but was characterized by significantly higher levels of local autonomy and administrative decentralization. And Russia’s public administration was the least efficient and the least meritocratic of the three empires.
The low levels of meritocracy and efficiency in the Russian administration—also reflected by widespread corruption and arbitrariness in decision-making—led to a comparably low level of legitimacy of Russian bureaucratic institutions. This likely had a negative effect on citizen perceptions and the self-selection of qualified applicants into administrative jobs, potentially resulting in long-term and self-reinforcing decreases in bureaucratic efficiency.Footnote 97 Therefore, based on the operationalization above, I generate three hypotheses with respect to the present-day public administration.
Hypotheses 1–3
Compared to communes in the formerly Russian parts of Poland, we expect the local public administrations in the formerly Austrian or Prussian areas to have fewer public employees per one thousand inhabitants (H1), to have a larger pool of applicants for administrative jobs (H2), and to use more channels of advertisement (H3).
When compared to Prussia, higher levels of local autonomy and decentralization in the Austrian administration led to a higher perceived legitimacy of Austrian institutions by the Poles. Consequently, interactions between bureaucrats and citizens were less antagonistic, which may have beneficial long-term consequences for the public’s view of bureaucracies and the self-selection of qualified applicants into administrative jobs, perpetuating bureaucratic efficiency. Moreover, it has been theorized that more decentralized forms of external rule lead to superior long-term outcomes, in part because they make cooperation, coproduction, and self-administration easier.Footnote 98 Accordingly, based on the operationalization above, I generate three hypotheses with respect to the present-day public administration.
Hypotheses 4–6
Compared to communes in the formerly Prussian parts of Poland, we expect the local public administrations in the formerly Austrian parts to have fewer public employees per one thousand inhabitants (H4), to have a larger pool of applicants for administrative jobs (H5), and to use more channels of advertisement (H6).
IV. Mechanisms of Intertemporal Transmission
Which specific mechanisms of intertemporal transmission could be responsible for persistent imperial legacies in Poland’s public administration?
When considering the historical period of interwar Poland (1918– 1939), it is important to note that the nascent Polish state was slow to develop a new and unified legal framework to govern its public administration. Despite a process of (formal) unification in administrative procedures, for several years the former partitions of Poland maintained distinct legal-administrative traditions—primarily based on the former colonizers’ systems.Footnote 99 This means that the quasi-experimental treatment of distinct historical administrative systems persisted well into the 1920s.
Because human capital and administrative culture also matter for bureaucratic organization, a relevant fact is that there was significant continuity in personnel after the disintegration of the empires. Historical statistics from 1923 reveal that in each of the partitions approximately one-third or more of all civil servants had been working in the public administration since the period of external rule. Specifically, the Central Statistical Office of Poland provided the following data on civil servants who had been working at the public administration for six or more years in 1923: 32.7 percent in Central Poland (formerly under control of Russia), 32.1 percent in Western Poland (formerly under the control of Prussia), and 70.3 percent in Southern Poland (formerly under the control of Austria).Footnote 100 Accordingly, both formal and informal aspects of bureaucratic organization persisted well into the 1920s, extending the distinct administrative systems into the Second Polish Republic and contributing to the perspective that administrative culture was a key aspect of intertemporal stability in bureaucratic organization.
Since Poland did not have a unified legal framework in 1923, a comparison of the relative number of employees per capita is less meaningful than in the subsequent communist and postcommunist periods. But if we simultaneously compare differences in outputs, such an analysis can reveal important patterns. Most important, even though the Russian administrative state had been significantly less extensive in the provision of public goods and services, historical statistics about the number of province (voivodeship) and county administrators show that the former Russian partition approximated the former Austrian and Prussian partitions in personnel size.Footnote 101 Although Austria and Prussia had provided vastly more outputs,Footnote 102 in the years after the disintegration of the empires, there was only a small difference in the number of administrators between the formerly Russian parts of Central Poland—with an average of 0.16 administrators (per one thousand inhabitants)—and the formerly Austrian and Prussian partitions—with 0.25 and 0.29 per one thousand, respectively.Footnote 103
In light of the operationalization of efficiency discussed above, which is based on the relationship of the provided goods and services (outputs) to the human resources used (inputs), the administration in the formerly Russian parts was clearly inferior. Historically, it had not only performed substantially below its Western counterparts, but often had a negative impact on its surroundings due to severe corruption.Footnote 104 If we compare these vastly inferior and even negative outputs (including extraction of wealth) to the number of administrators that approximated the Western partitions, it is clear that the efficiency of the public administrations in the formerly Russian parts was subpar.
Similar patterns can be observed with respect to civil servants broadly defined (including judicial personnel and tax administrators, among others, but excluding teachers and professors). The number of civil servants in the former Russian partition (1.36 per one thousand inhabitants) approximated the former Austrian and Prussian partitions (which had an average of 1.85 and 1.84 per one thousand, respectively).Footnote 105 Overall, these numbers indicate that the administrative state in the former Russian partition, despite being far less productive in terms of public goods (and far more extractive and corrupt), approximated the bureaucracies in the former Austrian and Prussian partitions regarding personnel size.
World War II and the transition to communism were highly disruptive to the Polish political system, and the latter also meant a homogenization of legal-administrative frameworks across the country. If path dependence in bureaucratic organization holds, the suggested patterns in personnel size (as a measure of efficiency) should be fully observable in this period due to a streamlining of expected outputs.
Specific numbers regarding the employees of local public administrations are available for 1968.Footnote 106 When combined with population statistics, we observe the following patterns:Footnote 107 The province Krakowskie, which overlaps with the former Austrian partition, had a relatively low number of 1.58 local public administrators per one thousand inhabitants. Similarly, the province Katowickie, which was split between all three empires but with a substantial Austrian part, had 1.51 local administrators per one thousand inhabitants. Only the mostly Austrian province, Rzeszowskie, is an outlier with 2.04 administrators, leading to an average of 1.71 per one thousand inhabitants in these three territories. The provinces that overlap with the Prussian partition to the greatest extent (Koszalińskie, Szczecińskie, Zielonogórskie, Olsztyńskie, Opolskie, Gdańskie, Wrocławskie, Bydgoskie, and Poznańskie) had an average value of 1.77 per one thousand inhabitants. Finally, the provinces that primarily overlap with the Russian partition (Białostockie, łódźkie, Lubelskie, Kieleckie, Warszawskie) had an average of 1.93 administrators per one thousand inhabitants. These significant relative differences, which can be observed despite a unification in formal institutions, are mostly in line with my expectations.Footnote 108 They also provide support for the view that persisting differences in informal institutions are constitutive for divergence in bureaucratic efficiency. Considering the previous operationalization, the unification of the legal frameworks and the associated streamlining of expected outputs mean that we can more directly compare the number of local administrators as a possible measure of efficiency. Accordingly, in an input/output framework of efficiency, the administrations in the formerly Russian partition also perform substantially below their counterparts in the communist period.
Which concrete mechanisms related to informal institutions could be responsible for the intertemporal stability of administrative organization in Poland? Theoretically, at least two possible channels of transmission exist.
First, the intergenerational transmission of cultural values (historically imposed by the public administrations of the three empires) could have a persistent impact on administrative norms and behavior.Footnote 109 A key mechanism of such transmission is socialization through the family, the workplace, or the broader social environment.Footnote 110 Second, historically formed attitudes toward the state may influence the relationship of individuals with public authorities.Footnote 111 Lenka Bustikova and Cristina Corduneanu-Huci argue that such historically formed views of the state can constitute a long-term equilibrium and have a decisive impact on state-citizen interactions, specifically in terms of clientelism.Footnote 112 Similar to cultural values, social attitudes can be transmitted within the family, the workplace, or social groups.Footnote 113 Additionally, a robust positive perception of public bureaucracies could persistently lead to the selfselection of more highly qualified applicants, creating a self-reinforcing dynamic of higher efficiency and better public attitudes.Footnote 114
Comprehensive empirical evidence demonstrates that cultural legacies of imperial rule persisted throughout the communist period. J. T. Hryniewicz shows that after the disintegration of the communist regime, Poles in the western and southern territories, which had primarily belonged to Prussia and Austria, had substantially stronger beliefs in meritocracy and the market as an allocation mechanism.Footnote 115 People in territories that had primarily belonged to Russia were more likely to view work as a source of financial security rather than as a personal achievement.Footnote 116 Additionally, Grosfeld and Zhuravskaya find that democratic capital and beliefs in decentralized governance are greatest in the formerly Habsburg parts.Footnote 117
These substantial regional differences in norms and values support the position that persistence in culture is likely a driving force in the path dependence of administrative organization, connecting the time of imperial rule to subsequent periods. Stronger beliefs in the market and meritocracy in Poland’s west and south make a hiring selection based on patronage and personal connections less likely. Moreover, since corruption had been a key aspect of regional administrative culture in the Russian partition, it is possible to have amplified corrupt behavior by public officials there both in the Second Polish Republic and under communism.Footnote 118
Furthermore, Tatiana Majcherkiewicz argues that “[present-day] attitudes [toward the public administration] … were formed during the long Partition period that began in 1795 and ended in 1918.”Footnote 119 Since there were significant differences in efficiency, corruption, and legitimacy between the bureaucracies of the three occupying powers, those views likely differ across the partitions. In this respect, Becker and colleagues present empirical evidence that there is path dependence in perceptions of state institutions across the historical Habsburg border, including in Poland.Footnote 120 Persisting positive views of public administration could lead to the self-selection of more and more highly qualified candidates into the applicant pool, which would also reinforce higher levels of efficiency.
With respect to these mechanisms, I also conducted interviews with sixteen experts of public administration and closely related subjects in six cities in Poland. These interviews provide additional support for the mechanisms described above and are discussed in the supplementary material.Footnote 121 It is important to emphasize, however, that my study outlines and illustrates, but does not deliver exhaustive empirical evidence for, the suggested mechanisms of intertemporal transmission. Future studies of these mechanisms will require a comprehensive interdisciplinary account, combining insights and data from cultural anthropology and (organizational) sociology, to explain the observed patterns.
V. Searching for the Legacies of Imperial Bureaucracies: The Empirical Test
Data Collection
I conduct an empirical analysis at the level of the commune. A commune is comparable to a municipality—a more common term in countries in which English is the official language. I used a database of Polish government institutions to identify as many public administrations at the commune level as possible.Footnote 122 I covered more than 90 percent of all communes through the successful extraction of approximately 2,300 e-mail addresses.Footnote 123
My central data collection effort was an electronic survey on various aspects of bureaucratic efficiency and performance. The Warsaw city administration provided helpful assistance in developing the survey, which was then delivered by e-mail to each commune. Respondents were allowed to give approximations when they did not have precise quantities on certain questions. The scope of most questions was limited to 2014 and 2015.
Questions were on the size of the public administration (in terms of number of administrators), the number of job openings at the level of the clerk in 2014–2015, the number of applicants for these positions, the number of distinct channels of advertisement for these positions, and other measures of efficiency (for example, the processing time for vehicle certificate requests). Unfortunately, this processing time cannot be used in the geographic rd analysis because only county-level communes have this task, which meant that only a small number of respondents provided data on this variable.Footnote 124
The data collection process began in late January 2017. The survey was sent to approximately 2,300 public administrations and received approximately 740 responses by late April. Some questionnaires were not filled out in their entirety, meaning that depending on which answers were provided, only 500–680 responses could be used for the analyses.
I removed the capital Warsaw from the sample because its city administration assisted me in developing the survey and, as Poland’s capital, it has many unique characteristics and as such is a potential outlier; it is not comparable to any other Polish city.Footnote 125
In addition to the survey data, I obtained data to control for confounding factors. In the statistical analyses I often use the natural logarithm of the original values to ensure a distribution that is closer to the normal distribution. A detailed description of the covariates for which I obtained data follows. Note that in all regressions that include covariates, there is the possibility of posttreatment bias, which is why I prefer models that do not use covariates or that use only a minimal number of them.Footnote 126 Despite the possibility of posttreatment bias, I include results with covariates for full transparency.
Communal Tax Revenues Per Capita (2013)
I use data on tax revenues because the size of tax revenues per capita can be a proxy for development levels, and wealthier communes may be able to employ more administrators.Footnote 127 I use 2013 because in most cases the dependent variables are limited to 2014–2015.
Population Density (2013)
I use data on population density because lower levels of population density are associated with more rural/agricultural communes, which potentially has an impact on the use and provision of government services.Footnote 128
Average Migration (1995–2013)
I use data on average migration levels (per one thousand inhabitants) because greater/smaller inflows indicate that a commune is more/less attractive, which could affect recruitment levels.Footnote 129
Average Unemployment Rate (2014–2015)
I use data on unemployment rates because high unemployment rates could mean that there is greater interest in public employment (leading to more applicants) and potentially greater pressure on public officials to provide more jobs in the local public administration (leading to larger bureaucracies).Footnote 130
Academic Applicants (2014–2015)
I use data from my survey to compute the share of applicants with a university degree. This may serve as a proxy for the size and quality of local educational institutions.
County-Level City
I control for county status because those cities have additional administrative tasks for which they might need more employees.
Economies of Scale Controls—Commune Type and Population Size
Because larger communes could enjoy economies of scale, I control for it in two different ways. In regressions where the population size is a component of the dependent variable (employees/population), I use categorical variables distinguishing rural communes and urban-rural communes from urban communes. In regressions in which the population size is not a component of the dependent variable (applicants/job and advertisement channels), I use the population size as a more direct and nuanced measurement.
Dummy Variables for Austria, Russia, and Interwar Germany
I use dummy variables for Austria and Russia to assess differences between communes from those empires and Prussian communes. Additionally, due to massive population resettlements after 1945 from the former Russian partition and Eastern Galicia to communes that were part of interwar Germany, I also need to control for historically being in its territory. Considering that the theory rests on sociocultural factors, we would expect to see significant differences between the Prussian communes that were part of interwar Germany and those that were not. In the following sections, I often use the shorthand labels Russian, Austrian, or Prussian to denote communes that were on the territory of the respective empire.
Table 1 shows descriptive summary statistics of variables that are used in the empirical analyses.Footnote 131
Descriptive Statistics: Empirical Analysis

Response Rates and Locations
Survey response rates were 26.7 percent for Russian communes, 29.1 percent for Prussian communes, and 26.0 percent for Austrian communes. These differences in response rates are not statistically significant at the α = 0.1 level, which means that there is no reason to believe that there was systematically different selection into survey participation across the partitions.
Figure 2 shows on a historical map with the imperial borders of 1815–1914 the communes that responded to the survey. We see a geographically balanced sample of responses. Communes that were in interwar Germany are represented by boxes.Footnote 132
Location of Communes and the Imperial Borders of 1900a

Empirical Techniques and Properties of the Regressions
To estimate the magnitude of diverging outcomes between the parts of Poland that were historically ruled by different empires, I use multiple empirical techniques and regression formats, beginning with a simple dummy variable framework. In addition, I use an rdd with distance to the border as the forcing variable. To deal with potential weaknesses of an rd analysis, such as long-term spillover effects at the historical borders, I include a third alternative: matching based on covariates. Although none of these techniques is flawless, if we can discover some results that are consistent across different sets of analyses, confidence in their validity may be strengthened.
Simple Dummy Variables
I begin by using a simple dummy variable framework with the following properties:
 $${y_i} = {\beta _0} + \sum\nolimits_{j = 1}^n {{\beta _1}{\mkern 1mu} empir{e_{ji}} + {{{\bf{x'}}}_i}\beta + \varepsilon } .$$
yi is the dependent variable measured at the level of the commune, i. β 0 represents the intercept.Footnote 133 β j represents the difference between communes that belonged to empire j and those that belonged to the baseline category.Footnote 134 x′ represents a vector of covariates and β a vector of the respective coefficients. In all cases in which Prussia is involved, I add a covariate of interwar Germany as discussed above.Footnote 135
Geographic Regression Discontinuity Analysis
I also conduct an analysis based on a geographic rdd, using distance to the historical border as the forcing variable:Footnote 136
 $${y_i} = {\beta _0} + {\beta _1}{\mkern 1mu} empir{e_{ji}} + {{\bf{x'}}_i}\beta + f(geographic\,{\mkern 1mu} location) + \varepsilon .$$
yi is the dependent variable. The unit of analysis, i, remains the commune. β 0 represents the intercept.Footnote 137 β 1 represents the difference between communes from the compared empires. x′ represents a vector of covariates and β represents vectors of the respective coefficients. In all cases in which Prussia is involved, I add a covariate for interwar Germany as in the simple dummy variable framework. f (geographic location) is one of two functions of the geographic location of the commune that are described below.
Distance to Border
The first function of geographic location represents the air distance to the historical border:
 $$f(grographic\,location)\, = \,{\gamma _1}\,distance\,to\,borde{r_{i\,}} + \,{\gamma _{2\,}}distance\,to\,borde{r_i}\,*\,empir{e_{ji}}.$$
Here, the distance to the border is measured as the shortest absolute distance in kilometers to the historical imperial border. In each comparison, distance values are negative for one empire and positive for the other. Coefficients are represented by γ.
Latitude/Longitude and Polynomials
Additionally, following Melissa Dell, I also use a function where location is a measure of latitude and longitude, as well as interactions and polynomials of those variables:Footnote 138
 $$\matrix{
{f(geographic\,{\mkern 1mu} location) = {\gamma _1}x + {\gamma _2}y + {\gamma _3}{x^2} + {\gamma _4}{y^2} + {\gamma _5}xy + {\gamma _6}xy + } \cr
{{\gamma _7}x{y^2} + {\gamma _8}{x^3} + {\gamma _9}{y^3} + {\gamma _{10}}{\mkern 1mu} distance\,{\mkern 1mu} to\,{\mkern 1mu} borde{r_i} + } \cr
{{\gamma _{11}}distance{\mkern 1mu} \,to\,{\mkern 1mu} borde{r_i}*empir{e_{ji}}.} \cr
} $$
In this framework, x represents a commune’s latitude and y represents its longitude. Coefficients are again represented by γ.
Matching
Although there is strong support for the quasi-randomness of the imperial borders that separated Poland in the nineteenth and earlytwentieth centuries, a geographic rd analysis relies on the very strong assumption that there were no spillovers in the close vicinity of the historical borders after the disintegration of the empires.Footnote 139 If there were any spillovers, they could lead to convergence in administrative organization close to the imperial borders, which would violate the stable unit treatment value assumption (sutva) and thus negatively affect an rd analysis.Footnote 140
For these reasons, I also implement an alternative to an rd approach, namely genetic matching. In general, matching identifies units in two groups that share a similar distribution of covariates but differ in their treatment, that is, in terms of the imperial power that ruled the respective territory. By ensuring that only units with similar characteristics are compared, we can address an underlying imbalance in covariates that could negatively affect results in the simple dummy variable framework. The potential of such an imbalance, caused by multiple treatment effects of imperial rule, is indicated by results obtained in the supplementary material.Footnote 141 In contrast to an rd approach, matching does not as strongly rely on observations in the immediate vicinity of the historical borders, making it less sensitive to spillover effects in this narrow geographic area. In the analysis below, I rely on genetic matching, which assigns differential weights to the covariates through an evolutionary search algorithm.Footnote 142 The key advantage of this method is that it focuses on optimizing covariate balance instead of simply computing propensity scores (which in many cases does not automatically lead to balance on the covariates).
Count Variables
Finally, since one of my outcome variables—channels of advertisement—is a count variable, in addition to simple linear regressions, I use a quasi-Poisson regression in all three types of analyses outlined above. Quasi-Poisson regression models are based on a standard Poisson regression, which is an appropriate model for count variables. Accordingly, the standard Poisson model is the point of departure for the application of a quasi-Poisson. The former has the following format:
 $$\Pr (Y = {y_i}|{\mu _i}) = {{{e^{ - {\mu _i}}}\mu _i^{{y_i}}} \over {{y_i}!}},\,{y_i} = 0,1,2,\, \ldots .$$
For each observation i, μi is determined by:
 $$\matrix{
{\log ({\mu _i}) = {\beta _0} + {\beta _1}{\mkern 1mu} empir{e_{ji}} + {{x'}_i}\beta + } \cr
{f(geographic\,{\mkern 1mu} location),\,{\rm{and}}} \cr
} $$
 $${\mu _i} = {e^{{\beta _0} + {\beta _1}\,empir{e_{ji}} + {\rm{x}}_i^{'}{\rm{\beta + }}f{\rm{(}}geographic\,location{\rm{)}}}}.$$
All systematic components of the exponent are equivalent to the linear regression models above. In cases in which I do not include covariates or geographic factors, x′iβ or f (geographic location) are omitted, respectively.Footnote 143
When applying a quasi-Poisson regression, the same parameter values for the coefficient estimates (β and γ) as in the standard Poisson model above are obtained. But the standard errors of the coefficients are subsequently adjusted to reflect possible over- or underdispersion of the data. Specifically, while the standard Poisson assumes σ 2 = μ, in the quasi-Poisson, σ 2 = ψμ, where ψ is a parameter that can vary with the actual underlying dispersion of the data.
VI. Empirical Test: Results
Initial Analysis: Simple Dummy Variables (All Partitions)
Table 2 shows the results of the dummy variable regressions (equation 1 and the quasi-Poisson models) when all partitions are compared simultaneously in a single regression. Moreover, Figure 3 illustrates the partition coefficients for the two linear models.Footnote 144
The analysis reveals that depending on the specification, Russian communes have approximately 6 to 9 percent more administrative employees than Prussian communes. These results hold even when controlling for a large number of potentially confounding factors. I obtain a very similar result for communes that were part of interwar Germany (5 to 10 percent more employees than Prussian communes that did not belong to interwar Germany).Footnote 145 This is interesting because most people who were relocated to interwar German communes came from the formerly Russian parts (although some also came from Eastern Galicia), meaning that the results are compatible with the imperial legacies perspective. Austrian communes appear to be the most efficient with approximately 8 percent fewer employees than Prussian communes in the model without covariates.
Furthermore, Russian communes have approximately 17 to 28 percent fewer applicants per job than Prussian communes. Similarly, Austrian communes have approximately 19 to 21 percent fewer applicants than Prussian communes. As we see, in the more rigorous rd models below, this result does not hold. Without covariates, communes in interwar Germany show a similar pattern, but the results are no longer statistically significant when covariates are included.
On average, Russian communes use fewer channels of advertisement than Prussian communes. But in the model with covariates, the associated value is smaller and not statistically significant.
Imperial Legacies: Comparison of All Partitions (Simple Dummy Variables)a

*p < 0.1, **p < 0.05, ***p < 0.01
a ols, quasi-Poisson.
These results provide initial, limited evidence in favor of imperial legacies with respect to public administrations. With the exception of the lower number of applicants in the Austrian partition and the insignificance of channels of advertisement, the results of all models are in the theoretically expected direction. Austrian communes appear to be the most efficient, strengthening the argument that decentralization can positively affect bureaucratic efficiency in the long run. The models with covariates need to be interpreted with caution due to the substantial possibility of posttreatment bias. In the supplementary material, I provide additional tests, including analyses accounting for local political factors and regional gdp, as well as simple dummy variable analyses with direct comparisons between two partitions.Footnote 146
Coefficient Plot: Simple Dummy Variables (All Partitions)

Prussia-Russia Comparison: Full Sample
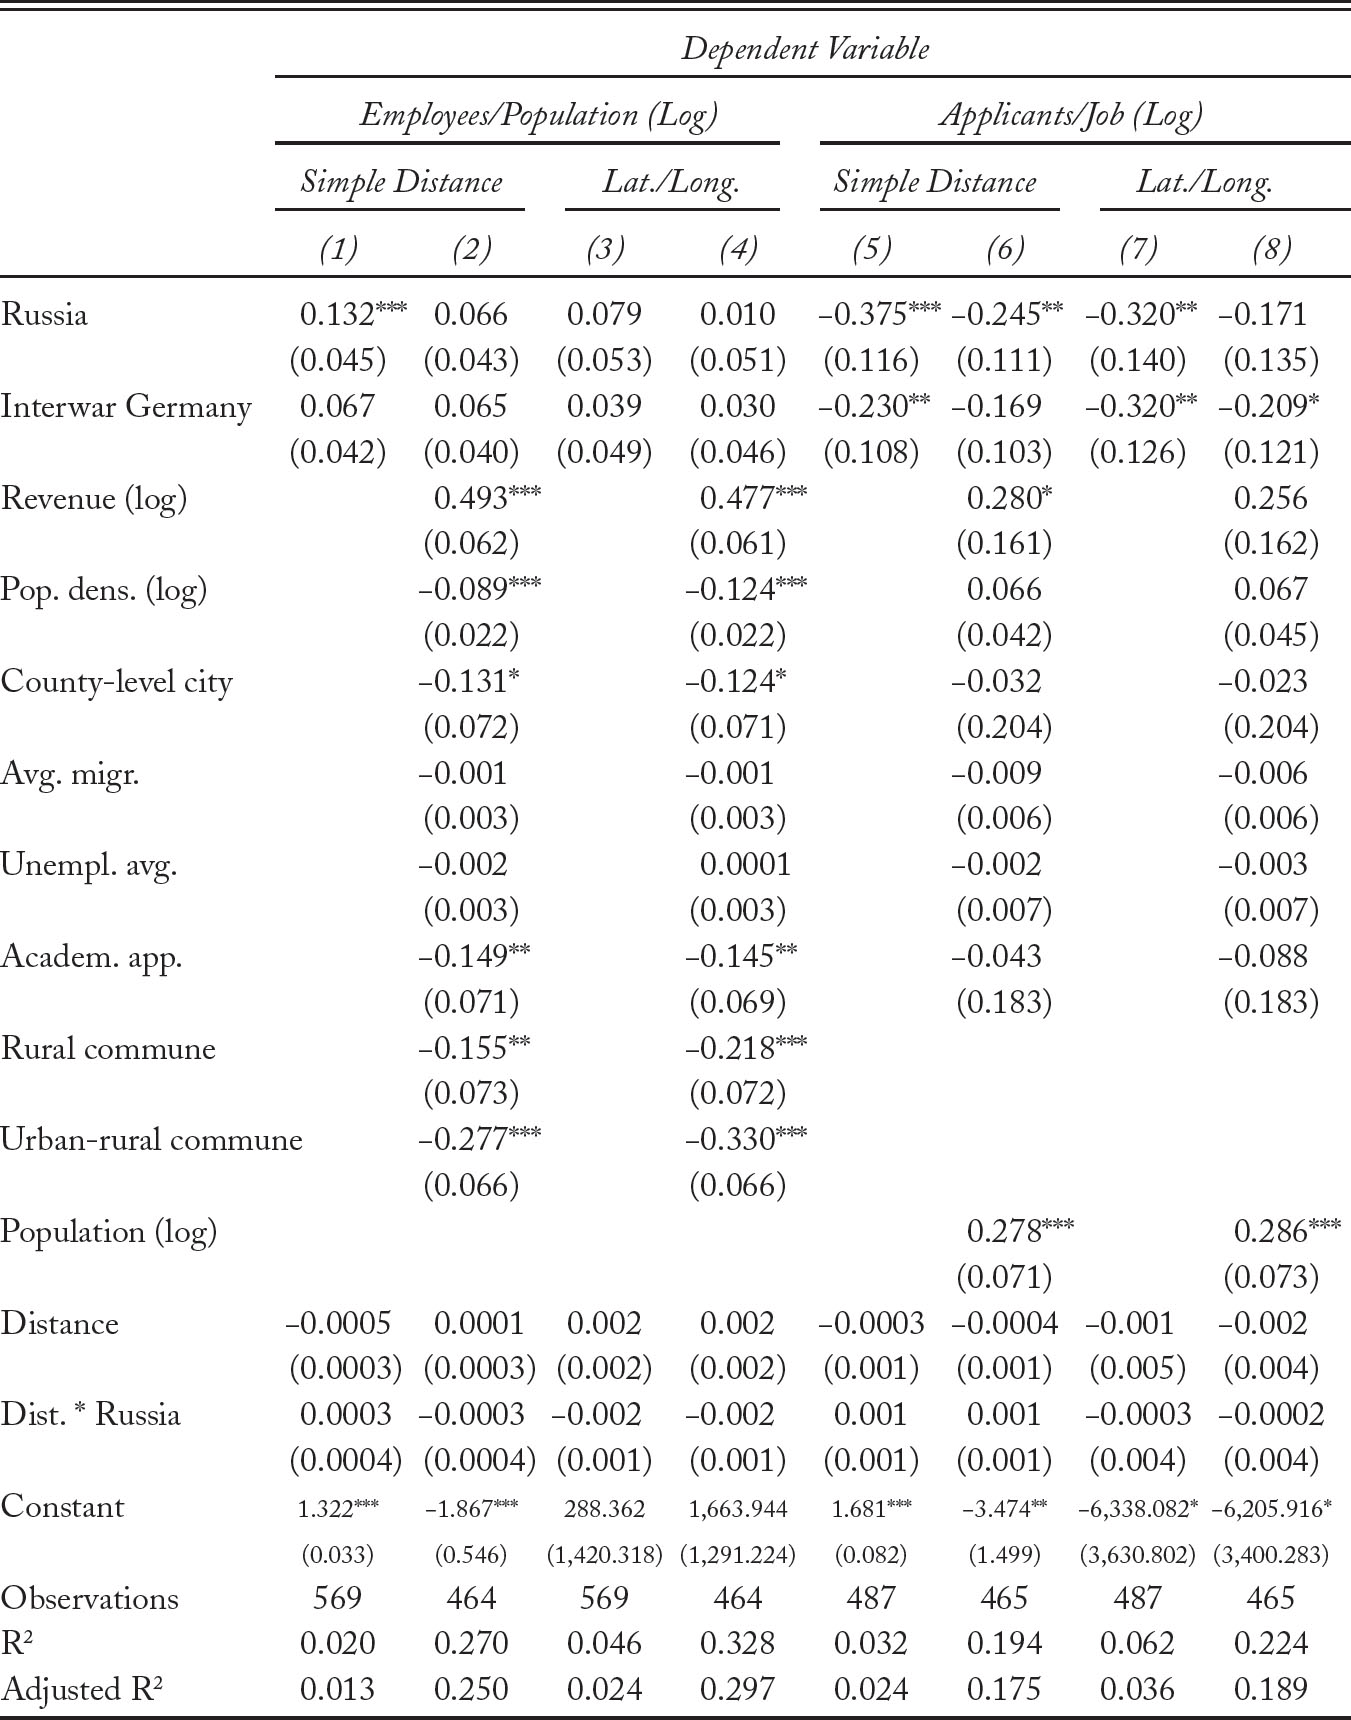
I use the regression with the properties shown in equation 2, with both functions of geographic location introduced above (equations 3 and 4), to measure differences between communes in the formerly Prussian and Russian parts. In terms of public employees, I obtain only mixed results, but all are in the theoretically expected direction (Table 3). The results for applicants/job are stronger than the results for employees/population, generally showing high levels of statistical significance. The substantive effect ranges from approximately 16 percent to approximately 31 percent fewer applicants per job opening in the formerly Russian parts.

In terms of applicants, I obtain statistically significant results for Russian communes and communes in interwar Germany in most empirical specifications. The only exception is the final specification, which includes covariates and the complex measurement of geographic location. It is important to note that the inclusion of covariates also introduces the possibility of posttreatment bias, as indicated above. As this specification has the largest number of covariates, the nonsignificance of the results is most likely in part related to fewer degrees of freedom and a smaller sample size. In general, I obtain evidence for a lasting negative impact of Russian rule.
In the supplementary material, I show that most results hold when introducing distance weights.Footnote 147 I also show that with the full sample there are no statistically significantly results with respect to advertisement channels. But in contrast to the full sample, we see significant effects on advertisement channels in the smaller border samples, as shown below.
Prussia-Russia Comparison: Graphs
Figures 4–9 show the geographic discontinuities based on linear models in terms of all three variables. Negative values denote distances of Prussian communes and positive values denote distances of Russian communes to the historical border. Communes that historically belonged to interwar Germany were removed from these graphs because, due to the historical population resettlements from Poland’s east, they have developed a different sociocultural profile and need to be treated separately.
In the following graphs, no significant effect is visible in terms of employees per population (figures 4 and 5). But we observe a strong legacy effect in terms of applicants per job (figures 6 and 7). It appears that communes in the formerly Prussian territories have significantly more applicants, indicating higher levels of competitiveness and meritocracy in the recruitment process.
Note that with respect to the count variable channels of advertisement (figures 8 and 9), in these and subsequent figures I use a linear model only for illustrative purposes. The results based on quasi-Poisson regressions are more authoritative because they are based on a more appropriate empirical model and do show a significant influence of the key legacy variable (see Table 6 below).Footnote 148
Prussia-Russia Comparison (Full Sample): Employees Per 1,000 Inhabitants (Log)

Prussia-Russia Comparison (Optimal Bandwidth): Employees Per 1,000 Inhabitants (Log)

Prussia-Russia Comparison (Full Sample): Applicants Per Job (Log)

Prussia-Russia Comparison (Optimal Bandwidth): Applicants Per Job (Log)

Prussia-Russia Comparison (Full Sample): Channels Of Advertisement

Prussia-Russia Comparison (Optimal Bandwidth): Channels of Advertisement

Prussia-Russia Comparison: Border Samples
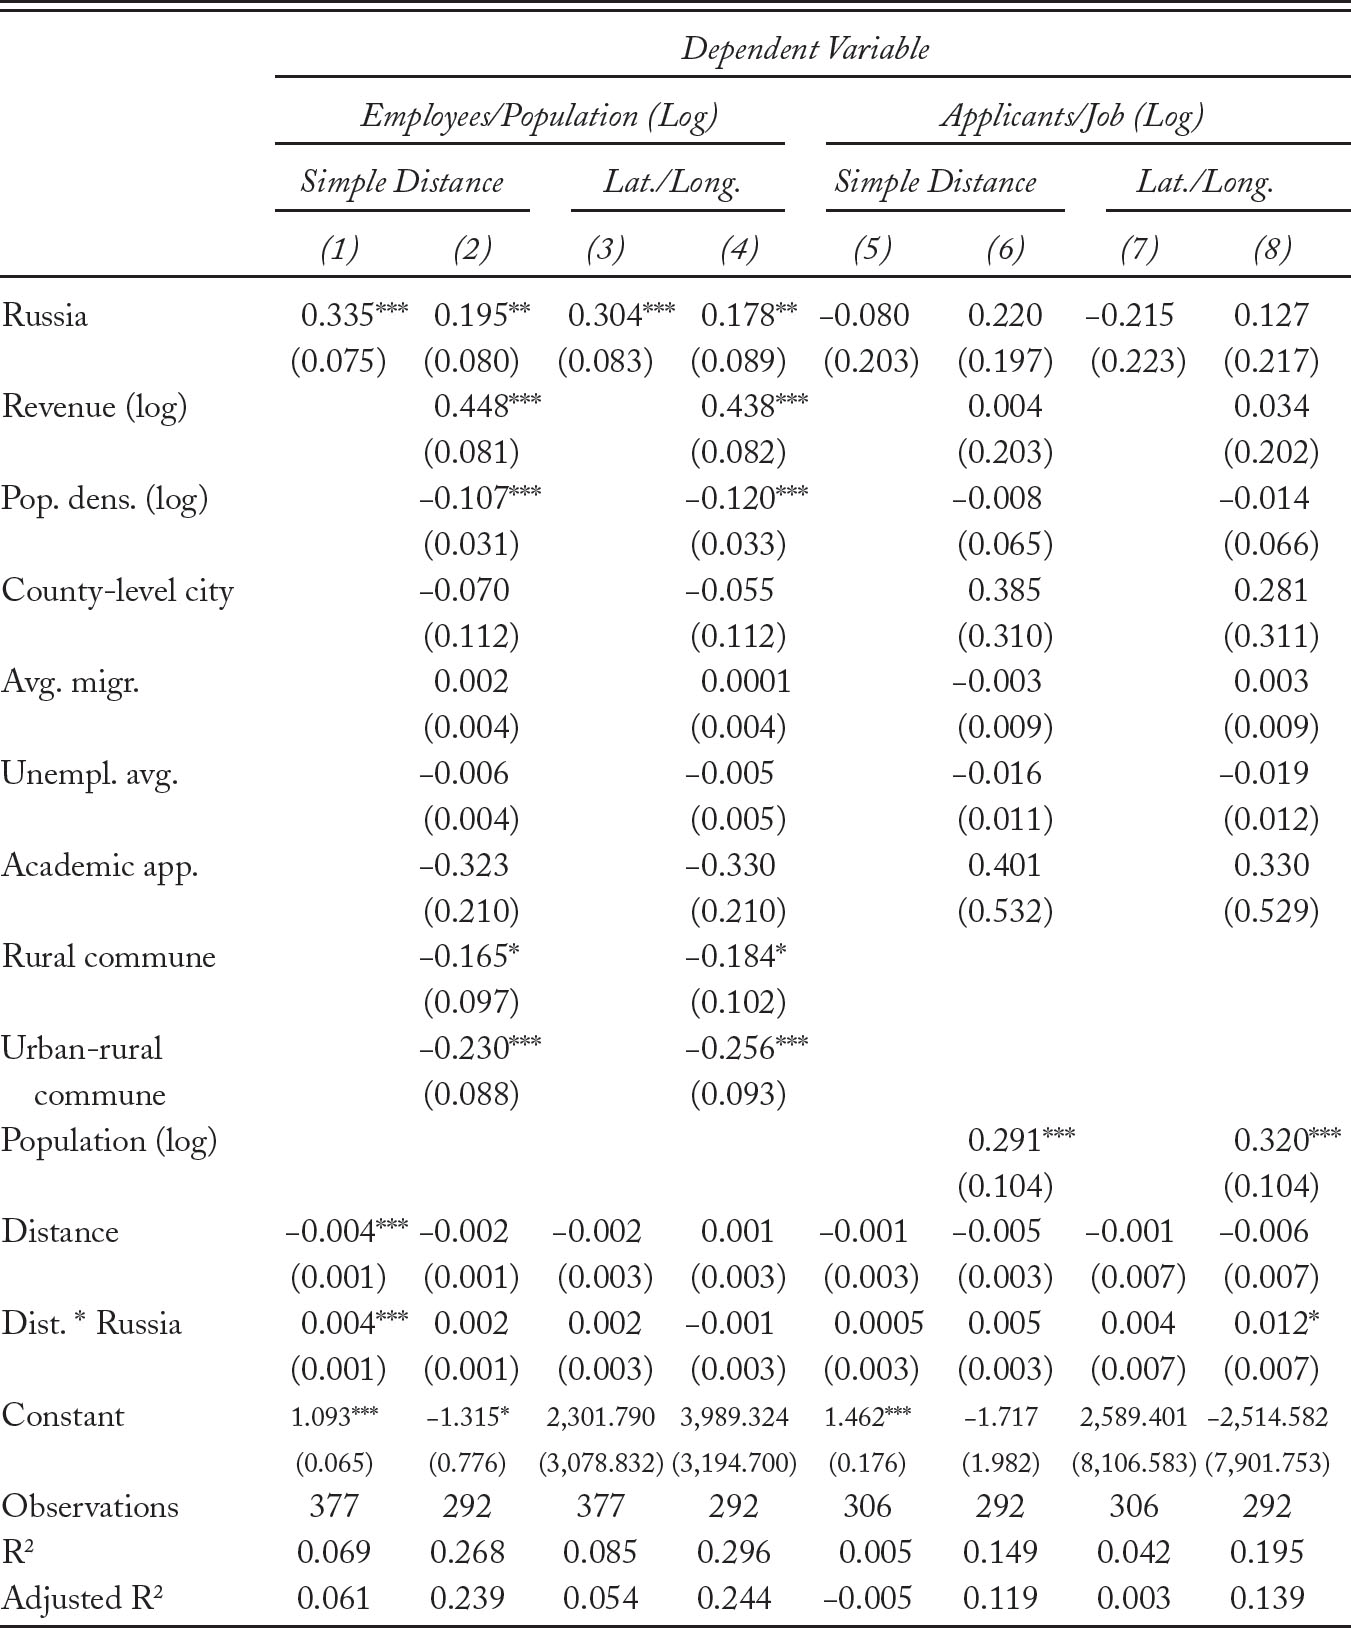
To show that observations farthest away from the border are not driving the results, I estimate regressions with limited samples around the historical border (based on equation 3). I use the estimator by Guido Imbens and Karthik Kalyanaraman in a linear regression framework to identify the optimal bandwidth, and obtain values of approximately 135 km and 155 km for the number of employees and the number of applicants, respectively.Footnote 149 I also obtain a bandwidth of approximately 260 km for the channels of advertisement, but it is too far a distance to make a credible claim with respect to a geographic discontinuity, so additionally I use bandwidths of 100 to 200 km.
Tables 4, 5, and 6 show the results of these regressions; they are mixed but reveal some interesting patterns. Contrary to my expectations, I find that differences in the relative number of employees are not significant in most border samples. But differences in the number of applicants per job are in the expected direction and significant (at α < 0.1) in several samples. The substantive effect ranges from approximatley 18 percent to approximately 25 percent fewer applicants per job. Moreover, communes that were in interwar Germany also perform consistently and significantly worse in terms of the number of applicants. Due to population resettlements from the east after World War II, this can be seen as an indirect sociocultural impact of imperial rule.
In terms of the channels of advertisement, the border samples reveal much stronger results than the regression based on the full sample. In all regressions ranging from 100 to 175 km, I find statistically significant results at a < 0.05 in the expected direction. The substantive effect of the legacy variable is less straightforward to interpret in this case due to the logarithmic link function. The coefficient represents a change in the logs of expected counts, ranging from −.103 to −.217. In general, these results indicate that Russian communes advertise their open positions through fewer channels than Prussian communes.Footnote 150
Austria-Russia Comparison: Full Sample
Here, I compare the formerly Austrian and Russian parts. Table 7 shows that with the full sample there are significant differences with respect to employees. These results hold when including control variables and regardless of the function of geographic location (equations 3 and 4), making this a consistent result. The substantive effect ranges from approximately 19 percent to approximately 40 percent more employees. Thus, on average, local public administrations in the formerly Russian parts are significantly less efficient than those in the Austrian parts.
Prussia-Russia Comparison: Border Sample RD (Employees per 1,000 Inhabitants)a

*p < 0.1; **p < 0.05; ***p < 0.01
a ols.
Prussia-Russia Comparison: Border Sample RD (Applicants per Job)a

*p < 0.1; **p < 0.05; ***p < 0.01
a ols.
Prussia-Russia Comparison: Border Sample RD (Channels of Advertisement)a

*p < 0.1; **p < 0.05; ***p < 0.01
a Quasi-Poisson.
But there are no significant differences in the number of applicants. Two possible reasons for the absence of statistically significant results are (1) the smaller sample size (Austria controlled a much smaller part of Poland than did Russia) or (2) a lower level of uniformity in Austrian rule due to greater levels of local autonomy.
In the supplementary material, I find mixed results in terms of the channels of advertisement between the formerly Austrian and formerly Russian parts when using the full sample.Footnote 151 The results are not significant when a large set of covariates is included, which could be caused by posttreatmeant bias.

Austria-Russia Comparison: Graphs
Figures 10 and 11 show the geographic discontinuity with respect to the number of employees. Negative values denote distances of Austrian communes to the historical border. Positive values denote distances of Russian communes to the historical border. The significant effect of distance to the border in former Austrian Galicia is likely related to the fact that the more distant communes are located in the Austrian mountains.
Austria-Russia Comparison (Full Sample): Employees Per 1,000 Inhabitants (Log)

Austria-Russia Comparison (Optimal Bandwidth): Employees Per 1,000 Inhabitants (Log)

Additional graphs based on quadratic regressions and regarding the other two variables are included in the supplementary material.Footnote 152 When compared to graphs based on linear models, some of these additional graphs using a quadratic regression indicate the possibility of convergence in bureaucratic organization in the immediate vicinity of the historical border. This pattern could be caused by spillover effects, which would violate sutva, and is thus problematic for an rd analysis. I discuss this issue and an option for addressing it below.
Austria-Russia Comparison: Border Samples
I again use the estimator by Imbens and Kalyanaraman to estimate the optimal bandwidth and obtain values of approximately 65 km, 170 km, and 110 km for the relative number of employees, the relative number of applicants, and the channels of advertisement, respectively.Footnote 153 I also use different bandwidths around the optimal ones, typically between 50/75 km and 150/175 km.
As tables 8, 9, and 10 show, there are significant differences between the Austrian and Russian parts of Poland in border samples, including in terms of employees. Communes in the formerly Russian parts have significantly more employees per inhabitant than communes in the formerly Austrian parts, with the substantive effect ranging from approximatley 11 percent to 37 percent. I also find some differences in terms of channels of advertisement (with a change in the logs of expected counts ranging from –.185 to –.332), but little or no difference in terms of the number of applicants. Note that even though the shortest bandwidth of 50 km does not reveal significant results, it is likely at least in part related to the substantially smaller number of observations.Footnote 154
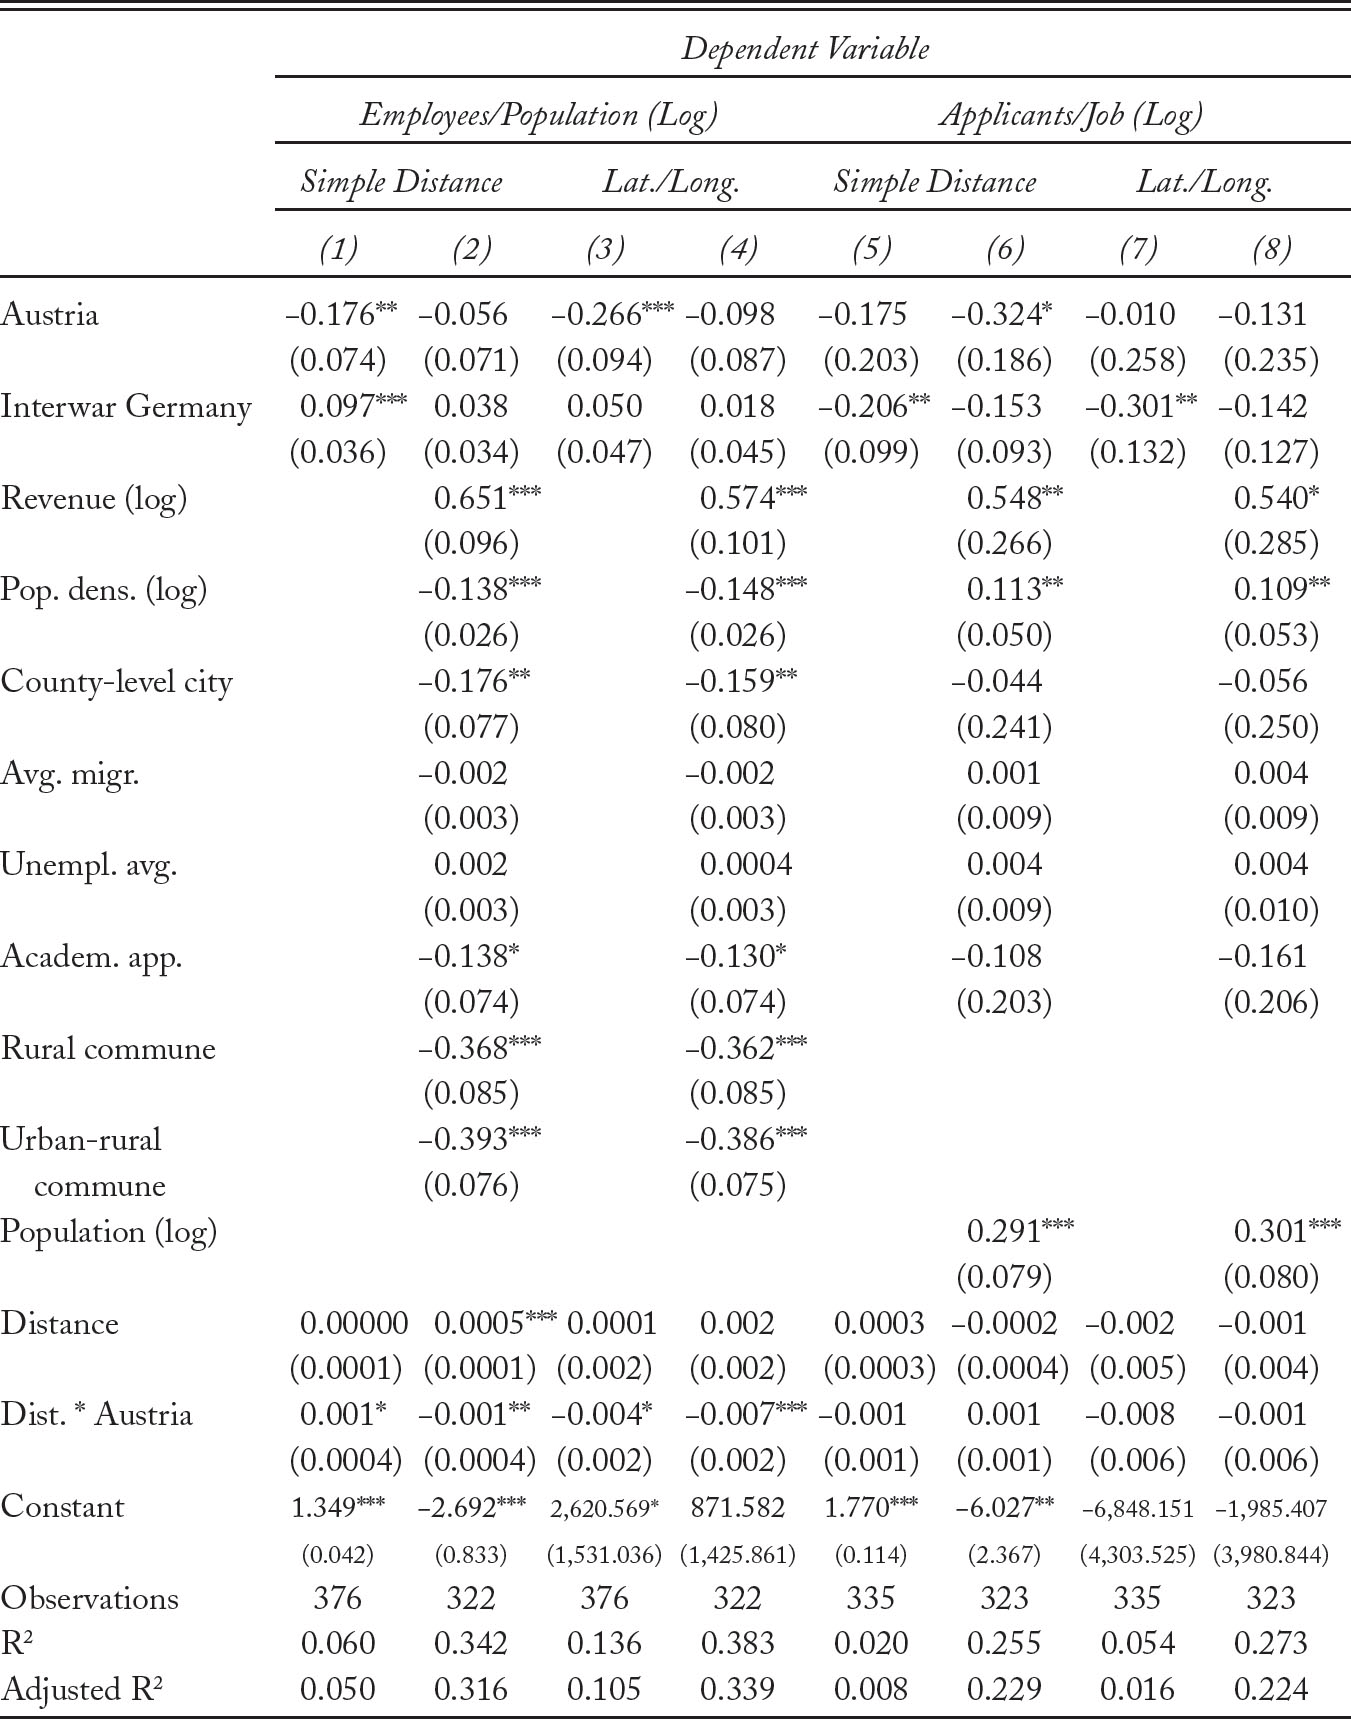
Prussia-Austria Comparison: Full Sample
In the last set of tests, I compare Prussia and Austria (see Table 11). Similar to the Austria-Russia comparison, public administrations in the Austrian communes once again show a significantly smaller size. The substantive effect ranges from approximately 5 percent to 23 percent fewer employees. But I do not find any statistically significant differences in terms of the relative number of applicants or the channels of advertisement. In the supplementary material, I present the results for the latter variable.Footnote 155
Prussia-Austria Comparison: Graphs
Figures 12 and 13 show the geographic discontinuity in terms of employees. Negative values denote distances of Prussian communes and positive values denote distances of Austrian communes to the historical border. Similar to the previous comparison of Prussia and Russia, communes that historically belonged to interwar Germany were removed from these graphs.
In the supplementary material, I provide additional graphs using a quadratic regression and the other two variables.Footnote 156 Similar to the Austria-Russia comparison, these additional graphs indicate the possibility of convergence in bureaucratic organization in the immediate neighborhood of the historical border, which could be caused by spillover effects and therefore remains problematic for an rd analysis. I discuss this issue and a possible response below.
Austria-Russia Comparison: Border Sample RD (Employees per 1,000 Inhabitants)a

*p < 0.1; **p < 0.05; ***p < 0.01
a ols.
Austria-Russia Comparison: Border Sample RD (Applicants per Job)a

*p < 0.1; **p < 0.05; ***p < 0.01
a ols.
Austria-Russia Comparison: Border Sample RD (Channels of Advertisement)a

*p < 0.1; **p < 0.05; ***p < 0.01
a Quasi-Poisson.
Prussia-Austria Comparison: Border Samples
I again limit the sample to specific bandwidths around the historical border. I obtain an optimal bandwidth of approximately 200 km for the number of employees, but use narrower bandwidths of 100 to 175 km as well to assess whether the results hold with smaller samples.Footnote 157
The border samples confirm the notion that communes in the formerly Austrian parts are significantly more efficient than communes in the formerly Prussian parts, with between 13 percent and 20 percent fewer employees (Table 12). Although the shortest two bandwidths do not reveal significant results, it is likely related to the substantially smaller number of observations. In the supplementary material, I provide border samples for the other two dependent variables.Footnote 158

Prussia-Austria Comparison (Full Sample): Employees Per 1,000 Inhabitants (Log)

Prussia-Austria Comparison (Optimal Bandwidth): Employees Per 1,000 Inhabitants (Log)

Matching
A general pattern emerges from the above analysis. When taking the entire distribution into account or when considering broader bandwidths around the imperial border, several different imperial legacies in bureaucratic organization are observed. But when using narrow bandwidths or considering graphs based on quadratic regressions,Footnote 159 these effects become smaller or less significant. In some cases, when moving from a linear to a quadratic regression format, we even observe convergence in bureaucratic organization in the immediate vicinity of the historical borders. These patterns could be explained by spillover effects—in bureaucratic organization or underlying sociocultural factors—at the historical borders that occurred after the period of imperial rule. Such effects are possible, considering that these empires disintegrated more than one hundred years ago, but they violate the important stable unit treatment value assumption.
Prussia-Austria Comparison: Border Sample Rd (Employees per 1,000 Inhabitants)a

*p < 0.1; **p < 0.05; ***p < 0.01
a ols.
If sutva is violated in the immediate vicinity of the historical borders, an alternative empirical test should be conducted. Matching provides such an alternative because it allows us to isolate a specific set of comparison units that are broadly similar in underlying characteristics. At the same time, matching is not as strongly dependent on observations in the immediate vicinity of the historical borders.
To match observations, I use the same set of covariates as in the other regressions in a genetic matching framework. Results of the analysis of matched data can be found in Table 13. They are broadly compatible with the results that were previously obtained. In particular, the performance of communes in the formerly Russian partition in terms of employees/population, applicants/job, and channels of advertisement is worse than the performance of communes in the former Prussian or Austrian partitions. Specifically, Russian communes have approximately 8 percent more employees and 22 percent fewer applicants, and they advertise their open positions through fewer channels than Prussian communes. Furthermore, they also have approximately 15 percent more employees than Austrian communes. These results are similar, though not completely identical, to previous findings, both in terms of the magnitude of the effect and the level of statistical significance. In general, that I obtain similar estimates through a variety of different methods strengthens my overall confidence in the results.
Comparisons Based on Genetic Matchinga

*p < 0.1; **p < 0.05; ***p < 0.01
a Genetic matching, ols, quasi-Poisson.
But while the direction of the effect is the same, genetic matching does not allow me to confirm the previous findings that Austrian communes have a higher level of efficiency when compared to Prussian communes. With respect to the Prussia-Austria comparison, the lower level of statistical significance is likely, at least in part, related to my reliance on a much smaller sample of a little more than 100 observations when first going through the matching procedure. With respect to the channels of advertisement variable, I also cannot confirm some previously obtained results through matching.
Summary
I generally find that communes from the formerly Russian parts of Poland perform worst on all three dimensions of bureaucratic organization discussed here. They are less efficient in terms of their relative size, have fewer applicants per job, and advertise their open positions through fewer channels than communes in either the formerly Prussian or Austrian partitions. I also find limited evidence that Austrian communes are the most efficient in terms of their relative size (even when compared to Prussia), which gives some support to the notion that administrative decentralization can result in long-term efficiency gains for bureaucratic systems. But several sets of analysis turned out to be insignificant, providing more mixed results in specific comparisons or with respect to specific variables. In short, even though the results vary somewhat, depending on the sample size, specification, and covariates, I find sometimes limited support for several of my hypotheses, specifically H1, H2, H3, and H4. At the same time, I am not able to provide sufficient evidence to give even limited support to H5 or H6. In the supplementary material, I present several extensions of my analysis, including (1) comparisons within present-day provinces, (2) analyses accounting for the political affiliation of mayors, and (3) a geographic analysis that weighs distance to the border.Footnote 160 These extensions broadly confirm the results that I have described here.
VII. Conclusion
This article addresses three major issues. The first is the puzzle of regional variation in bureaucratic characteristics and whether this variation might be affected by historical imperial rule. The second relates to the ongoing debate regarding the long-term effects of centralization versus decentralization. The third concerns gaps and problems in the existing literature on imperial legacies in public administration. The most common shortcomings of previous studies are (1) the predominance of indirect measurements of bureaucratic characteristics, (2) high levels of unobserved heterogeneity in the units of analysis, and (3) potential nonrandom selection into treatment. I respond to these deficits by using the case of divided Poland and its quasi-randomly placed imperial borders to directly assess the effects of past imperial rule on present-day bureaucracies. Because of the communist regime’s comprehensive attempts to homogenize the public administration, Poland presents a hard test case. My analyses provide mixed support for the hypotheses and show that the legacies of empires still affect some aspects of contemporary public administrations in Poland, whereas there also is little to no effect in some other comparisons.
Specifically, my finding that public administrations in the formerly Austrian parts are most efficient, especially when compared to Russian communes, indicates that a combination of modern bureaucratic institutions and administrative decentralization can have a positive impact on the long-term performance of bureaucracies. These findings are in line with several recent contributions.Footnote 161
Moreover, communes in the formerly Russian parts of Poland perform worst on several indicators of efficiency and meritocracy. An analysis of historical data from the interwar and communist periods suggests that the observed differences are deeply rooted and have survived different regimes. As existing studies, survey data, and expert interviews show, this persistence can be explained with (1) the endurance of culture (affecting administrative norms) and (2) attitudes toward the bureaucracy (influencing recruitment patterns). That communism was associated with a sustained homogenization of the legal-administrative framework (in combination with the historical patterns observed as well as the results of my interviews) indicates that informal institutions are the most important carrier of persisting regional differences.
My findings are important for political economists—and especially for scholars specializing in developing countries—because bureaucratic performance and efficiency are key factors in successful development. Inefficient bureaucracies can substantially hurt a country’s chances to escape poverty, and low levels of meritocracy can contribute to corruption, decrease the effectiveness of policy implementation, and hinder economic growth.Footnote 162 Corruption and patronage could also lead to antigovernment protests and affect political stability.Footnote 163 Moreover, bureaucratic organization may have a strong effect on other political or legal structures, which are similarly relevant for economic development.Footnote 164
What are the additional implications of these findings? We could potentially observe regional differences in terms of bureaucratic characteristics related to past imperial rule in other parts of the world as well.
Future studies need to go beyond the case of Europe to understand how bureaucratic institutions were imposed on colonies formally separated from a state’s core territory. Another similarly interesting question is the conditions under which decentralization and indirect rule have favorable or unfavorable consequences. Thus, while this article delivers some novel insights into the long-term effects of imperialism on public administrations, much work needs to be done to comprehensively understand the impact of past foreign rule on bureaucracies in different world regions and cultural contexts.
Supplementary Material
Supplementary material for this article can be found at https://doi.org/10.1017/S004388711900008X.
Data
Replication files for this article can be found at https://doi.org/10.7910/DVN/JXOB6N.
Acknowledgments
I thank Mat McCubbins, Georg Vanberg, Eddy Malesky, Erik Wibbels, Jos Raadschelders, and Paweł Charasz for their outstanding support for this research project. I am also grateful to Remigiusz Tworzydło for his support in finding historical statistics and to Karolina Jasińska and the Warsaw city administration for their advice on the survey. Helpful comments have been provided by Andrea Beck, Sascha Becker, Pablo Beramendi, Witold Betkiewicz, Paweł Bukowski, Volha Charnysh, Eddy Cook, Carl Dahlström, Dennis Dobler, Brett Gall, Krzysztof Głowacki, Irena Grosfeld, Herbert Kitschelt, Christian Kleiber, Dave Lewis, łukasz Lewkowicz, Jerzy Lukowski, Elliot Mamet, Frits van der Meer, Jakub Olchowski, Anita Prazmowska, Haru Saijo, Katherine Spruill, Damian Szacawa, Guo Xu, and several anonymous reviewers. Moreover, I am thankful to the experts who participated in interviews. They include Adam Bosiacki, Andrzej Dziadzio, Krzysztof Głuc, Jolanta Itrich-Drabarek, Hubert Izdebski, Marek Krzymkowski, Dorota Malec, Stanisław Mazur, Marek Pietraś, Grzegorz Smyk, Michał Staniszewski, Dawid Sześciło, Anna Tarnowska, Marcin Zawicki, and two employees of the Gdańsk city administration. Finally, I thank the participants of seminars at Duke University, the University of Warsaw, the Kraków University of Economics, Maria Curie Skłodowska University Lublin, and the Institute for Humane Studies.
Funding
The Duke University Graduate School provided generous funding for this research project (award number 2117145).
Author
Jan P. Vogler is a postdoctoral research associate at the Woodrow Wilson Department of Politics at the University of Virginia. His research interests include the organization of public bureaucracies, various forms of political and economic competition (in domestic and international settings), the legacies of imperial rule, and structures and perceptions of the European Union. He can be reached at jv2mc@virginia.edu.