Introduction
There is a continuously growing demand regarding lightweight material design in the aeronautical or automotive industry to reduce material costs and carbon emissions. To cope with these requirements, structural components that undergo cyclic loading are usually designed to be damage tolerant based on the expected number of load cycles during their fatigue life. To follow this design philosophy, a profound knowledge of the fatigue data of the material is necessary, and reliable lifetime prediction models are required [Reference Christ, Fritzen and Köster1]. In the engineering components subjected to repeated cyclic loading, fatigue is caused by progressive damage accumulation; i.e., permanent microstructural and topological changes, which are caused by repeated and partially irreversible cyclic microstrains, take place. This accumulation of microstrains over the increasing number of cycles ultimately leads to fatigue damage [Reference Mughrabi2]. Hence, for the accurate lifetime assessment and prediction of a material, it is imperative to properly model crack initiation and growth under cyclic loading. For a realistic coupling of these two phenomena causing crack initiation and propagation, it is necessary to develop a deep understanding of plasticity and fatigue damage [Reference Aslan, Quilici and Forest3].
The total fatigue life of a component is primarily composed of crack initiation (nucleation and early growth) life and crack propagation life. Mughrabi suggested that in the ultra-high cycle fatigue (UHCF) regime, more focus should be placed on studying fatigue crack initiation rather than describing fatigue crack growth based on fracture mechanics [Reference Mughrabi4, Reference Mughrabi5]. Fatigue crack initiation and short fatigue crack growth are strongly influenced by the underlying microstructural features of the material itself [Reference Tokaji and Ogawa6, Reference Suresh7] and by the heterogeneities of the microstructure such as inclusions and grain boundaries [Reference Bennett and McDowell8, Reference Simonovski, Nilsson and Cizelj9]. However, numerical simulation models correlating these attributes to variability in fatigue crack formation life are surprisingly limited.
In ductile materials, cracks initiate either along slip bands in a grain or at grain boundaries on the surface [Reference Mughrabi2]. Different microstructural features such as grain size, specific grain arrangements, misorientation between grains, voids, or microcracks lead to stress and strain localizations, which are not well-described by the global loading amplitude. Krupp et al. proposed a model to numerically simulate the microcracks, which can take the real microstructural arrangements into consideration, by investigating and quantifying the interactions between the crystallographic misorientation of grain and phase boundaries and microcracks [Reference Krupp, Düber, Christ, Künkler, Schick and Fritzen10]. Furthermore, at the microstructural level, the formation of fatigue damage is strongly directed by irreversible plastic slip [Reference Przybyla and McDowell11]. To include this phenomenon, McDowell and Dunne [Reference McDowell and Dunne12] applied an accumulated plastic strain-based concept to reveal the fatigue crack formation in Ni-based superalloys by using a crystal plasticity model. They showed that the crack nucleation sites observed in experiments matched with the location of maximum accumulated plastic strain obtained after simulations for the same experimental microstructure.
Li et al. used crystal plasticity to compare the location of fatigue crack initiation in the experiments and simulations [Reference Li, Aubin, Rey and Bompard13] and showed that the real fatigue crack initiated at the sites where a significant maximum shear strain amplitude takes place. This can partly verify that the shear strain amplitude at the micromechanical level is essential for crack initiation and that high values of shear strain in the grain may lead to crack initiation. Aslan et al. [Reference Aslan, Quilici and Forest3] investigated crack growth by associating damage for certain planes in FCC crystals with accumulated plastic slip as previously done by Marchal et al. [Reference Marchal, Forest, Rémy, Duvinage, Besson and Moinereau14]. More recently, the accumulated plastic strain-based criterion to accurately predict fatigue crack growth has become important to predict the crack incubation site too. This observation is reported in both modeling-related works [Reference McDowell and Dunne12, Reference Zhao, O’Dowd and Busso15, Reference Zhao, Tong and Byrne16] and experiment-based works [Reference Tong, Lin, Lu, Madi, Tai, Yates and Doquet17, Reference Carroll, Abuzaid, Lambros and Sehitoglu18] for fatigue loading conditions.
Crack growth is often blocked at the grain boundaries such that propagation rates of short cracks vary between relatively high and very low values [Reference Miller19]. Due to such a complex behavior, the application of linear elastic fracture mechanics is of limited usefulness for small cracks [Reference Tokaji, Ogawa, Harada and Ando20]. In the literature, a number of attempts have been made to consider the coupling between plasticity and damage as generally formalized within the continuum damage mechanics framework. The first attempt to model crack growth by using plasticity theory was made by Rice [Reference Rice21]. Further studies about targeting the crack-tip plastic zones in a single crystal grain were performed by Gall et al. [Reference Gall, Sehitoglu and Kadioglu22]. For crystallographic materials, a strong relation between plasticity and crack growth has been shown by several authors [Reference Leverant and Gell23, Reference Crompton and Martin24, Reference Aswath25]. Furthermore, other authors proposed a relatively strong coupling by considering a single associated flow rule for the evolutions of plasticity and damage [Reference Gurson26, Reference Tvergaard and Needleman27, Reference Mahnken28].
Several research groups describe crack evolution under fatigue loading by irreversible slip steps introduced by dislocations, which nucleate from the crack tip. Lillbacka et al. [Reference Lillbacka, Johnson and Ekh29] developed a model for microstructural short-crack propagation in a polycrystal, by assuming that the physical mechanism controlling crack propagation is nucleation of dislocations, leading to crack propagation along a slip system. In [Reference Künkler, Fritzen, Düber, Krupp and Christ30], a dislocation dynamics-based modeling approach is used for the description of crack advancement and its transition to crack growth. Krupp et al. also introduced a method for the simulation of short-crack propagation using the boundary element method [Reference Krupp, Düber, Christ, Künkler, Schick and Fritzen10, Reference Düber, Künkler, Krupp, Christ and Fritzen31], in which crack propagation is modeled via crack-tip saturation displacement, which again is connected to the emission of dislocations from the crack tip and the reversibility of dislocation motion. However, their model did not describe the accumulation of plastic deformation in the initial cycles, which is, however, more important for fatigue crack incubation. Castelluccio et al. [Reference Castelluccio32] proposed another model for the evolution of microstructural short cracks, in which the crack-tip tangential displacement and its normal displacement are not distinguished explicitly. They argue that the crack-tip displacement can be replaced by a suitable fatigue indicator parameter (FIP), which can be evaluated within a finite regime in front of the crack tip. A predictive cohesive zone approach in which plasticity and damage are coupled for modeling creep–fatigue crack growth in single crystals has also been proposed in the literature [Reference Bouvard, Chaboche, Feyel and Gallerneau33]. However, the major advantage of the damage-based modeling approach over the methods with prescribed crack paths, such as cohesive zone model (CZM), is that the damage models could be applied to simulate nonstraight crack paths with branching, crack bifurcation, and even propagation at different locations.
In this work, a computational framework is presented to simulate the crack propagation in polycrystalline materials and to investigate the influence of different numerical and material parameters. A criterion based on the accumulated plastic slip is used to simulate the initiation and growth of fatigue cracks. The framework is applied to synthetic microstructures under cyclic loading. In the following section, we discuss the outline of the constitutive material model comprising crystal plasticity and the damage model for evaluating crack initiation and propagation. Subsequently, the section “Crack growth in polycrystals” provides an overview of the influence of material modeling on cyclic behavior and crack growth behavior followed by the influence of mesh size and applied loading amplitude. Finally, the capabilities of the work and the results are summarized in “Conclusions.”
Material and fatigue modeling
In this section, the basics of the micromechanical model are presented. It geometrically describes the grain structure of a BCC polycrystal with 30 grains having an average size of 60 μm and a standard deviation of 5 μm. The in-plane geometry of the grains is equiaxed, while due to the plane strain nature of the model, they are considered as columnar along the thickness direction. The crystallographic orientations of the grains (Euler angles) are selected randomly. This microstructure model is generated by a so-called dynamic microstructure generator (DMG) [Reference Boeff34, Reference Boeff, Hassan and Hartmaier35], based on a particle simulation tool for distributing the centers for a subsequent radical Voronoi tessellation. Each grain is meshed with 4-node reduced integration type elements under plane strain conditions (CPE4R) using Cubit [36]. Plastic deformation in the individual grains is modeled with the crystal plasticity method, and the fatigue crack initiation and propagation follow the evolution of a damage model. Periodic boundary conditions are applied to the RVE. For the sake of numerical efficiency, we only considered 2D simulations in this work, which already provide important insights on the mechanisms of fatigue crack growth and their relation to the microstructural and numerical parameters.
Constitutive model and crack incubation
The constitutive evolution law for the shear rate postulated by Rice [Reference Rice37] and Hutchinson [Reference Hutchinson38] is given as
 $${\dot{\gamma }^\alpha } = {\dot{\gamma }_0}{\left| {{{{\tau ^\alpha } - \chi _{\rm{b}}^\alpha } \over {\tau _{\rm{c}}^\alpha }}} \right|^m}{\rm{sign}}\left( {{\tau ^\alpha } - \chi _{\rm{b}}^\alpha } \right)\quad ,$$
where  ${\dot{\gamma }_0}$ is the reference shear rate, τα is the resolved shear stress,
 $\tau _{\rm{c}}^\alpha$ is the critical resolved shear stress (CRSS), m is the power law exponent, and
 $\chi _{\rm{b}}^\alpha$ is the resolved backstress on the glide system to include the kinematic hardening effect.
Nonlinear type hardening based on the Frederick–Armstrong model is used for the evolution of the resolved backstress given by
 $$\dot{\chi }_{\rm{b}}^\alpha = {A_1}{\dot{\gamma }^\alpha } - {A_2}\left| {{{\dot{\gamma }}^\alpha }} \right|\chi _{\rm{b}}^\alpha \quad ,$$
where A 1 and A 2 are material parameters.
The isotropic hardening rate is given by
 $$\dot{\tau }_{{\rm{c,iso}}}^\alpha = \mathop \sum \limits_{\beta = 1}^{{N_{\rm{s}}}} {h_0}{\left( {1 - {{\tau _{\rm{c}}^\alpha } \over {{\tau _{\rm{s}}}}}} \right)^n}{M_{\alpha \beta }}\left| {{{\dot{\gamma }}^\beta }} \right|\quad ,$$
describing the evolution of the CRSS. Parameters h 0 and n are the hardening parameter and exponent, respectively, and τs is the saturation shear stress. The interactions of different slip systems are accounted for via the hardening matrix M αβ [Reference Roters, Eisenlohr, Hantcherli, Tjahjanto, Bieler and Raabe39]. For coplanar slip systems with α = β, its value is taken as 1.0, while the value for latent hardening of noncoplanar slip systems is taken as 1.4 [Reference Roters, Eisenlohr, Hantcherli, Tjahjanto, Bieler and Raabe39]. The total accumulated plastic slip (p acc) is given by the time integration of the rate of accumulated plastic slip
 $${p^{{\rm{acc}}}} = \mathop \smallint \nolimits \int \dot{p}{\rm{d}}t\quad .$$
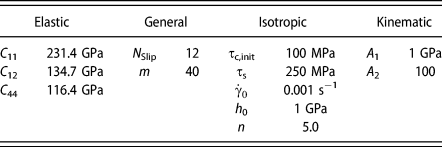
The material parameters used in this work are given in Table I.
Material parameters for ferrite are taken from Inal et al. [Reference Inal, Lebrun and Belassel40] (elastic constants) and Mahmoody [Reference Mahmoody41] (isotropic hardening). Kinematic hardening parameters are adapted for this study.
Damage and crack growth
As proposed by several authors, the total lifetime (N LifeTime) of a component under cyclic loading can be decomposed into three parts [Reference McDowell and Dunne12, Reference McDowell42]. The first part is crack nucleation time (N Nucleation), which is the time to incubate the first crack; the second part is the small crack growth regime, in which cracks are influenced by the microstructure (N MSC); and the third part is long crack growth regime (N LongCracks), in which crack growth is independent from microstructure, so that holds.
 $${N_{{\rm{LifeTime}}}} = {N_{{\rm{Nucleation}}}} + {N_{{\rm{MSC}}}} + {N_{{\rm{LongCracks}}}}\quad .$$
The long crack growth regime (N LongCracks) can be subdivided into a regime governed by linear elastic fracture mechanics and a regime where elastoplastic fracture mechanics is valid due to the evolution of a large plastic zone at the crack tip. The long crack growth regime is not considered here, as the focus is placed on microstructural short-crack growth (N MSC). All fatigue simulations in this work are performed with mean-stress ratio R = −1. Determination of the fatigue-crack nucleation life has already been presented in the previous work of the authors, where the application to different scenarios is described [Reference Boeff, Hassan and Hartmaier35]. Therefore, it will be introduced here briefly.
Degradation of the material is incorporated via plastic deformation, which is calculated based on the accumulated plastic slip, so that it can be considered as the FIP. The accumulated plastic slip exhibits a constant rate after an initial period and can be written as
 $${p^{{\rm{acc}}}} = \int {\dot{p}{\rm{d}}t} = {p^{\left( 0 \right)}} + N \cdot \Delta {p^{{\rm{sat}}}}\quad ,$$
where p (0) is the accumulated plastic slip in the initial unstable regime and Δp sat is the amplitude of plastic slip in the stable regime. Considering the critical accumulated plastic slip (p crit) as an indicator for fatigue crack incubation, the critical number of cycles N crit for the microcrack initiation is given by
 $${N^{{\rm{crit}}}} = {{{p^{{\rm{crit}}}}} \over {\Delta {p^{{\rm{sat}}}}}}\quad ,$$
where Δp sat represents the plastic slip amplitude in the stable regime. With this procedure, the number of cycles for crack incubation is determined. p crit is a material parameter, the value of which depends upon the material condition and needs to be fitted to the analyzed material through the experimental data. To determine the crack initiation period in the present case, the value of critical accumulated slip is chosen equal to 300 [Reference Manonukul and Dunne43].
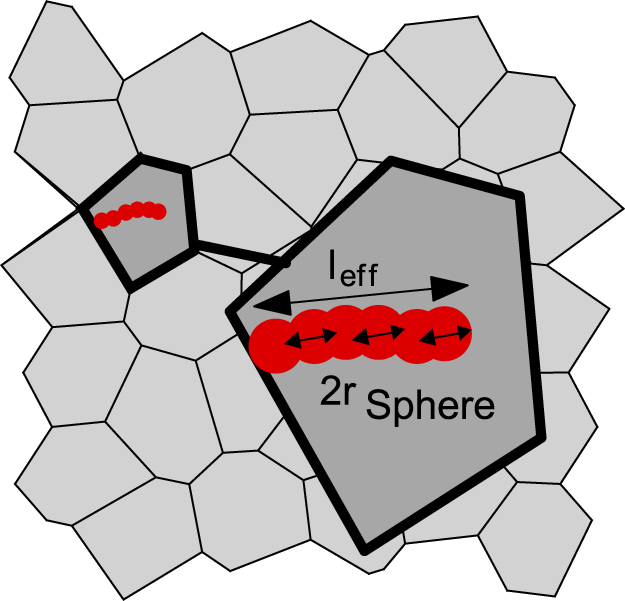
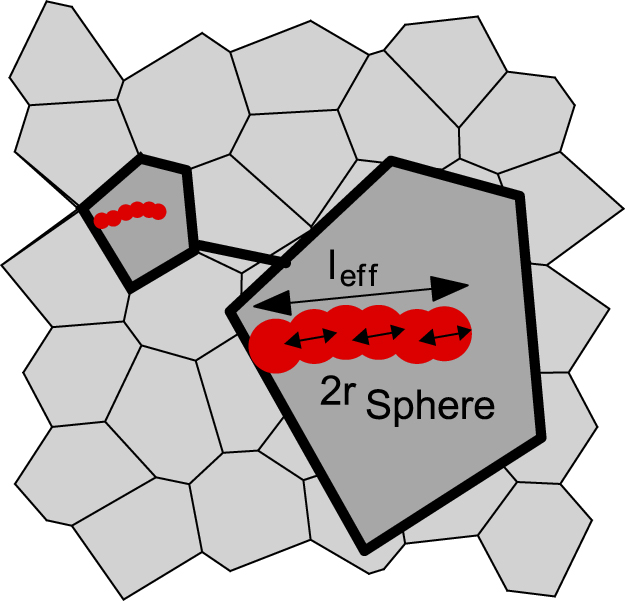
The strategy to model fatigue crack growth is given in the following. To obtain mesh-independent results, a sphere averaging strategy [Reference Castelluccio32] is introduced. The FIP, i.e., accumulated plastic slip (p acc), is evaluated within a finite regime defined by the size of the sphere (r sphere) as shown in Fig. 1. For each integration point, a spherical region is defined with a certain cutoff radius (r sphere) [Reference Pijaudier-Cabot and Bazant44], within which the value of FIP for the included elements is calculated and averaged. Furthermore, material degradation during cyclic loading is implemented via a gradient-regularized damage model. The damage variable is linked to the accumulated plastic slip. If the accumulated plastic slip reaches a critical value and the respective integration point experiences a tensile stress in the loading direction, the damage variable is set to 1. Therefore, in contrast to the damage models suitable for monotonic loading, the evolution of damage is modeled via a step function such that a material point is either fully damaged or free of damage. Here, a sphere size of r sphere = 2.5 μm is used and the incremental crack extension is visualized schematically in Fig. 1, where the internal length scale parameter r sphere is also shown.
Scheme for the numerical modeling of damage propagation using the sphere averaging method.
The damage variable is evaluated in a certain domain in the neighborhood of the material point under consideration, thus introducing an internal length scale in the model [Reference Peerlings45]. This approach leads to the introduction of a nonlocal regularization field  $\bar{\kappa }$ given by
 $$\bar{\kappa }\left( x \right) = \int_{{R^3}} {\Psi \left( {x,y} \right)\kappa \left( y \right){\rm{d}}V} \quad ,$$
where
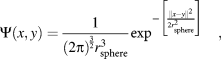 $$\Psi \left( {x,y} \right) = {1 \over {{{\left( {2\pi } \right)}^{{3 \over 2}}}r_{{\rm{sphere}}}^3}}{\exp ^{ - \left[ {{{\left\| {x - {y}} \right\|^2} \over {2r_{{\rm{sphere}}}^{\rm{2}}}}} \right]}}\quad ,$$
is a weighting function evaluating the influence of material point y on the current material point x and r sphere describes the internal length scale parameter, which is considered as a model parameter [Reference Peerlings45]. Similar to crack incubation, the critical accumulated slip is governing the early stages of fatigue crack growth, where damaged regions are updated sequentially when the damage criterion is met.
For the region with the highest nonlocal FIP, the lifetime to failure is determined by
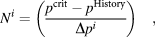 $${N^i} = \left( {{{{p^{{\rm{crit}}}} - {p^{{\rm{History}}}}} \over {\Delta {p^i}}}} \right)\quad ,$$
where N i is the number of cycles spent in the i-th crack growth increment, Δp i is the stabilized increment in plastic slip per cycle, and p History is the accumulated plastic slip the region has already seen. This history variable can be determined from the previous stages of crack incubation by
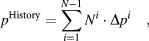 $${p^{{\rm{History}}}} = \mathop \sum \limits_{i = 1}^{N - 1} {N^i} \cdot \Delta {p^i}\quad ,$$
as a summation over the experienced plastic deformation. To determine Δp i, a number of virtual cycles are simulated with a frozen damage state. If the region of maximum FIP and the stable Δp i are determined, Eq. (7) is used to determine the number of equivalent real cycles necessary to reach the critical accumulated plastic slip. Additionally, the damage parameter in the region of maximum FIP is set to 1 to model crack growth as explained earlier. This means that the element is completely damaged, and the crack propagates further. This procedure is repeated iteratively for the updated crack network. The strategy for crack incubation and crack growth is identical, while the only difference for crack growth is that the material has already accumulated plastic strains in the incubation phase or the former stages of crack advance. This information is saved as material history variable p History for every material point.
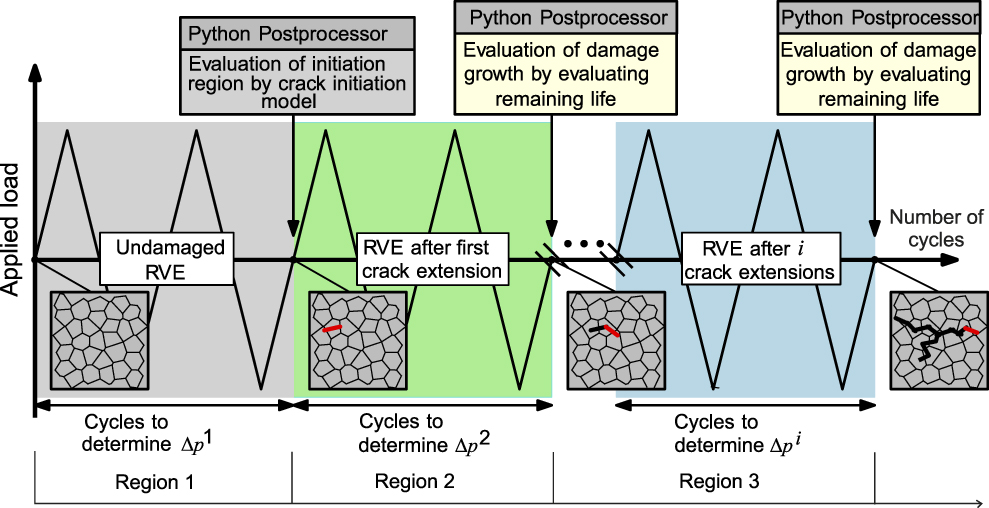
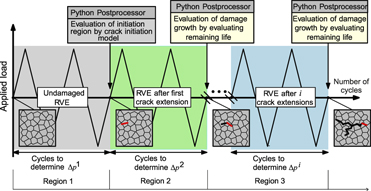
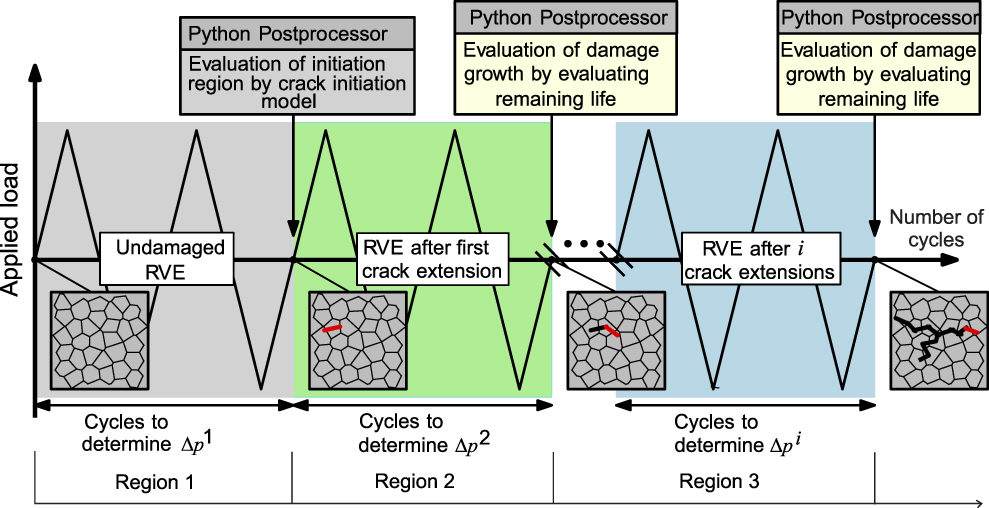
The crack incubation and early crack growth modeling schema is shown for three crack increments in Fig. 2. In the first series of virtual cycles marked in the gray box of Fig. 2 (Region 1), the stabilized increment in plastic slip per cycle Δp 1 is determined based on the microstructure of the undamaged RVE. Exemplarily, two virtual cycles are plotted to approach the stable regime. The region of the maximum FIP is identified, and the number of cycles to crack incubation is determined. Based on the number of cycles to crack incubation, the accumulated plastic slip for the whole RVE is updated and saved in the history variable p History of Eq. (11) at each integration point. The second series of virtual cycles determines the new increment in plastic slip per cycle Δp 2 considering the pre-damaged RVE which is shown in the green box in Fig. 2 (Region 2). Again, the zone of maximum FIP is identified and the necessary number of cycles to accumulate the critical plastic strain is determined. In contrast to the case of crack incubation, for the crack growth simulations, the accumulated plastic slip of the incubation regime p History will reduce the critical plastic slip necessary to advance the crack. The same procedure can be repeated to determine further crack growth as shown in the blue box in Fig. 2 (Region 3).
Scheme for the numerical modeling of nucleation and growth of microstructurally short cracks.
At this point, it is important to note that different criteria to determine crack incubation and crack growth can also be used. Nevertheless, in this work the critical accumulated plastic slip is chosen as a criterion for both crack incubation and microstructure crack growth.
The constitutive material model from the section “Constitutive model and crack incubation” is implemented as a UMAT (user-defined material) model in the commercial FEM solver ABAQUS, and the crack growth model is implemented externally using the PYTHON programming language.
Crack growth in polycrystals
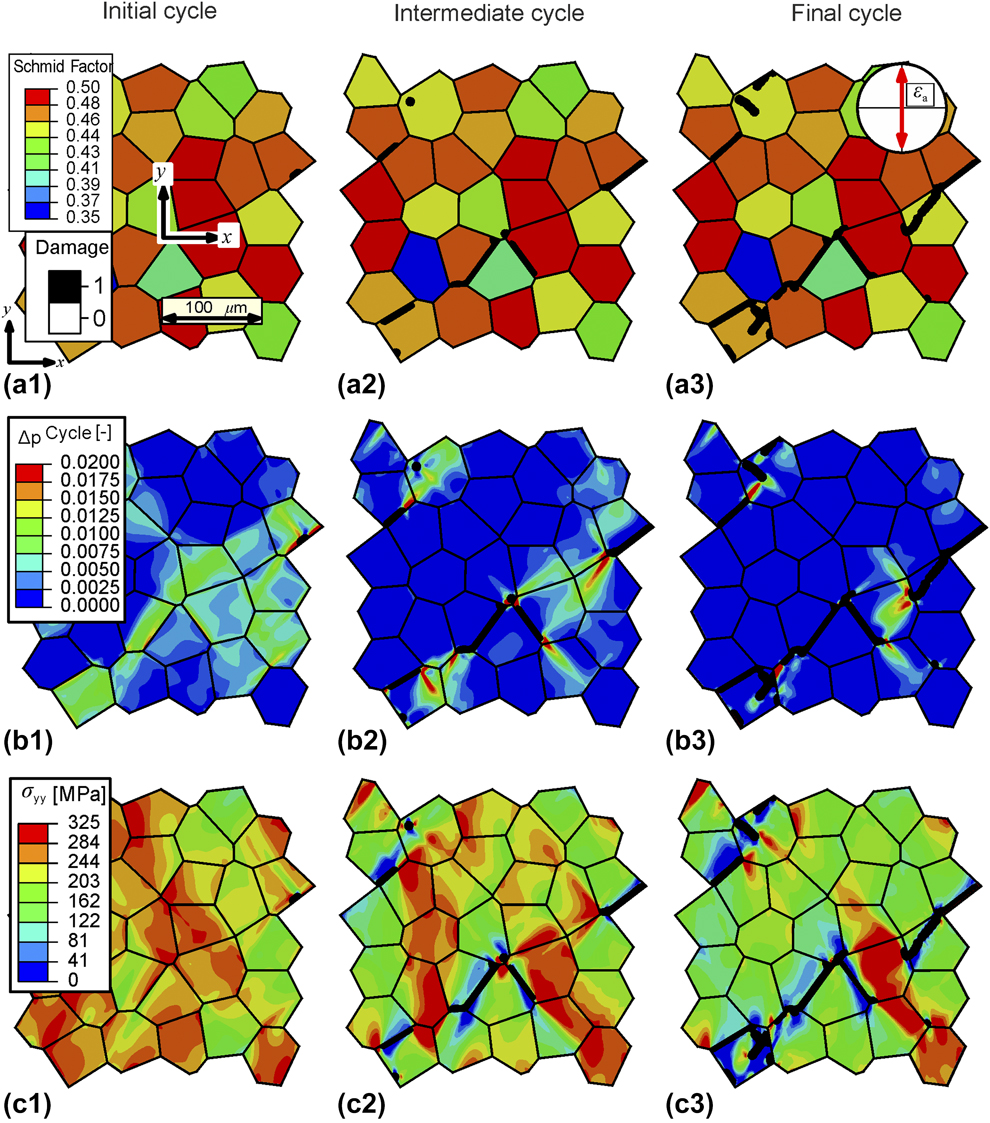
To analyze the growth of a crack in the microstructure, we first analyze the incubation of crack by applying a uniaxial strain amplitude of εa = 0.25%. It can be seen that crack incubation takes place at the top right corner of the RVE in Fig. 3(a1), which is the first region where the crack incubation criterion is met. Figure 3(b1) shows the increment in plastic slip accumulation during the saturated cycle under consideration of the crack incubation region. In general, the RVE can be separated into grains with a strong plastic deformation and other grains where no plasticity appears. The highest plastic deformation is visible at the crack tips, while the plastic deformation within the activated grains is comparatively homogeneously distributed. The uniaxial stress along y-direction (σyy) at peak loading in tension is shown in Fig. 3(c1), where a rather homogeneous distribution is visible. It can be noticed that the grains showing the lowest slip activity show higher stress than highly plastically deformed grains.
Overlay plots showing the propagation of crack at different time intervals during fatigue for a uniaxial strain amplitude of εa = 0.25%. Subfigures a1, b1, and c1 represent the initial cycle and subfigures a2, b2, and c2 represent the intermediate cycle, while subfigures a3, b3, and c3 represent the final cycle. Black color represents fully damaged elements.
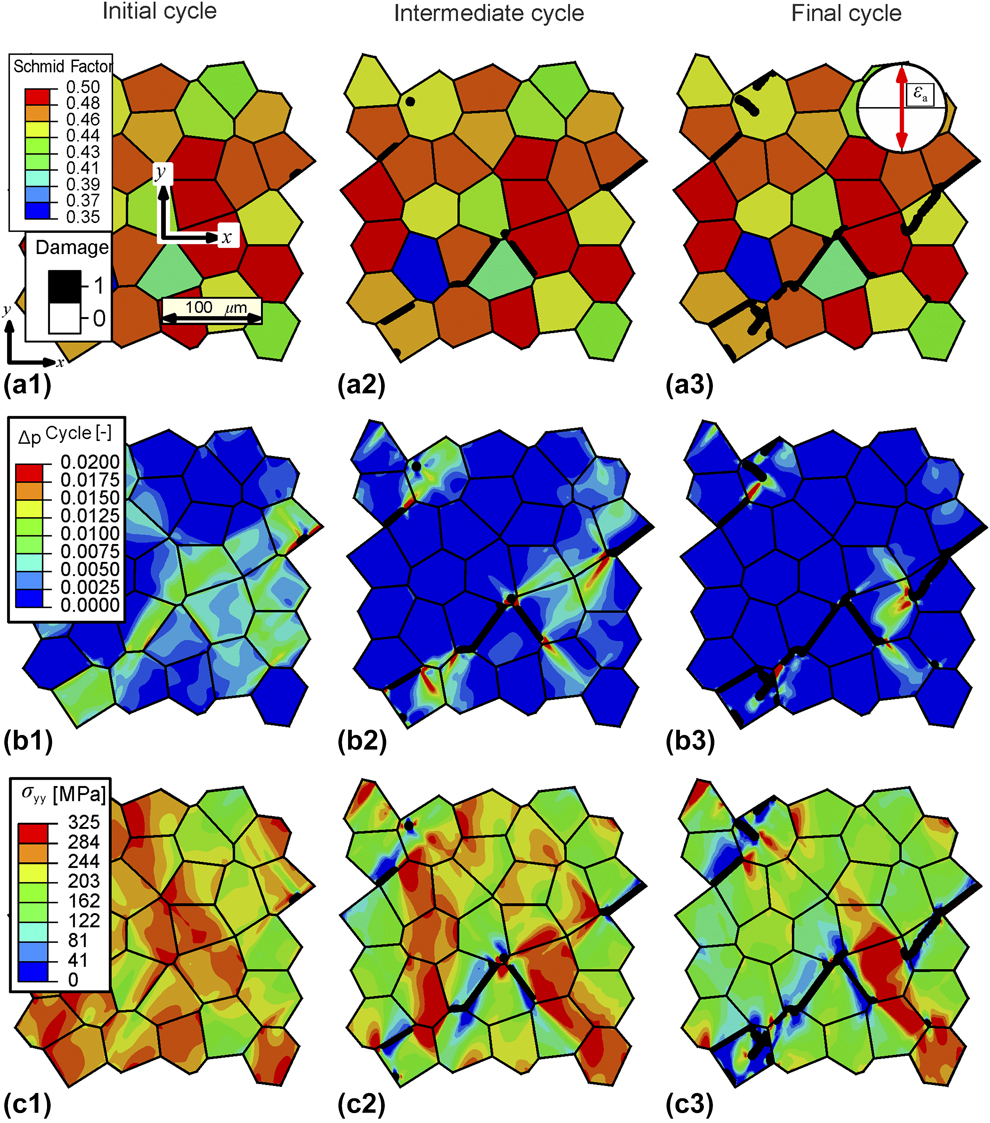
In Fig. 3(a2), the stage of intermediate crack growth is visible. The initial crack has grown to approximately one grain size, but other regions have also developed cracks, resulting in a crack network distributed within the whole RVE. Remarkably, the cracks formed mainly at grain boundaries. Analyzing the plastic slip per cycle in Fig. 3(b2), the regions with high plastic strains are again located at the crack tips and slightly pointing in the direction of a neighboring crack. The distribution of the stress component in the loading direction shown in Fig. 3(c2) is now also strongly influenced by the crack network. Regions creating the remaining ligament show the highest stress states compared to regions located next to the crack flanks, where forces are not transferred and, therefore, the stresses are low. The stress maxima are located at the crack tips. At some of them, the contour of the stress distribution reminds of the typical butterfly shape. In general, the stress level at the point of load reversal in tension has already decreased compared to that in the initial stage.
The stage of final crack growth is shown in Fig. 3(a3). Obviously, the existing cracks have grown further, mostly along grain boundaries, but inter-granular cracks connecting cracked regions have also appeared. Plasticity is now even more localized compared to the two previous stages and slip band-like zones interconnect the cracks, as shown in Fig. 3(b3). The stress distribution has the same characteristics as described previously, while the ligament regions show even higher stresses, while the average stress level is further decreased.
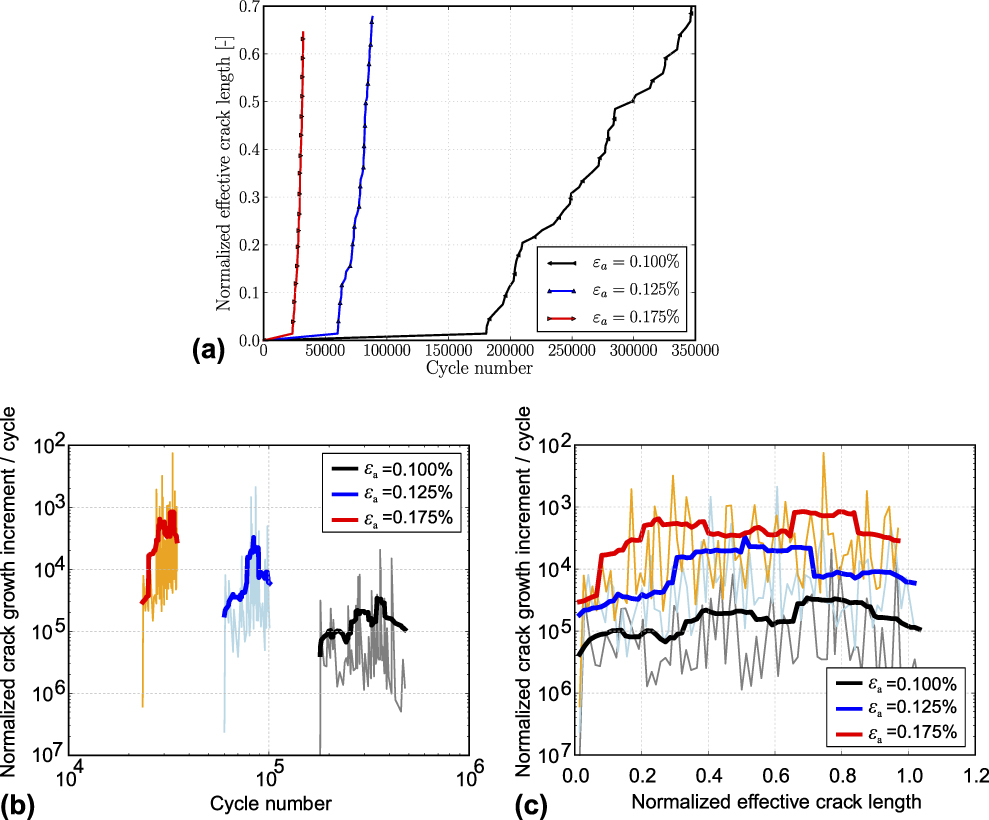
Figure 4(a) shows the normalized effective crack length of the crack network as a function of the cycle number for three different applied strain amplitudes. The normalized effective crack length is the summation of all individual sub-crack lengths normalized with respect to the RVE edge length. Strain amplitudes of εa = 0.100%, εa = 0.125%, and εa = 0.175% are tested and plotted in black, blue, and red lines, respectively. The shape of the three curves is similar. The crack incubation regime, which ranges from 104 cycles, over 2.2 × 10⁴ cycles to 4.2 × 10⁴ cycles for large, medium, and small strain amplitudes, is followed by a crack growth regime. After crack initiation, the slope of the curve decreases with decreasing strain amplitude from the left to right.
(a) Normalized effective crack length over the number of cycles for three applied strain levels. Normalized crack growth increment per cycle (b) over the cycle number and (c) over the normalized effective crack length. Raw data points (in b and c) are shown as thin lines, while running mean values are shown as thick lines.
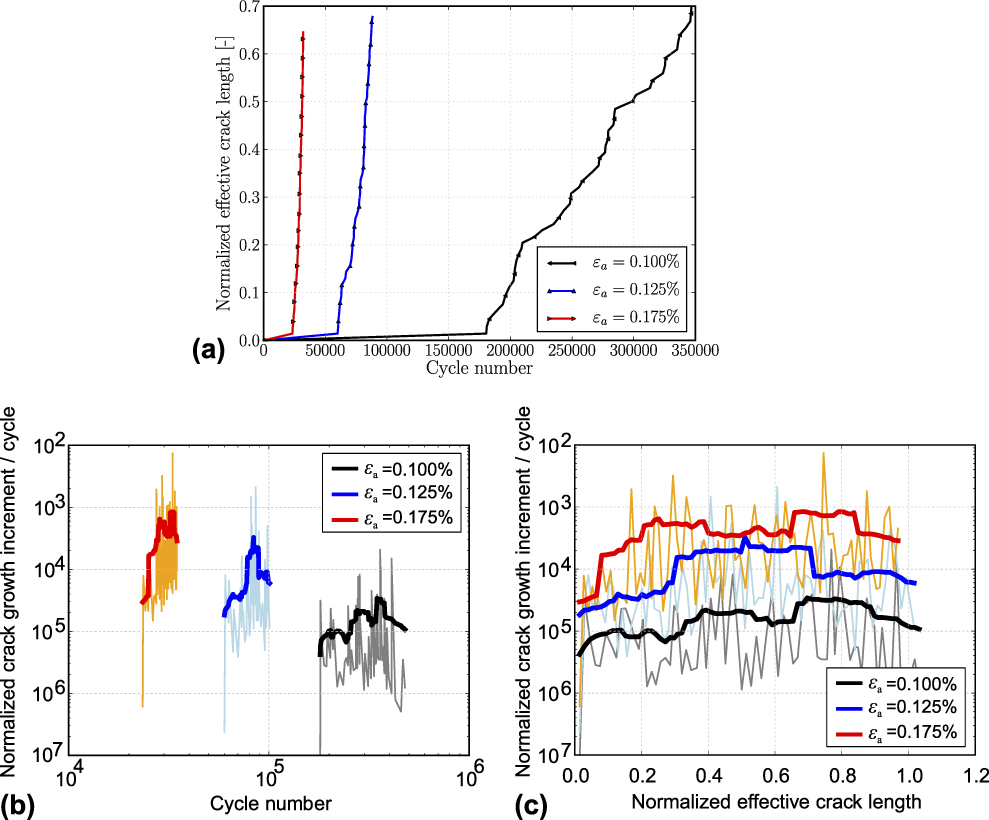
Additionally, the effective crack growth rate per cycle can be determined from the known crack increment size and the number of cycles to advance the crack by rearranging Eq. (10). The effective crack growth rate is shown in Fig. 4(b) as a function of the cycle number and in Fig. 4(c) as a function of the normalized effective crack length for the three different applied strain ranges. Raw data points are shown as thin lines, while running mean values that consider the previous and the following crack growth rate with respect to the examined point are shown as thick lines for the three strain amplitudes.
Analyzing Fig. 4(b), which shows the effective normalized crack growth rate as a function of the cycle number, a crack growth rate curve can be seen for each of the applied strain amplitudes. It starts after crack incubation so that the higher the strain amplitude, the more left the curve is located as incubation takes place earlier. All three curves have a similar trend and reveal that the fatigue crack growth rate is varying over roughly two orders of magnitude for the three strain amplitudes considered during the simulation. A closer investigation of the curves shows that the initial crack growth rate is the lowest for all three cases and increases in the first 10% of cycles. This effect is attributed to the notch effect of the small crack, once it is initiated. Afterward, the crack growth rate varies strongly, but the mean crack growth rate remains nearly constant. The rather strong fluctuations are traced back to two main reasons. First, within the investigated microstructure RVE, multiple cracks initiate and grow at the same time, while the effective normalized crack growth rate does not distinguish between individual cracks and, thus, inherits the growth events of multiple cracks in the crack network. The second reason is that due to microstructure heterogeneity and to heterogeneous plastic deformation, some zones at the crack tip have a higher driving force for damage or are already pre-damaged, while others have a lower driving force and are rather undamaged. This scenario is valid at a grain boundary where a rather weakly plastically deformed grain separates two strongly plastically deformed grains and, thus, reduces the crack growth rate.
Figure 4(c) shows the normalized effective crack growth rate as a function of the normalized effective crack length. As the effective crack length is now chosen as x-axis, the evolution of crack growth rates can be compared in more detail. It can be observed that the higher the strain amplitude, the higher the crack growth rates become. However, due to the microstructure-induced fluctuations, this observation is not necessarily true, and the curves overlap in some points before the crack extends to these regions. Furthermore, it can be observed that the three crack growth rates start with a comparably low value, which increases for all three strain amplitudes in the initial crack growth regime. As the simulations are strain controlled, the crack growth rate does not increase unboundedly but reaches a plateau value for all three tested amplitudes. This can be explained by the fact that the damaged regions take more strain and reduce the driving force for the crack growth.
Influence of finite element discretization
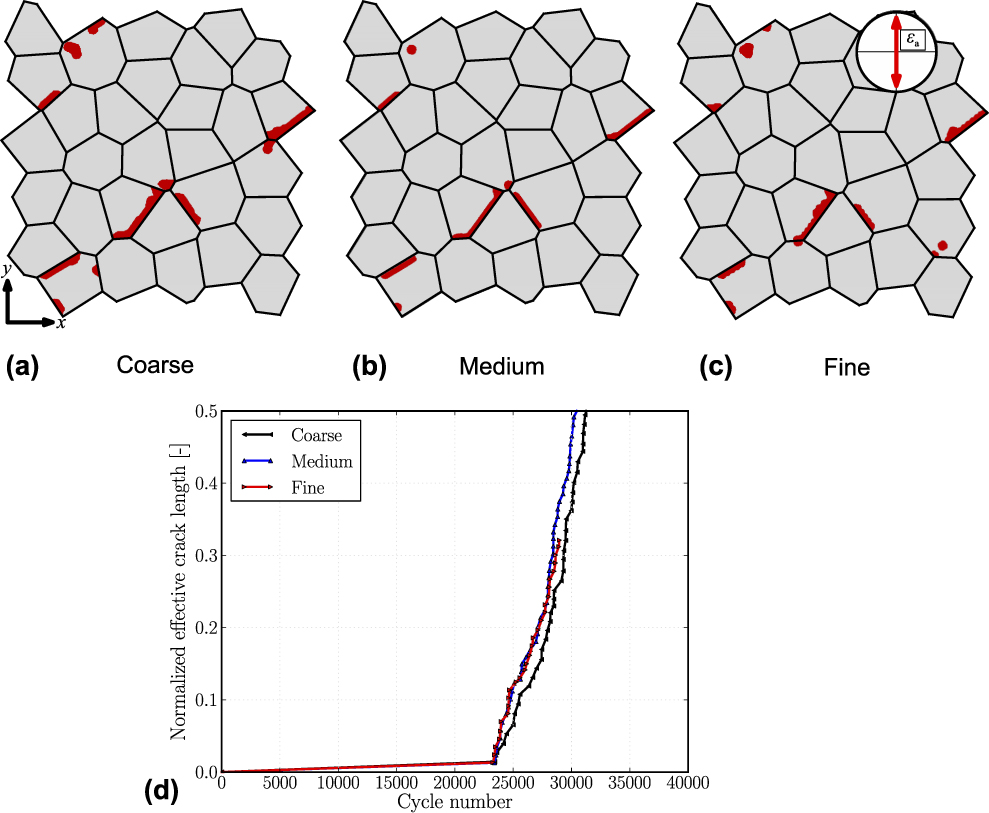
In this section, the influence of finite element discretization on fatigue crack behavior is studied. The crack path and the effective crack length as a function of applied numbers of cycles are compared for three different mesh sizes. To obtain mesh-independent results, the sphere averaging strategy is introduced, while a sphere size of r sphere = 2.5 μm is used.
Figure 5 shows the crack network for the investigated microstructure with an average of 210 elements per grain in (i), 850 elements per grain in (ii), and 1300 elements per grain in (iii). Such fine levels of discretization are investigated to resolve the influence of very localized deformations on crack growth behavior. The evolution of damage is plotted after 50 virtually applied cycles. Comparing the images, it can be seen that the cracked regions are in good agreement and mesh size effects seem to play a minor role. Note that due to the finite radius of the sphere averaging method, the damage model is regularized, and the damage distribution is mesh-independent.
Propagation behavior of crack plotted as an overlay over the microstructure for εa = 0.175% strain for (a) course, (b) medium, and (c) fine mesh sizes. (d) Normalized effective crack length plotted over the cycle number for different mesh sizes.
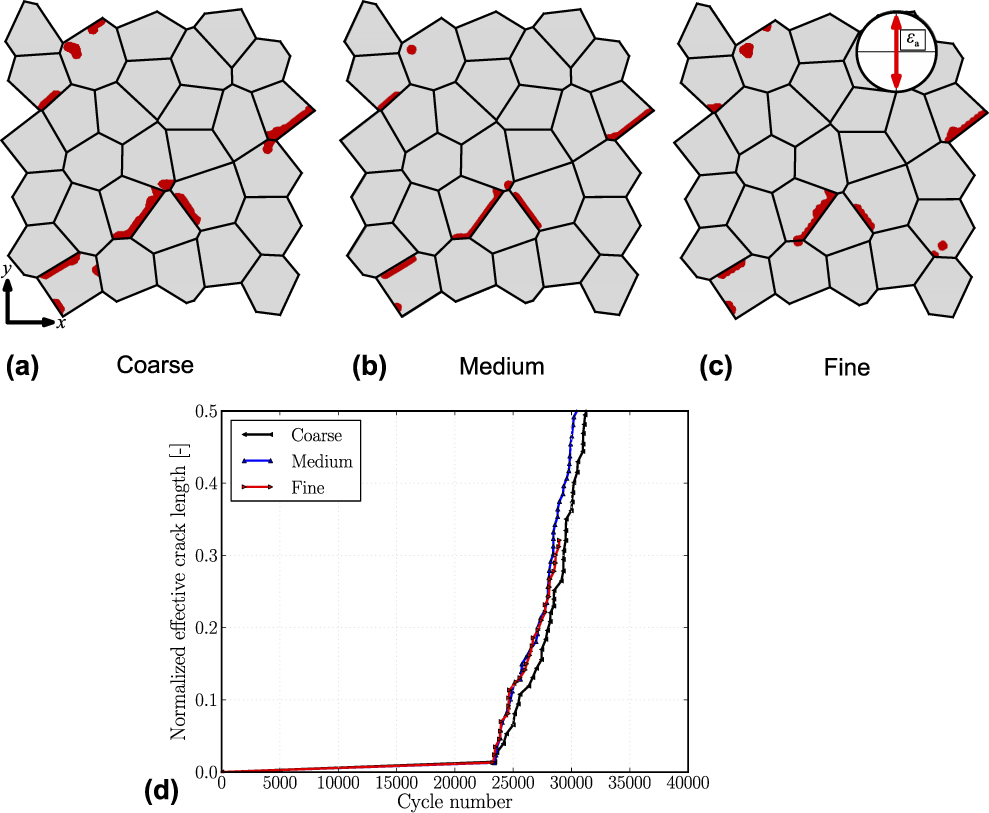
Considering the crack length evolution in Fig. 5(d), it can be seen that for all three mesh sizes, the crack length evolution is quite similar. While medium and fine mesh distribution results are nearly identical, the coarse mesh has a slightly retarded crack evolution. The reason for that is not found in the damage model itself but in the driving force for damage evolution. For the coarse mesh, the plastic deformation is not fully resolved, takes smaller values near the crack tip, and thus requires a higher number of cycles for the crack propagation (shown as a slight right shift of the curve).
For further analysis, a medium-size mesh is used.
Influence of applied loading amplitude
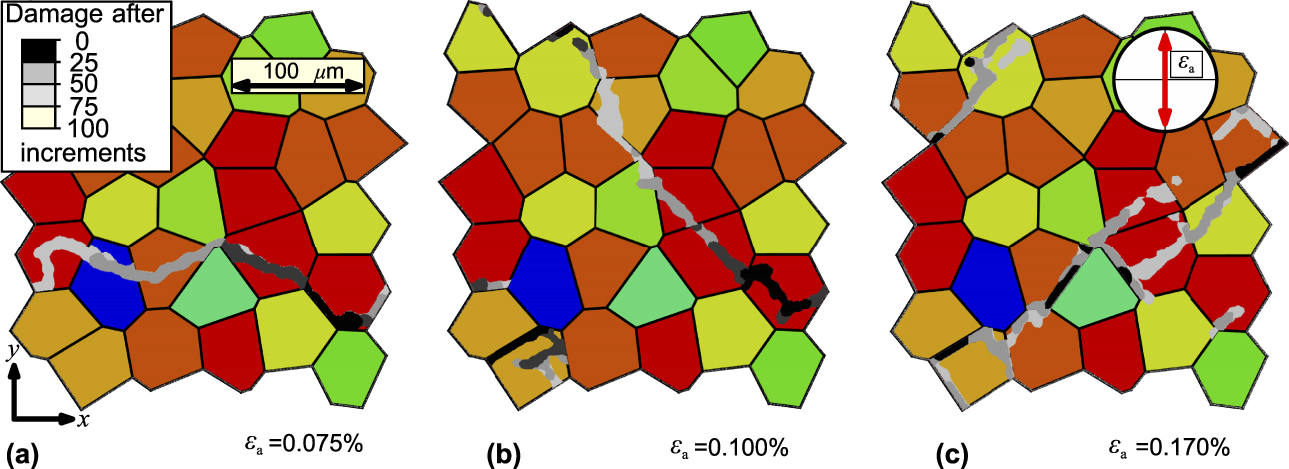
Similar to the variation of the strain amplitude in experimental test setups, we test our model by performing virtual fatigue experiments with three different strain amplitudes. In this subsection, we investigate the dependence of crack initiation and microstructural small crack growth behavior as well as the evolution of the effective stress–strain hysteresis of the RVE on the applied loading amplitude. Analyzing the final crack networks within the microstructure, it is apparent that they strongly depend on the applied loading amplitude. Especially the crack incubation regions, indicated by black color in the images, show some differences when comparing Figs. 6(a) with 6(b) and 6(c).
Overlay plots showing the propagation of crack at different time intervals during fatigue loading for (a) εa = 0.075%, (b) εa = 0.10%, and (c) εa = 0.175%. Crack initiation is marked in black, while the later stages of crack propagation (higher cycle number) appear in a lighter gray-scale.
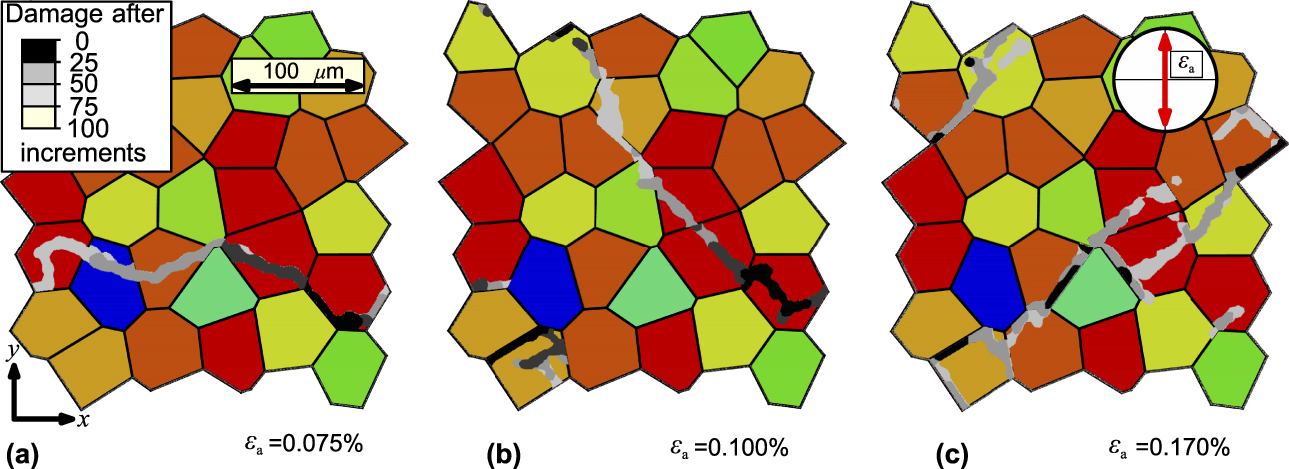
The evolution of the crack for the smaller applied strain amplitude is more horizontal in the later crack growth regime as shown in Fig. 6(a). In contrast to this, the crack network for the higher applied strain amplitude is developing diagonally and with approximately 45° toward the loading direction. Thus, the final crack network of Fig. 6(c) also extends at an angle of 45°.
Furthermore, it can be observed that the locations of the crack initiation are different in Figs. 6(a)–6(c). In case of higher loading amplitude, during the first loading cycle, the accumulated slip hotspots emerge at the same locations as in the case of lower strain amplitudes. However, at the later stages of the first loading cycle, when the total strain increases, different regions of higher accumulated strains appear in the microstructure due to the material’s nonlinearity. In addition to the observations made above, we find that the higher the loading range, the more independent crack nucleation sites from which sub-cracks start propagating exist. This can be seen in the distribution of black crack regions, which indicate cracked regions in the first 25 increments of crack growth. For the smallest strain amplitude, only one crack nucleation site appears, whereas for the intermediate loading range, three individual nucleation sites appear, which further increases to more than five nucleation sites for the largest loading amplitude. These observations are in agreement with experiments [Reference Polák, Kruml, Obrtlík, Man and Petrenec46], showing that for low plastic strain amplitudes, the crack advances without linkage since the density of cracks is low and the nucleated crack grows by creating a cyclic plastic zone on its tip. In cycling with a high plastic strain amplitude, the crack can grow more effectively by linking with a neighboring crack. Therefore, the high density of initiated cracks significantly contributes to the early crack growth. The reason for this is an increasing heterogeneity of plastic deformation with a decreasing strain amplitude.
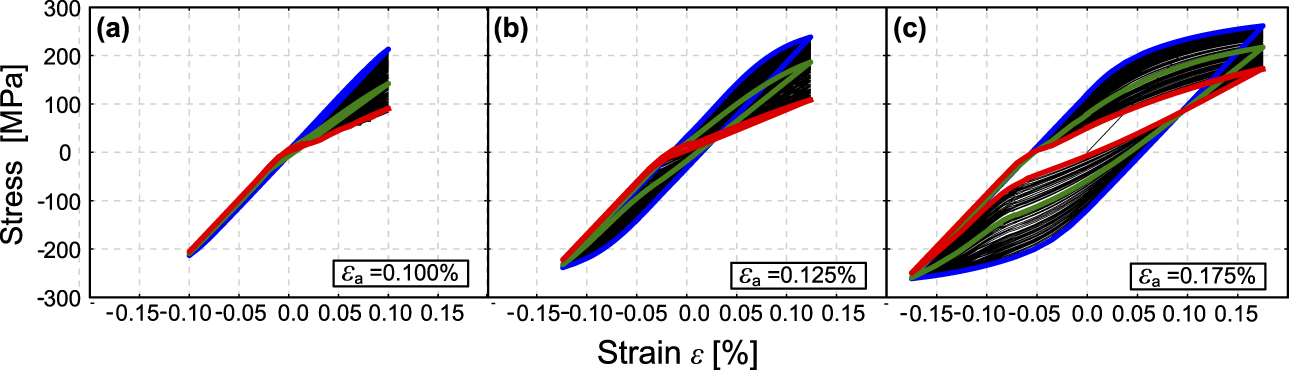
In Figs. 7(a)–7(c), stress–strain hysteresis is visualized for three different loading ranges to give an overview of different possible shapes and their evolution during fatigue loading in dependence of the applied load. The initial hysteresis is in blue for undamaged RVE for the saturated cycle, the intermediate hysteresis is in green, and the final hysteresis is in red, while the evolution of hysteresis with the resulting crack evolution over the virtual cycles during fatigue loading is plotted as thin black lines. The hysteresis flank of the loading part is identical to that of the unloading part, thus rendering the hysteresis as point symmetric with respect to the origin.
Stress–strain behavior over the number of cycles at (a) εa = 0.1%, (b) εa = 0.125%, and (c) εa = 0.175%. Blue is the initial behavior, green is the intermediate behavior, and red lines show the behavior at the end of the loading. (For clarity, please check the online colored version of this image.)
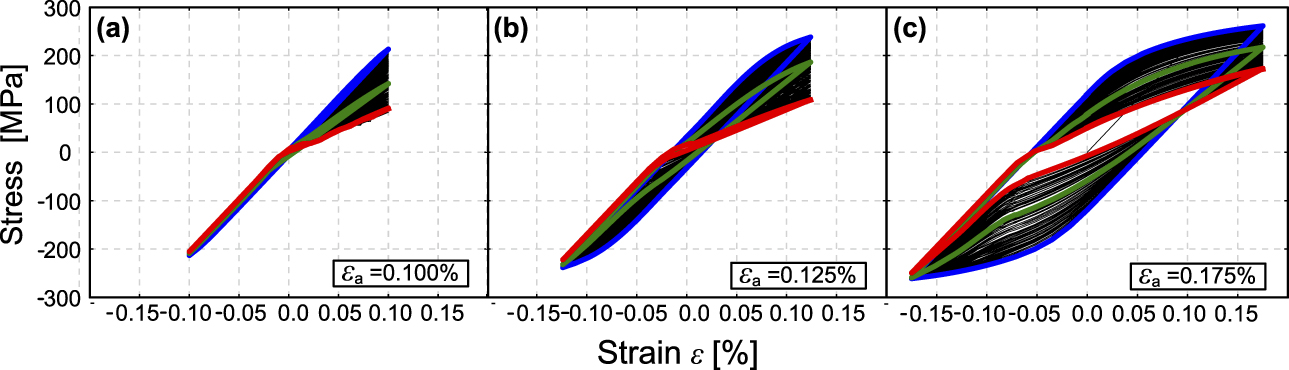
Considering the strain-controlled cases, the applied strain amplitude increases via εa = 0.1%, over εa = 0.125% to εa = 0.175% from the left to right. As visualized in Fig. 7(a), the shape of the hysteresis shows the same characteristics for all three strain amplitudes applied. The stress amplitude in compression and the stiffness after unloading are constant, while the stress amplitude in tension and the stiffness after loading decrease with progressive crack evolution. Nevertheless, the hysteresis differ in their actual shape. For the smallest strain amplitude applied, no measurably effective plastic strain amplitude is visible, and the area enclosed by the hysteresis is nearly zero even in late stages of damage evolution. However, very localized plastic slip accumulates and leads to an evolution of the crack network together with a decreasing stiffness in tension. For the strain amplitude of εa = 0.125%, a shakedown of global plasticity can be observed. While the initial hysteresis shown in green in Fig. 7(b) has a measurable plastic strain amplitude and encloses a finite area, the final hysteresis shown in red indicates no global plastic deformation. The strain amplitude εa = 0.175%, visualized in Fig. 7(c), shows the same trends as the medium strain amplitude, while due to the higher strain amplitude, plastic shakedown is not completely finished when the simulation is terminated. Note again that for strain-controlled loading, in all cases, the global plastic strain amplitude decreases. As crack advance is governed by the local plastic slip at the crack tip, the crack growth speed might increase even for a decreasing global strain amplitude. This effect is visible in Fig. 7(b) as the curves describing the crack growth rate for strain-controlled loading decrease in the later stages of the simulation, after increasing in the beginning.
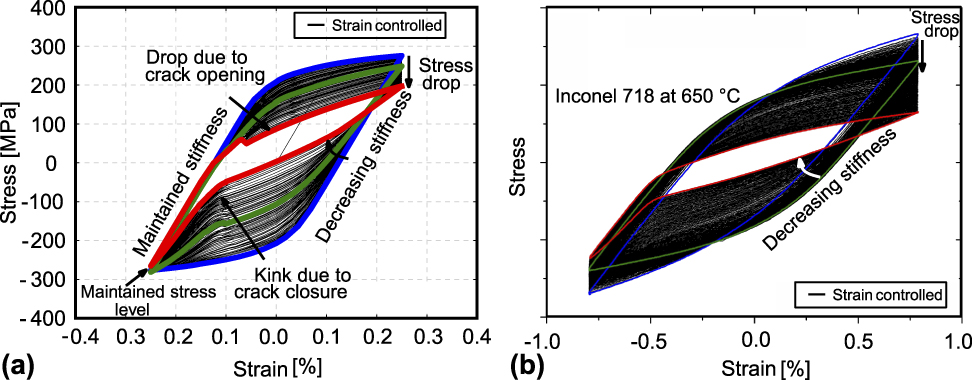
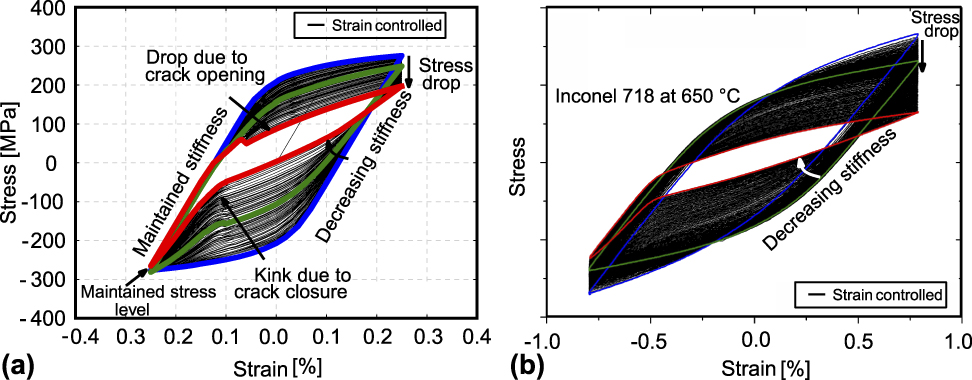
A qualitative comparison of evolution of the stress–strain hysteresis over the number of cycles for the strain-controlled simulation for 0.175% strain and experiments can be seen in Fig. 8. It can be observed that the shape evolution of stress–strain hysteresis loses its symmetry during fatigue crack evolution. Under tensile load, cracked zones in the microstructure open up and do not transfer stresses, which reduces the effective stiffness of the RVE. This results in a decrease in the stress level in the loading part of the hysteresis. Under compression, damaged regions are closed and compressive stresses are transferred. Due to this effect, a kink is developed in the shape of hysteresis in the compression region. Additionally, in the event of load reversal from tension to compression, the elastic stiffness decreases as the cracks are opened and thus reduce the effective stiffness of the RVE. In the event of load reversal from compression to tension, the initial elastic slope is maintained due to the compression state of the RVE, which leads to closed cracks, which do not influence the effective stiffness, and hence the stiffness is maintained. As the loading is strain-controlled and the effective stiffness is reduced in tension, the area of the hysteresis decreases. Equivalently, the dissipated energy or the plastic work per cycle decrease. The qualitative comparison of the evolution of stress–strain hysteresis in simulations and experiments shows a good agreement [Reference Schlesinger47]. The only difference is that the experimentally measured hysteresis also shows a stress decrease in compression, which is attributed to isotropic softening effects, not included in this study.
Qualitative comparison of the evolution of stress–strain hysteresis over the number of cycles: (a) strain-controlled simulation for εa = 0.175%, (b) experimental results, courtesy of Michael Schlesinger from Fraunhofer Institute for mechanics of materials (IWM) Freiburg. (For clarity, please check the online colored version of this image.)
Conclusions
In this work, a micromechanical model for fatigue crack growth of polycrystalline materials was proposed and applied to study the influence of loading amplitude and grain orientation distribution on crack growth behavior. A crystal plasticity model was used to predict the influence of microstructure and constitutive modeling of cyclic work hardening on the accumulation of plastic slip in different regions of the microstructure. Crack nucleation and propagation was described by a gradient regularized damage model. All simulations were total strain controlled and performed for the mean stress ratio R = −1.
It was observed that for three strain amplitudes, the crack growth rates started with a comparably low value, which increased in the initial crack growth regime. However, the crack growth rate did not increase unboundedly, but reached a plateau value for all three amplitudes tested instead. By analyzing the final crack networks within the microstructure, it was shown that the final crack network strongly depends on the applied loading amplitude. If the loading amplitude is increased, a larger number of independent crack nucleation sites appear, from which further sub-cracks start propagating. As crack advance is governed by the local plastic slip at the crack tip, the crack growth speed might increase even for decreasing global strain amplitude. These results show the capabilities of a micromechanical model for predicting fatigue crack growth behavior in polycrystalline materials. The influence of different numerical and process parameters on crack growth can be studied such that it can be further employed to investigate mechanisms of fatigue crack growth and to understand its dependence on other microstructural features.
Acknowledgments
The authors thank Michael Schlesinger from the Fraunhofer Institute for mechanics of materials (IWM) Freiburg for providing the experimental results for the qualitative comparison of our numerical model.