Implications
Erhualian pig is well known its high prolificacy in the world. Litter size is one of the most important economic traits in pig production, is hard to be improved because of the low heritability. Data from this study show that large phenotypic variation exists in litter size of the Erhualian pig breed. Marker-assisted selection could be an effective way to improve litter size in pig breeds. A potential marker (rs81447100) could affect litter size in different pig breeds.
Introduction
Litter size is one of the most important economic traits in pig production. It is also a complex trait that is determined by several biological processes in sows, especially the ovarian physiological process and the uterine physiological process (Dyck and Swierstra, Reference Dyck and Swierstra1983). It is generally accepted that litter size is controlled by multiple genes with small effects leaving a low heritability of ~0.1. To date, few genes responsible for this trait have been unequivocally identified in pigs.
Erhualian, a Chinese indigenous pig breed, is known to have the highest litter size record in the world. However, we have observed a large phenotypic variation in litter size in a sample of 177 Erhualian sows (He et al., Reference He, Li, Ma, Sui, Gao, Kim, Gu, Huang, Ding and Huang2017). We also identified a set of single nucleotide polymorphisms (SNPs) associated with total number born (TNB) in this Erhualian population using a Fst-based genome scan and highlighted several candidate genes for ovulation rate (He et al., Reference He, Li, Ma, Sui, Gao, Kim, Gu, Huang, Ding and Huang2017).
The objectives of this study were: (1) to perform a genome-wide association study (GWAS) to identify loci associated with litter size related traits in a larger sample of Erhualian sows; (2) to validate the most significant SNP for litter size in additional populations from one Chinese synthetic breed (Sutai) and one European commercial breed (Yorkshire); (3) to identify candidate genes for uterus length.
Material and methods
Animals and phenotypic data
As previously described (He et al., Reference He, Li, Ma, Sui, Gao, Kim, Gu, Huang, Ding and Huang2017), data of TNB and number born alive (NBA) were collected from 948 consecutive parities of 207 Erhualian pigs in Changzhou Jiaoxi cooperatives of Erhualian pigs (Jiangsu, China) during the period from 2013 to 2015. In all, 50 individuals which have continuous parities from the first to the seventh parity representing the top 12% and the bottom 12% of estimated breeding values of TNB (EBVTNB) of 207 Erhualian sows were selected for GWAS analysis. The most significant SNP identified by GWAS was further genotyped for 313 Erhualian sows from Changshu Animal Husbandry and Veterinary Station (n=111), Sutai Enterprise Co., Ltd (n=58) and Changzhou Jiaoxi Cooperatives of Erhualian Pigs (n=144) including the 50 genotyped individuals, 173 Sutai sows from Sutai Enterprise Co., Ltd, and 488 Yorkshire sows from Laizhou farm of Fujian Yichun Corporation (Supplementary Table S1). Sutai is a synthetic Chinese breed that was derived from Western Duroc (50%) and Chinese Taihu (50%) after over 18 generations of artificial selection (Zhang et al., Reference Zhou and Stephens2014). The raw data of TNB and NBA of each breed were divided into two groups: primiparity (the first parity) and multiparity (the second to the seventh parity). The records of TNB and NBA of less than five were removed as previously reported (Dulioust et al., Reference Dulioust, Toyama, Busnel, Moutier, Carlier, Marchaland, Ducot, Roubertoux and Auroux1995).
Selective genotyping
Selective genotyping is a cost effective method to increase the detection power of quantitative trait loci (QTL) (Darvasi and Soller, Reference Darvasi and Soller1992). In this study, EBVTNB for 207 Erhualian sows were determined based on the pooled data across all parities using the DMU software (Madsen et al., Reference Noguera, Rodriguez, Varona, Tomas, Munoz, Ramirez, Barragan, Arque, Bidanel, Amills, Ovilo and Sanchez2006) and the following statistical model:
 $$\eqalignno {y_{{ijklmno}} \,{\equals}\,&\mu {\plus}{\rm HFS}_{i} \,{\plus}\,{\rm AGE}_{j} \,{\plus}\,{\rm PA}_{k} \,{\plus}\,{\rm P}_{l} \,{\plus}\,{\rm A}_{m}\, {\plus}\,{\rm G}_{n} \,\cr &{\plus}\,{\rm B}_{o} \,{\plus}\,e_{{ijklmno}} $$
where y ijklmno represents litter size phenotype; μ represents overall mean; HFS i represents effect of herd-year-season, AGE j represents fixed effect of age of the sow within parity as covariate; PA k represents fixed effect of parity; P l represents random effect of permanent environment; A m represents random additive genetic effect; G n represents fixed effect of genotype; B o represents random effect of service boar; and e ijklmno represents random residual effect. Sows representing the top 12% (high-EBVTNB, n=25) and the bottom 12% (low-EBVTNB, n=25) EBV of TNB were selected for subsequent genotyping using Illumina porcine 60 K SNP chips.
Test of relationship between uterine development and litter size
The uterine growth and development of the nine high-EBVTNB sows and nine low-EBVTNB sows of similar parity and age were compared in this study. These sows were treated for estrus synchronization following Bartlett et al. (Reference Bartlett, Pain, Hughes, Stott and van Wettere2009) and divided into ‘semen’ and ‘diluent’ control groups. Of them, ‘semen’ group (five high prolific and five low prolific pigs) were inseminated twice with a standard dose of semen from a same Erhualian boar, whereas pigs of the ‘diluent’ control group (four high prolific and four low prolific pigs) were inseminated with the diluent of the same volume without semen. They were slaughtered on day 12 after insemination. Pregnancy was confirmed by observing conceptuses with filamentous or ovoid morphology in uterine flushings (Seo et al., Reference Wilkie, Paszek, Beattie, Alexander, Wheeler and Schook2011). Uterine horns were cut free of ligaments and laid flat with cut edges up. Length and weight of the uterus horns were measured under uniform conditions (Wu and Dziuk, Reference Zhang, Zhang, Yan, Chen, Zhang, Hong and Huang1988), and the length of each uterine horn was measured using a soft tape without extruding. ANOVA was performed to compare the difference in uterine horn weight (UHW) and uterine horn length (UHL) between four groups of sows (pregnant high-EBVTNB, pregnant low-EBVTNB, non-pregnant high-EBVTNB and non-pregnant low-EBVTNB) using SAS 9.2 software (Ziegel, Reference Liu, Dore, Roberts, Krishnan, Hopkins and Godkin1995) with a model including the group as fixed effect and BW as a covariate. Statistical differences among the four groups were compared using the least significant difference multiple test.
Genotyping and quality control
Genomic DNA was extracted from ear tissues of the selected 50 pigs (25 of the 12% top and 25 of the 12% bottom) using a standard phenol/chloroform method, and was diluted to a final concentration of 50 ng/μl, in 15 μl/sample. Two samples were discarded for their poor quality, and 48 DNA samples were genotyped using the PorcineSNP60 BeadChip (Illumina, San Diego, CA, USA). Porcine60K SNP arrays were scanned using iScan (Illumina) and analyzed via BeadStudio (Version 3.2.2; Illumina) following the manufacturer’s protocol. The positions of all SNPs were mapped to the pig reference genome (Sus scrofa 10.2). Quality control was carried out using PLINK (version 1.09) (Purcell et al., Reference Rosendo, Iannuccelli, Gilbert, Riquet, Billon, Amigues, Milan and Bidanel2007). Animals with low genotyping rate (missingness per individual >5%) were excluded. Markers with a minor allele frequency <5% or call rate <95% were eliminated from the data.
Genome-wide association analysis
The associations of the filtered SNPs with TNB and NBA were analyzed using the Genome-wide Efficient Mixed-Model Association (Zhou and Stephens, Reference Zhou, Liu, Li, Bruhn, Krueger, Min, Wang and Carr2012) and the following standard univariate linear mixed model:
 $$\eqalignno{ {\rm y}\,{\equals}\,&{\rm \,W}\alpha \,{\plus}\,{\rm x}\beta \,{\plus}\,u\,{\plus}\,\varepsilon ;\,{\rm u}\,\sim\,{\rm MVN}_{{\rm n}} \left( {0,\,\lambda \tau ^{{{\minus}1}} {\rm K}} \right);\, \cr \ & \,\varepsilon \,\sim\,{\rm MVN}_{{\rm n}} \left( {0,\,\tau ^{{{\minus}1}} {\rm I}_{{\rm n}} } \right)$$
where y is the vector of phenotypes; W is the vector of fixed effects; α is the vector of the corresponding coefficients including the intercept; x is the vector of marker genotypes; β is the effect size of marker, u is the vector of random effects; ϵ is an vector of errors; τ −1 is the variance of residual errors; λ is the ratio between the two variance components; K is a known relatedness matrix and In is an identity matrix. MVNn denotes the dimensional multivariate normal distribution.
In the analysis of TNB and NBA in the first parity, the farm-year-season at farrowing and age of the sows were fitted as fixed effects, the phenotypes for all individuals are TNB and NBA of the first parity. In the analysis of TNB and NBA in the second to seventh parity, the model included permanent environment effect as random effect, the phenotypes for all individuals are the average of TNB and NBA from the second to seventh parity. Manhattan plots were drawn using the corresponding P values by R package. A SNP was considered to have a stringent genome-wide significance when P<0.05/N, and to have a suggestive significance when P<1/N, where N is the number of SNPs which were filtered by PLINK version 1.09 (Purcell et al., Reference Rosendo, Iannuccelli, Gilbert, Riquet, Billon, Amigues, Milan and Bidanel2007).
Validation of the association of rs81447100 with total number born and number born alive
The most significant SNP (rs81447100) within a region on SSC13 harboring a cluster of suggestive SNPs associated with multiparous NBA was genotyped on 313 Erhualian sows, 173 Sutai sows, and 488 Yorkshire sows using Sanger sequencing. A pair of primers (F: GCCACTGGTATGGCCCTAAA, R: CCTTTGGGAGCTTGTGTTCC) were used to amplify a fragment of 445 bp encompassing this SNP. Amplicons were purified and directly sequenced to determine genotypes at this locus. Association between this SNP genotypes and litter size was performed using the following model:
 $$y_{{ijklmn}} {\equals}\mu {\plus}{\rm HFS}_{i} {\plus}{\rm AGE}_{j} {\plus}{\rm PA}_{k} {\plus}{\rm P}_{l} {\plus}{\rm G}_{m} {\plus}{\rm B}_{n} {\plus}e_{{ijklmn}} $$
where y ijklmn is the litter size phenotype; μ is the overall mean; HFS i is the effect of herd-year-season, AGE j is the fixed effect of age of the sow within parity as a covariate; PA k is the fixed effect of parity; P l is the random effect of permanent environment; G m is the fixed effect of genotype; B n is the random effect of service boar; and e ijklmn is the random residual effect.
Identification of candidate genes
Annotated genes around significant SNPs were searched via the Ensembl database (http://asia.ensembl.org/index.html). A window of 2 Mb (1 Mb upstream and 1 Mb downstream of each significant SNP) was screened across the genome (Sandholm et al., Reference Schneider, Rempel, Snelling, Wiedmann, Nonneman and Rohrer2012). The functions of candidate genes were retrieved using the Database for Annotation, Visualization and Integrated Discovery (DAVID, https://david.ncifcrf.gov).
Results
Phenotypic variation of total number born, number born alive and uterine horn length/uterine horn weight within Erhualian pigs
The data of TNB and NBA of Erhualian pigs were shown in Table 1. TNB and NBA increased from primiparity to multiparity, even though there was a large variation in litter size. The variation coefficients of TNB and NBA in primiparous pigs were 19.67% and 20.20%, and those in multiparous pigs were 18.64% and 18.22%, respectively.
Descriptive statistics of total number born (TNB) and number born alive (NBA) in Erhualian pigs

N sow=sows number; N parity=total parity number.
1 Range of TNB or NBA from the smallest value to the largest value.
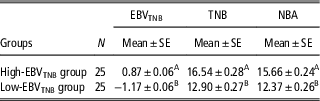
As shown in Table 2, TNB and NBA of high-EBVTNB sows were significantly higher (P<0.01) than those of low-EBVTNB sows. The average TNB and NBA of 25 high-EBVTNB sows was 3.64 and 3.29 pigs more than (P<0.01) those of 25 low-EBVTNB sows, respectively.
Mean and standard error of total number born (TNB) and number born alive (NBA) in high- and low-estimated breeding values of TNB (EBVTNB) groups

A,BValues within the column indicated by different superscripts are significantly (P<0.01) different.
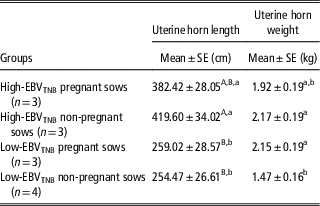
Due to the failure of synchronization and pregnancy in some tested animals, only three pregnant and three non-pregnant high-EBVTNB sows, as well as three pregnant and four non-pregnant low-EBVTNB sows were used to analyze UHL and UHW. The representative pictures of uterus of high-EBVTNB and low-EBVTNB sows were shown in the Supplementary Figure S1. High-EBVTNB sows had longer UHL than low-EBVTNB ones in both pregnant and non-pregnant groups (P<0.01, Table 3). UHW of low-EBVTNB sows were significantly (P<0.01) lower than that of high-EBVTNB sows in the non-pregnant group, but no significant difference was observed in the pregnant group (Table 3).
Comparison of uterine horn length and uterine horn weight between different sow groups

EBVTNB=estimated breeding values of total number born.
A,BValues within the column indicated by different superscripts are significantly (P<0.01) different.
a,bValues within the column indicated by different superscripts are significantly (P<0.05) different.
Genome-wide association study results for total number born and number born alive
There were 59 319 SNPs before frequency and genotyping pruning. No individual was removed for low genotyping after quality control, whereas 3392 SNPs with call rate below 95% and 28 915 SNPs with MAF lower than 5% were removed. In total, 28 020 SNPs were available for GWAS.
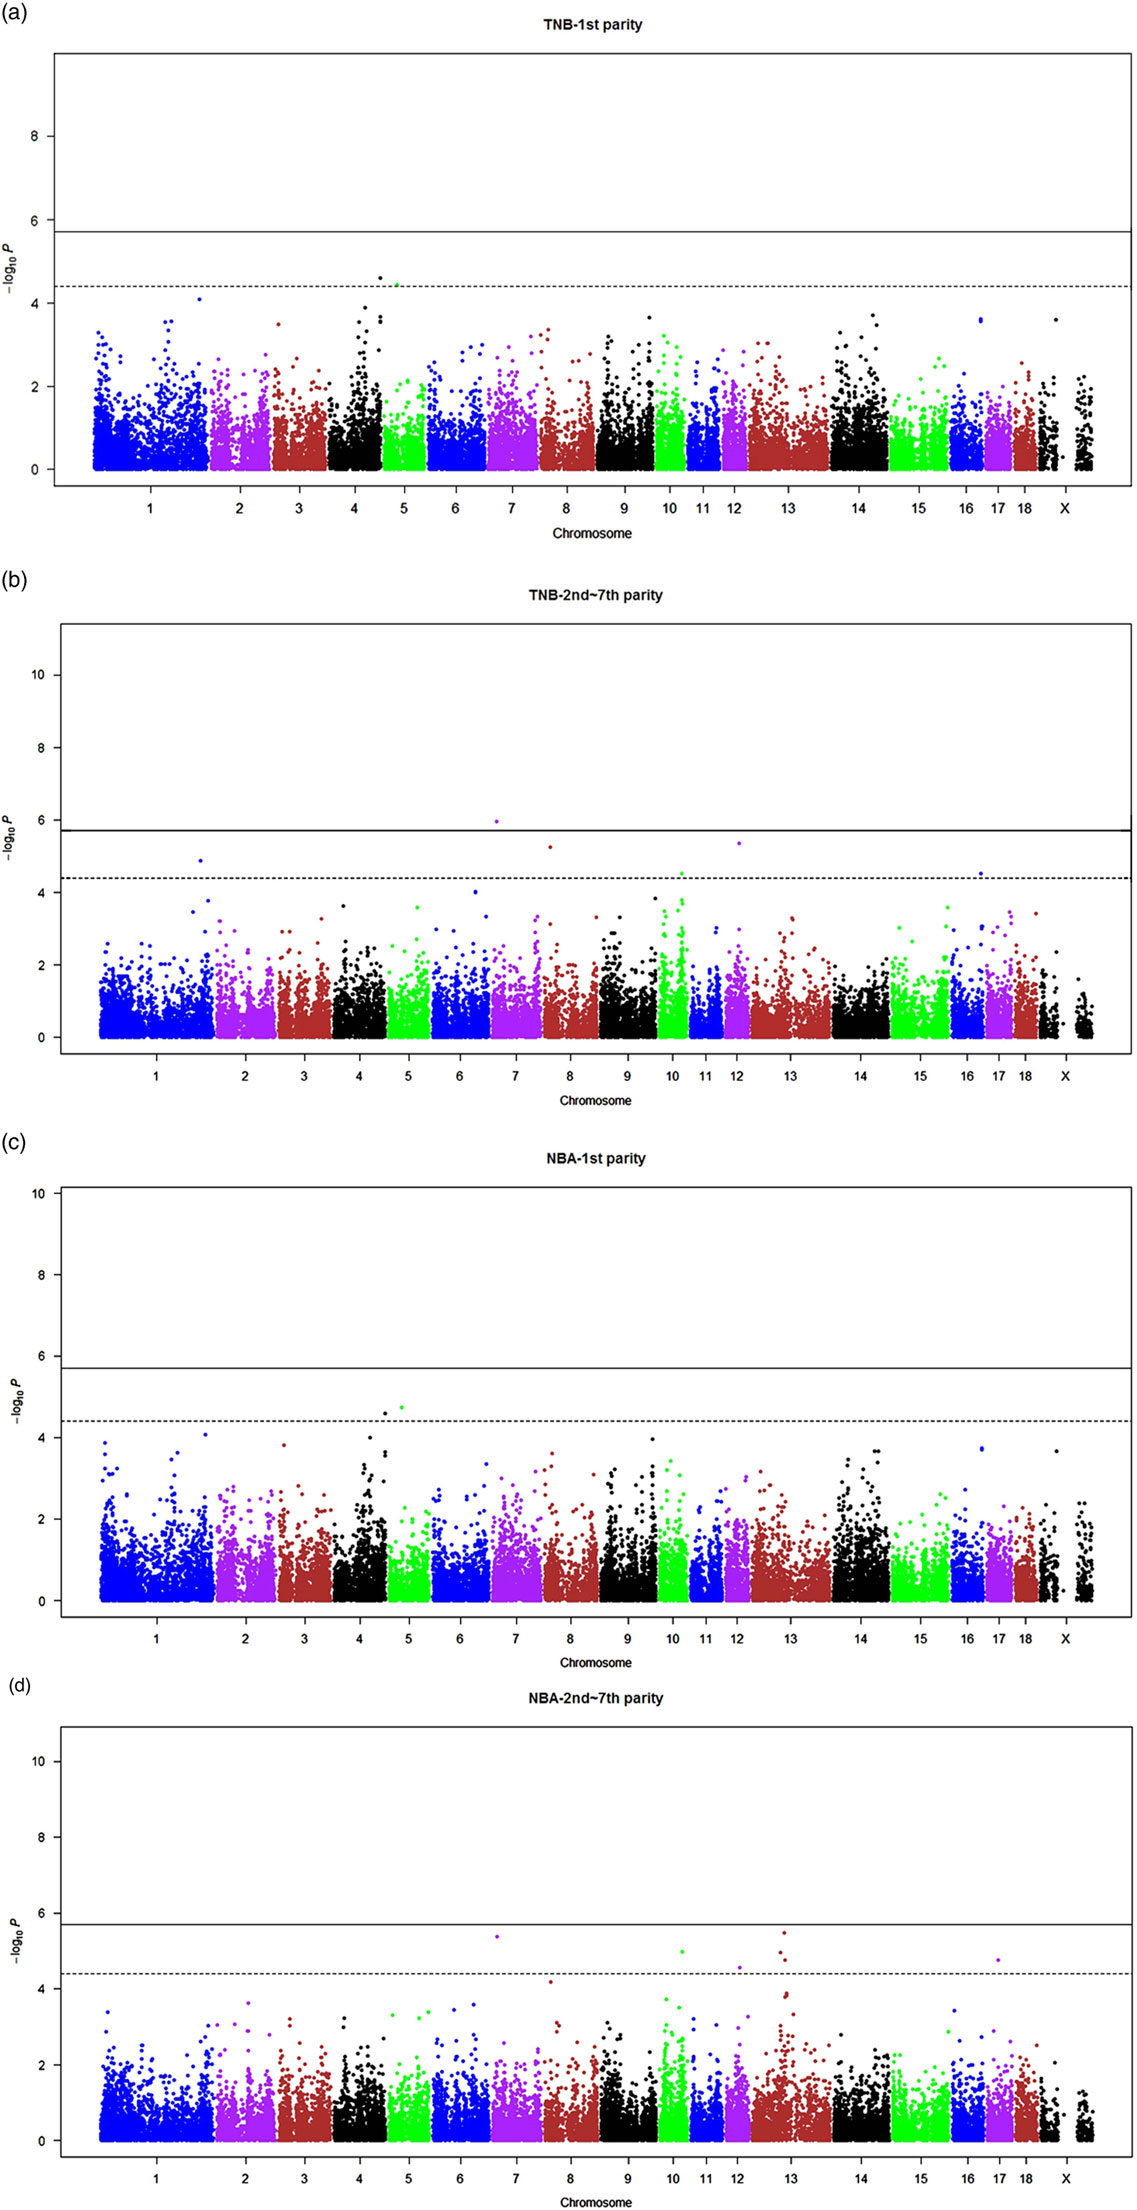
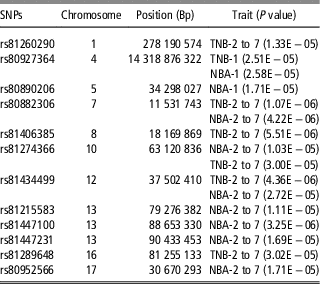
The Q-Q plots of GWAS test statistics were shown in the Supplementary Figure S2. In this study, the average genomic inflation factors (λ) of the GWAS for four litter size traits (TNB and NBA in first parity, TNB and NBA of sows in the second to seventh parity) were 1.09, suggesting that population stratifications were properly adjusted in the tested population. As shown in Figure 1, the Manhattan plots obtained from GWAS for TNB and NBA were based on the data of the high- and low- EBVTNB sows. The genome-wide and suggestive significance thresholds were 1.78e−06 (0.05/28 020) and 3.57e−05 (1/28 020), respectively. A total of 12 SNPs surpassing the significance level were identified for four litter size traits, including one SNP at genome-wide and 11 SNPs at suggestive significance levels, respectively (Table 4). Of these 12 SNPs, four were associated with two traits.
(color online). Manhattans plots of genome-wide association study for four litter size traits in Erhualian sows. Single nucleotide polymorphisms on different chromosomes are denoted by different colors. The solid and dashed lines indicate the Bonferroni-corrected thresholds of the genome-wide and suggestive significances, respectively. Total number born (TNB) in the first parity (a). TNB of the second to seventh parity (b). Number born alive (NBA) in the first parity (c). NBA in the second to the seventh parity (d).

Single nucleotide polymorphisms (SNPs) associated with four litter size traits at genome-wide or suggestive significance levels

TNB-1=total number born in the 1st parity; NBA-1=number born alive in the 1st parity; TNB-2 to 7=total number born in the 2nd to 7th parities; NBA-2 to 7=number born alive in the 2nd to 7th parities.
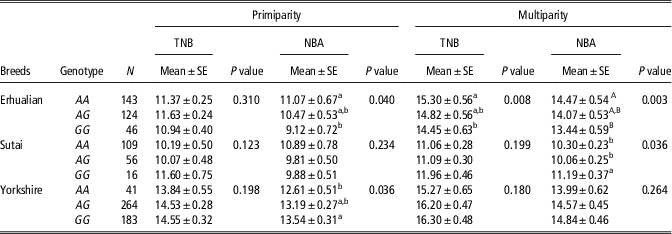
Association of rs81447100 with total number born and number born alive in three populations
To verify the GWAS results, rs81447100 was selected to evaluate its genetic association to litter size in a larger Erhualian population and two additional populations: Sutai and Yorkshire. The results showed that AA sows at this site were superior to AG sows, and AG sows were superior to GG sows for all four litter size traits in the Erhualian population, though some differences were not statistically significant (Table 5). The effect of this marker was significant on TNB (P<0.05), NBA (P<0.01) in the second to seventh parities and NBA in the first parity (P<0.05), respectively. AA individuals had higher TNB, NBA in the second to seventh parities and NBA in the first parity than GG individuals by average 0.85, 1.03 and 1.95 piglets, respectively. In Sutai population, GG individuals had a higher (P<0.05) NBA in the later parities than AG and AA individuals with an average increase of 1.13 and 0.89 piglets, respectively (Table 5). In Yorkshire population, GG sows had a higher (P<0.05) NBA in the first parity of individuals than AA sows by average 0.93 piglet (Table 5).
Association of rs81447100 with total number born (TNB) and number born alive (NBA) in three populations

Primiparity=1st parity; multiparity=2nd to 7th parity.
P value was calculated for the classical F-test.
a,bValues within the column indicated by different superscripts are significantly (P<0.05) different; A,Bvalues within the column indicated by different superscripts are significantly (P<0.01) different.
Discussion
In this study, we observed a large phenotypic variation in litter size within the well-known highly prolific Erhualian breed. Although the population size of the Erhualian breed is small compared with commercial pig breed, it is still necessary to dissect the genetic basis of the phenotypic variation as it is the most prolific pig breed in the word. Currently, the population size of the Erhualian breed remarkably decreased due to the rapid expansion of the population of commercial lean-type pigs. Thus, only some hundreds of sows were raised in the conservation farms of Erhualian pigs. Notably, some of them could not be sampled for analysis because they are short of detail records. In the present study, the litter size information of 207 Erhualian sows for phenotypic variation analysis was collected from the largest conservation farms of Erhualian pigs in China (Changzhou Jiaoxi Cooperatives of Erhualian Pigs). However, the sample size of this analysis is somewhat difficult to increase any more.
Uterine development is an important factor affecting litter size in pigs (Dyck and Swierstra, Reference Dyck and Swierstra1983). Here we showed that UHL was obviously longer in high-EBVTNB sows than in low-EBVTNB ones in both pregnant and non-pregnant groups, and UHW was significantly greater in non-pregnant sows with high-EBVTNB than those with low-EBVTNB, even though the sample size for this comparison was low. This indicates that UHL and UHW are two factors contributing to the variation in litter size within the Erhualian breed, which is consistent with a previous report that UHL affects litter size (Wilson et al., Reference Wolf1999).
By applying GWAS, we identified 12 SNPs associated with litter size in Erhualian sows. We noticed that two SNPs associated with litter size in the first parity did not overlap any of those 10 SNPs with litter size in later parities (Table 4), indicating that different genetic components contribute to litter size at the first parity and latter parities, presumably two different traits in pigs. This assumption is consistent with a previous report (Onteru et al., Reference Orlandi, Ferlosio, Ciucci, Francesconi, Lifschitz-Mercer, Gabbiani, Spagnoli and Czernobilsky2012). Moreover, in the analysis of TNB and NBA in the later parities (the second to seventh parity), the phenotypes for all individuals were the average of TNB and NBA from the second to seventh parity. Although litter size at the latter parities were more stable compared with the first parity, sows might have differences in the phenotypic variation between these six parities and the mean might not represent the litter size phenotype of these six parities completely. Therefore, a best phenotype for litter size of multiple parities deserves exploring in further studies.
Of the 12 significant SNPs, three significant SNPs (rs81215583, rs81447100 and rs81447231) on SSC13 defined a 11.15 Mb (79.28 to 90.43 Mb) region that overlaps with previously reported QTLs for pig UHL (88.98 to 89.25 Mb) (Rosendo et al., Reference Rothschild, Messer, Day, Wales, Short, Southwood and Plastow2012), TNB (78 to 116 Mb) and NBA (67 to 99 Mb) (Noguera et al., Reference Onteru, Fan, Du, Garrick, Stalder and Rothschild2009), and adjacent to the QTL for NBA (90.5 to 91.6 Mb) (Onteru et al., Reference Orlandi, Ferlosio, Ciucci, Francesconi, Lifschitz-Mercer, Gabbiani, Spagnoli and Czernobilsky2012). rs80890206 on SSC5 was located in a reported QTL for UHL (Wilkie et al., Reference Wilson, Biensen and Ford1999). rs80952566 on SSC17 was adjacent to a reported QTL for TNB (Schneider et al., Reference Seo, Kim, Choi and Ka2012). rs81434499 on SSC12 was resided in another reported QTL for litter size (Fernandez-Rodriguez et al., Reference Fernandez-Rodriguez, Rodriguez, Varona, Balcells, Noguera, Ovilo and Fernandez2010), and this loci was also identified in our previous study (He et al., Reference He, Li, Ma, Sui, Gao, Kim, Gu, Huang, Ding and Huang2017). rs81260290 (SSC1), rs80927364 (SSC4), rs80882306 (SSC7), rs81406385 (SSC8), rs81274366 (SSC10) and rs81289648 (SSC16) appeared to be novel QTL for litter size.
We made a close examination on the 79.28 to 90.43 Mb region on SSC13 because it harbored a cluster of consecutive SNPs associated with NBA in latter parities. We were particular interested in the most significant SNP (rs81447100) within this region. This SNP was confirmed to be associated with NBA in three diverse populations including Erhualian, Sutai and Yorkshire, and therefore providing a potential marker for the genetic improvement of litter size not only in Chinese indigenous breeds (Erhualian) but also in synthetic (Sutai) and commercial (Yorkshire) breeds. It should be mentioned that the A allele of rs81447100 is favorable for litter size in Erhualian sows but unfavorable in Sutai and Yorkshire sows. The reason for this discrepancy could be that rs81447100 is in different linkage disequilibrium phases with the causative mutation for the SSC13 QTL in Erhualian and Sutai\Yorkshire populations. In addition, the size of verified population was still limited, rs81447100 should be tested in other cohort of pigs from multiple population in the further studies.
Other nine significant markers were distributed alone in nine different chromosomes, respectively. In GWAS of sufficient power, singleton associations (genomic regions displaying a single SNP with significant association) are considered with caution as these might be spurious results. In this study, the number of SNPs after quality control was 28 020, which led the marker density on chromosome of this research to be 1 SNP/100 kb (on average). On the other hand, previous studies had shown the linkage disequilibrium (LD) extent was much lower in Chinese domestic pigs (5 Kb) than in European domestic pigs (17.5 Kb), which suggests that there is almost no LD between pairs of genes across Chinese diverse local breeds (Ai et al., Reference Ai, Fang, Yang, Huang, Chen, Mao, Zhang, Zhang, Cui, He, Yang, Yao, Zhou, Han, Li, Sun, Xie, Lai, Su, Lu, Yang, Huang, Deng, Nielsen, Ren and Huang2015). Thus, it is hard to confirm whether the singleton associations are spurious results in this study. These nine significant markers still need to be verified in multiple population in the following study.
Seven genes were identified in a genomic region of 2 Mb around the significant SNP rs81447100 on SSC13, including mitochondrial ribosomal protein S22, coatomer protein complex subunit β2, retinol binding protein 2 (RBP2), retinol binding protein 1 (RBP1), calsyntenin 2, tripartite motif containing 42 and solute carrier family 25 member 36 (Supplementary Table S2). Among these genes, RBP1 and RBP2 belong to a family of retinol-binding proteins (RBPs) that exert diverse functions related to endometrial development and growth of conceptus in porcine (Johansson et al., Reference Johansson, Dencker and Dantzer2001; Orlandi et al., Reference Padmanabhan, Jia, Geary-Joo, Wu, Ferguson-Smith, Fung, Bieda, Snyder, Gravel, Cross and Watson2006). Retinol plays a crucial role in the growth and differentiation of various body tissues, and it has been previously reported that embryos are extremely sensitive to alterations in retinol concentration that can lead to spontaneous abortion and malformations occurring during development (Wolf, Reference Wu and Dziuk1983; Liu et al., Reference Madsen, Sørensen, Su, Damgaard, Thomsen and Labouriau1993). Retinol-binding proteins are a kind of circulating carrier proteins for serum as well as cellular retinol and retinol acid, which plays important roles in storage, metabolism of vitamin A and transport of vitamin A to the target cells (Blaner, Reference Blaner1989). Typically, RBP is synthesized within the liver with secretion being dependent upon retinol concentrations. In recent years, RBP synthesis has also been found in the endometrium, conceptus and extra embryonic tissues of various livestock species (Liu and Godkin, Reference Liu and Godkin1992; Harney et al., Reference Harney, Ott, Geisert and Bazer1994). Previous studies have shown that RBP has an important influence on the reproductive performance, uterus growth and embryo development in many domestic animals, especially in pigs (Harney et al., Reference Harney, Ali, Vedeckis and Bazer1993 and Reference Harney, Ott, Geisert and Bazer1994). RBP has four morphological categories, of which RBP4 has been proposed as a candidate gene for maintenance of pregnancy and embryo development (Harney et al., Reference Harney, Ali, Vedeckis and Bazer1993; Rothschild et al., Reference Sandholm, Salem, McKnight, Brennan, Forsblom, Isakova, McKay, Williams, Sadlier, Makinen, Swan, Palmer, Boright, Ahlqvist, Deshmukh, Keller, Huang, Ahola, Fagerholm, Gordin, Harjutsalo, He, Heikkila, Hietala, Kyto, Lahermo, Lehto, Lithovius, Osterholm, Parkkonen, Pitkaniemi, Rosengard-Barlund, Saraheimo, Sarti, Soderlund, Soro-Paavonen, Syreeni, Thorn, Tikkanen, Tolonen, Tryggvason, Tuomilehto, Waden, Gill, Prior, Guiducci, Mirel, Taylor, Hosseini, Group, Parving, Rossing, Tarnow, Ladenvall, Alhenc-Gelas, Lefebvre, Rigalleau, Roussel, Tregouet, Maestroni, Maestroni, Falhammar, Gu, Mollsten, Cimponeriu, Ioana, Mota, Mota, Serafinceanu, Stavarachi, Hanson, Nelson, Kretzler, Colhoun, Panduru, Gu, Brismar, Zerbini, Hadjadj, Marre, Groop, Lajer, Bull, Waggott, Paterson, Savage, Bain, Martin, Hirschhorn, Godson, Florez, Groop and Maxwell2000). Our results indicate that RBP1 and RBP2 could also have important potential effects on uterus development such as UHL, thus affecting pig litter size. In further analysis, fine mapping of the QTL around rs81447100 for litter size will be conducted to identify the underlying causative genes. In addition, seven candidate genes including RBP1 and RBP2 around rs81447100 could be sequenced in Erhualian sows to identify additional variants that would then be genotyped in other larger cohort of pigs from multiple populations in an effort to identify a more robust genetic marker for assisted selection in further studies. In all, 84 genes were identified around other significant SNPs. A total of 79 genes out of the 84 genes were annotated in DAVID database. Among these genes, jumonji, AT rich interactive domain 2 (JARID2), a gene adjacent to rs80882306 on SSC7, is required for the differentiation of mouse embryonic stem cells. It is essential for the binding of PcG proteins to target genes to mediate the proper differentiation of embryonic stem cells and normal development. So JARID2 has been associated with the embryonic development in sows (Pasini et al., Reference Purcell, Neale, Todd-Brown, Thomas, Ferreira, Bender, Maller, Sklar, de Bakker, Daly and Sham2010). At 162 Kb upstream of rs81434499 on SSC12, VMP1 appeared to be a candidate gene for embryo implantation (Hu et al., Reference Hu, Ren, Liu, Zhao, Yu, Su, Ma, Ni, Lei and Yang2008). At 545 Kb downstream of rs81447231 on SSC13, ATR could assist to sustain cell proliferation and embryonic development (Zhou et al., Reference Ziegel2013). At 931 Kb upstream of rs81289648 on SSC16, MTRRR is closely related to intrauterine growth defects and congenital malformations (Padmanabhan et al., Reference Pasini, Cloos, Walfridsson, Olsson, Bukowski, Johansen, Bak, Tommerup, Rappsilber and Helin2013).
In conclusion, we conclude that a large phenotypic variation exists in litter size of the Erhualian pig breed. We have confirmed seven previously reported QTLs and identified six novel QTLs for litter size in pigs. A locus (rs81447100) on SSC13 could be a potential marker for litter size in three diverse pig breeds including Erhualian, Sutai and Yorkshire. These findings would also facilitate the follow-up identification of causative variant(s) underlying the SSC13 QTL effect on litter size.
Acknowledgments
The authors would like to thank Jia Zhang, Yueqing Gu and Hangao Ding for their assistance in this trial. Jun Ren (College of Animal Science and Veterinary Medicine, Jiangxi Agricultural University, Nanchang 330045, China.) is kindly acknowledged for his helpful comments on this paper. This work was supported by grants from the National Natural Science Foundation of China (no. 31601923), the Natural Science Foundation of Jiangsu Province (BK20140688), the High-Tech Foundation of Jiangsu Province (BE2014396) and the National 973 program (2014CB138501).
Declaration of interest
The authors declare no competing interests.
Ethics statement
All procedures involving animals were carried out in accordance with the Guidelines for the Care and Use of Laboratory Animals prepared by the Institutional Animal Care and Use Committee of Nanjing Agricultural University, Nanjing, China. All experimental protocols were approved by the Animal Care and Use Committee of Nanjing Agricultural University, 1999.
Software and data repository resources
All data of experiment are deposited in institute of Swine Science’s library and the access rights are for authors.
Supplementary material
To view supplementary material for this article, please visit https://doi.org/10.1017/S1751731118000332