


INTRODUCTION AND REGIONAL SETTING
During the final phase of glacial retreat from the Northern Great Plains of Canada and the United States, lakes formed along the margin of the Laurentide Ice Sheet (LIS), as runoff was dammed on the north-sloping landscape. The newly deglaciated topography controlled the extent of these lakes, the routing of meltwater, and the late-glacial flow patterns of the retreating LIS.
Lake Agassiz was the largest ice-marginal lake, occupying the region east of a prominent 675-km-long bedrock escarpment that extends south from Saskatchewan through Manitoba (the Manitoba Escarpment) into North Dakota to the South Dakota border (the Pembina Escarpment) (see Fig. 1). In total, Lake Agassiz covered an area of ~1.5 million km2, although only a part of that area was covered by water at any one time. The lake expanded and contracted, and deepened and shallowed, as the LIS fluctuated and outlets from the lake changed. The life of Lake Agassiz spanned nearly 6000 cal yr, forming first in the southernmost end before 14 cal ka BP and finally draining into Hudson Bay around 8.2–8.4 cal ka BP (e.g., Barber et al., Reference Barber, Dyke, Hillaire-Marcel, Jennings, Andrews, Kerwin, Bilodeau, McNeely, Southons, Morehead and Gagnoll1999; Teller and Leverington, Reference Teller and Leverington2004).
Map of southwestern Manitoba, showing Riding and Duck Mountains west of the Manitoba Escarpment (dashed line), the Lake Agassiz basin, several proglacial lakes, and various glacial spillways (after Wolfe and Teller, Reference Wolfe and Teller1995, fig. 1). Sample sites shown by circled letters. Boxed area shows location of Figure 3.
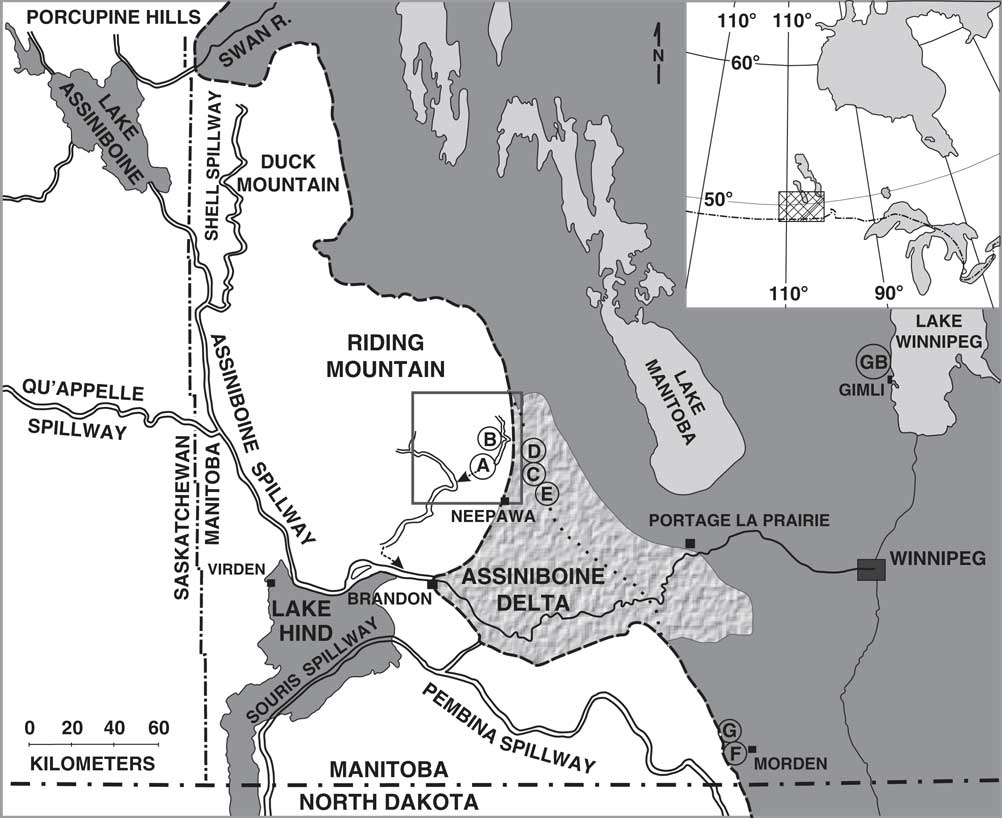
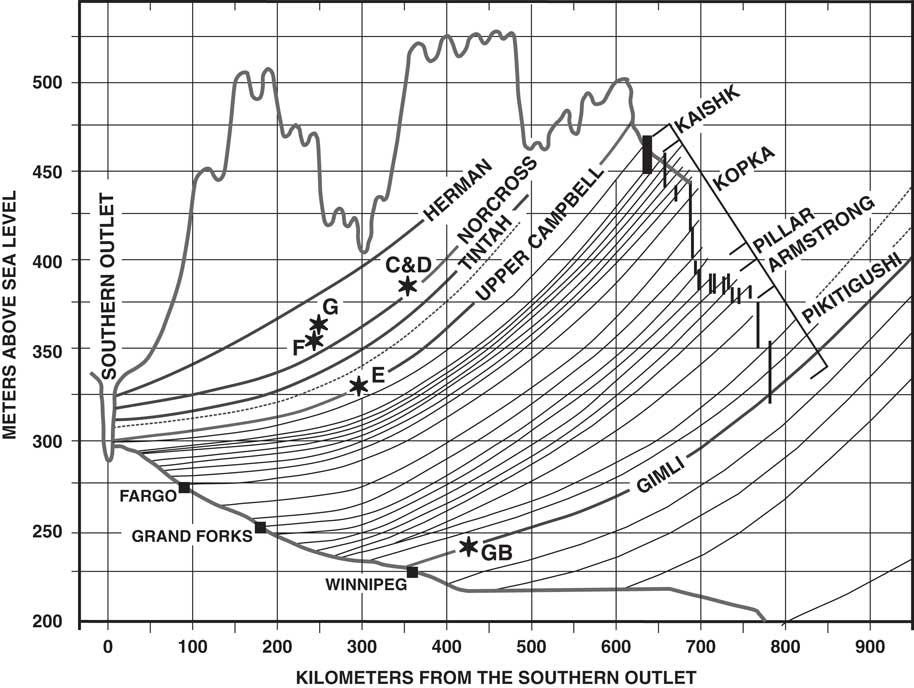
The floor of the Lake Agassiz basin is generally flat and covered by lacustrine clay and silt; it is rimmed by numerous sandy and gravelly beaches of varying size and at varying elevations (e.g., Upham, Reference Upham1895; Johnston, Reference Johnston1946; Elson, Reference Elson1967; Fenton et al., Reference Fenton, Moran, Teller and Clayton1983; Yang and Teller, Reference Yang and Teller2012; Breckenridge, Reference Breckenridge2015; Teller and Yang, Reference Teller and Yang2015). Most strandlines are low in relief, discontinuous, and only a few tens of meters wide; in places they consist of small wave-eroded escarpments bordered by small beaches. The oldest beaches in the basin consist of three groups of strandlines, named the Herman, Norcross, and Tintah (HNT), which lie at the highest elevations along the base of the Manitoba-Pembina Escarpment and form a discontinuous 1- to 5-km-wide band of parallel ridges in a gently to moderately sloping zone from Saskatchewan through Manitoba and North Dakota. These three groups of isostatically deformed beaches, as well as other beaches with multiple ridges, are represented in Figure 2 by single lines. The oldest beaches are present as far north as Duck Mountain, Manitoba (Fig. 1) (Upham, Reference Upham1895; Johnston, Reference Johnston1931, Reference Johnston1946).
Reconstructed strandline profiles in the Lake Agassiz basin, showing deformation attributable to differential isostatic rebound drawn at 90° to isobase lines on the Campbell beach (Teller and Thorleifson, Reference Teller and Thorleifson1983, fig. 2). Approximate locations of optically stimulated luminescence dated samples in this study shown by asterisks and sample letters C, D, E, F, G, and GB. Some strandlines shown represent multiple beaches, such as the Herman, Norcross, and Tintah (see Johnston, Reference Johnston1946, fig. 2). Data used to reconstruct strandlines are largely from Johnston (Reference Johnston1946), who used scattered elevations on beaches correlated by geomorphology that had large gaps between many segments and data points.
West of the escarpment, there are a series of large upland regions named (from north to south) the Wapawekka Hills, the Pasquia Hills, the Porcupine Hills, Duck Mountain, and Riding Mountain. The uplands become more continuous south of Brandon, Manitoba, and continue into the United States. Figure 1 shows the uplands and the escarpment in Manitoba. There are broad reentrants in the escarpment, each containing large valleys eroded by the LIS and glacial meltwater. These valleys were partly filled by thick outwash derived from the Canadian Prairies during deglaciation and include several large fan deltas such as the Assiniboine delta along the southern side of Riding Mountain (Fig. 1). The elevation of the upland areas above the Lake Agassiz lowland ranges from <100 m in the south to ~425 m along Duck Mountain. On the uplands to the west of the escarpment in Manitoba, the landscape is hummocky and is covered by glaciogenic sediments such as till, glaciofluvial and glaciolacustrine deposits, and locally derived fluvial, lacustrine, and peaty sediments of Holocene age (Klassen, Reference Klassen1979; McGinn, Reference McGinn1991, Reference McGinn2000, Reference McGinn2002; Fullerton et al., Reference Fullerton, Ringrose, Clayton, Schreiner and Goebel2000; McGinn and Zaniewski, Reference McGinn and Zaniewski2004; McGinn et al., 2007, Reference McGinn, Wiseman and Zaniewski2009). The upland is underlain by Cretaceous bedrock of the Pierre Shale Formation and is capped by the resistant siliceous Odanah shale (Bannatyne, Reference Bannatyne1970). The base of the eastward-facing slope of the escarpment forms the western boundary of Lake Agassiz deposits and is overlain by alluvium, colluvium, and sediments related to beaches and lagoons of Lake Agassiz.
This article presents optically stimulated luminescence (OSL) ages from (1) ice-marginal glaciofluvial sands on Riding Mountain; (2) beaches of Lake Agassiz along the eastern side of Riding Mountain; (3) beaches to the south near Morden, Manitoba, which lie along the Manitoba Escarpment; and (4) a lower beach ridge 175 km to the east of Riding Mountain. These first-ever OSL ages of Lake Agassiz shorelines in Manitoba enable a comparison of ages of ice-marginal glaciofluvial sediments immediately to the west on Riding Mountain and facilitate an estimate of the timing of deglaciation in this region. An understanding of the extent of the LIS through time is important because the ice controlled the outlets of Lake Agassiz that carried water to the oceans and that, in turn, allows an interpretation of how those waters may have affected late-glacial ocean circulation (e.g., Broecker et al., Reference Broecker, Kennett, Flower, Teller, Trumbore, Bonani and Wolfli1989; Clark et al., Reference Clark, Marshall, Clarke, Hostetler, Licciardi and Teller2001; Condron and Windsor, Reference Condron and Windsor2012).
METHODOLOGY
Samples for OSL dating were collected from sand or pebbly sand facies in fresh exposures in sand and gravel pits. Twenty-centimeter-long, 3.3-cm-diameter aluminum core tubes with steel end caps were driven horizontally into the face, and then capped and sealed. Based on sedimentary structures and morphology, samples were taken from fluvial beds on Riding Mountain and from shoreline (beach) deposits in the main Lake Agassiz basin. At each sampled site, a detailed stratigraphic section was prepared (see the Supplementary Materials). The luminescence age analyses were done at the Physical Research Laboratory, Ahmedabad, India.
Sample preparation for OSL dating was made under subdued red light from LEDs emitting at >630 nm. Samples were treated with 1N HCl followed by 30% H2O2 for 12 hours to remove carbonates and organic materials. Grains in the size range of 150–210 µm were obtained by sieving, and feldspar and other magnetic grains were separated from quartz using a Frantz Magnetic separator (Porat, Reference Porat2006). The extracted quartz-rich fraction was etched with 40% HF for 60 minutes followed by 12N HCl treatment. The resultant fraction was sieved again to remove grains <150 µm. For OSL measurements, quartz grains spread as monolayers over ~3 mm diameter on 9.65 mm stainless steel aliquots were used. Infrared stimulated luminescence tests were performed on three representative aliquots of each sample to ensure that the quartz fraction had no feldspar contamination.
Optical stimulation was by LEDs emitting at 470±30 nm with 50 mW/cm2 maximum power mounted on a Risø TL/OSL DA-20 reader (Bøtter-Jensen et al., Reference Bøtter-Jensen, Bulur, Duller and Murray2000). Typically, 70% power was used for stimulation with the sample at 125°C. The detection optics comprised Hoya U-340 and BG-39 filters that permitted transmission in the region of 290–370 nm with a peak at ~340 nm (Aitken, Reference Aitken1998). Beta irradiation was made on plate using a 40 mCi 90Sr/90Y source delivering 0.1127 Gy/s to the grains on the aliquot.
Standard Single-Aliquot Regeneration (SAR) protocol (Murray and Wintle, Reference Murray and Wintle2000) was used with a preheat at 240°C for 30 seconds. The luminescence signal from the initial 1.6 seconds was used as the dating signal, and the last 8-second integral signal was used for background correction. Acceptance criterion comprised the following limits: recuperation <5%, recycling ratio 1±0.1, and test dose error <10%. The dose-response curve was fitted to a saturating exponential, and typically, depending on the sample yield after chemical pretreatment and sieving, 11–48 equivalent doses (D e ) that satisfied the acceptance criterion could be determined. Of the 13 samples, ages of 7 were based on measurements on 30–48 aliquots. Ages of 5 other samples were based on 23–29 aliquots, and for 1 sample, the yield of quartz grains permitted only 11 aliquots (Table 1). Although it is indisputably desirable to obtain a higher number of D e values for such littoral samples, we were limited in our efforts by the sample yield. However, we feel that the nature of dose distributions and the overall stratigraphic consistency of ages imply that the ages are reasonably secure. The dose distributions are given in Supplementary Figure 1. Ages were computed using the mean values and also the leading edge method (Lepper and Mckeever, Reference Lepper and Mckeever2002) (Table 1). The computation of final ages was in accordance with the work of Chauhan and Singhvi (Reference Chauhan and Singhvi2011), which indicated that most dispersion in these samples was attributable to heterogeneity of the beta dose. In the present case where the K concentration ranges from 0.7% to 1.6%, the anticipated dispersion because of heterogeneity of the beta dose distribution is given by the minimum to maximum paleodose ratio of <10, and hence, we used the mean dose for the computation of ages. With the exception of two samples, ages from two approaches were within errors, supporting the inference that the samples were generally well bleached. For one sample, B, we used the age based on the leading edge method of Lepper and Mckeever (Reference Lepper and Mckeever2002), as this sample had a low yield of quartz grains that permitted only 11 discs and the ratio of D e max to D e min was >10. Supplementary Figure 1 (Supplementary Materials) provides typical optical decay curves, growth curves, and dose distribution for all samples.
Luminescence doses and calculated optically stimulated luminescence ages of samples. Ages and calculations for samples UNL237 and UNL238 from R. Goble (personal communication, 2001).

Notes: D e of sample B is based on limited data. Mean age used for all samples except for sample B (Riding Mountain) and sample MOD-LK-WPG. HNT, Herman, Norcross, and Tintah; OD, overdispersion.
a Exact site locations given in the Supplementary Materials, except for MOD-LK-WPG, UNL237, and UNL238, which are stated in the text.
The dose rate was computed using the elemental concentrations of U, Th, and K (Table 1), measured using a high-purity germanium detector. Samples were kept sealed for 3 weeks for the buildup of radon prior to counting. Moisture content could not be measured in the samples because of logistical difficulties, and an estimate was used based on an estimate of the average of time-varying and seasonally fluctuating precipitation. Specifically, our estimates of average moisture content during the antiquity of the samples considered that (1) early postglacial climate would have resulted in higher moisture contents, (2) the mid-Holocene climate was drier and warmer as indicated by numerous paleoenvironmental studies across the region (e.g., Laird et al., Reference Laird, Fritz, Grimm and Mueller1996; Last and Teller, Reference Last and Teller2004; Grimm et al., Reference Grimm, Donovan and Brown2011; Teller et al., Reference Teller, Rühland, Smol, Mellors and Paterson2018), and (3) modern precipitation. We also took cognizance of the topographic and stratigraphic setting and field estimates (Table 1) and were additionally guided by moisture contents of samples from a similar Lake Agassiz setting used by Lepper et al. (Reference Lepper, Buell, Fisher and Lowell2013). Given that a 1% increase in the estimated moisture content typically reduces the dose rate and decreases the age by ~1%, we consider that marginal inaccuracies in the estimate of moisture content will not affect the interpretations to any appreciable extent. The dose rate calculation for the modern surface sample took into account the sample geometry and the range of beta and gamma radiations. The dose rates ranged between 1.0 and 1.77 Gy/ka with the sole exception of sample A1, which had 2.97 Gy/ka, perhaps because of the high shale content. Table 1 provides the age data. OSL ages are in calendar years, and radiocarbon ages are in calibrated calendar years.
SELECTION, SETTING, AND GENERAL DESCRIPTION OF SAMPLE SITES
The primary objective of this study was to determine the OSL ages of samples from sand and gravel in the oldest beaches of Lake Agassiz (Herman and Norcross) along the western side of the basin in Manitoba to establish a correlation with beaches to the south and to establish the chronology of ice retreat and expansion of Lake Agassiz in this region. A second objective was to compare these ages with those of sediments deposited in a meltwater channel on the adjacent Riding Mountain upland, which morphological considerations indicated must have formed before the nearby Lake Agassiz beaches that lie at lower elevations. To help establish the ages of two other beaches, we also sampled the nearby Campbell beach and the Gimli beach 170 km to the east, both of which lie at lower elevations (Figs. 1 and 2). The exact locations and elevations of the sample sites are given in Supplementary Table 1 (in the Supplementary Materials).
Riding Mountain
McGinn (Reference McGinn1991, 2002) and McGinn et al. (Reference McGinn, Wiseman and Zaniewski2009) mapped the extent of superglacial Lake Proven on Riding Mountain (Fig. 3), located to the west of Lake Agassiz and more than 200 m above its highest level. The extent of this complex lake system changed through time as its bounding glacial margins melted and river systems leading into and away from it evolved. Although there are no distinct beaches around the lake, large overflow channels were eroded, and sand and gravel were deposited in them as surrounding ice melted. Figure 3 shows the area covered by this lake and the two main channels that carried overflow from it, the McFadden Valley–Polonia Trench (MVPT) and the Lower Rolling River Outlet. The flat-bottomed MVPT channel is ~33 km long (Fig. 3), 1 km wide at the valley rim, and deeply entrenched into the underlying till and Odonah shale by up to 50 m in the northern MV region and by 20–40 m in the southern PT segment.
Map with cultural features, landforms, and Quaternary deposits on Riding Mountain upland, showing glacial Lake Proven, McFadden Valley–Polonia Trench, and the Rolling River outlet that carried meltwater into the lowlands to the south (McGinn and Zaniewski, Reference McGinn and Zaniewski2004, fig. 1). The late-glacial margin of the Laurentide Ice Sheet lay just east of the crest of the Manitoba Escarpment that is shown by the dash-dot line.
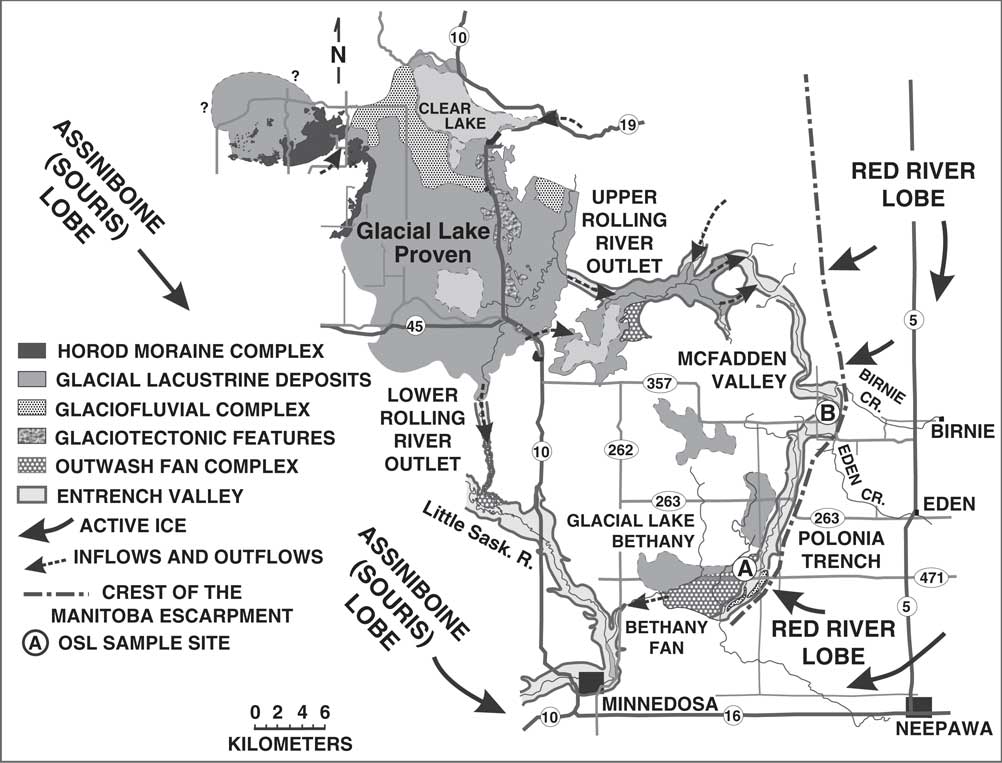
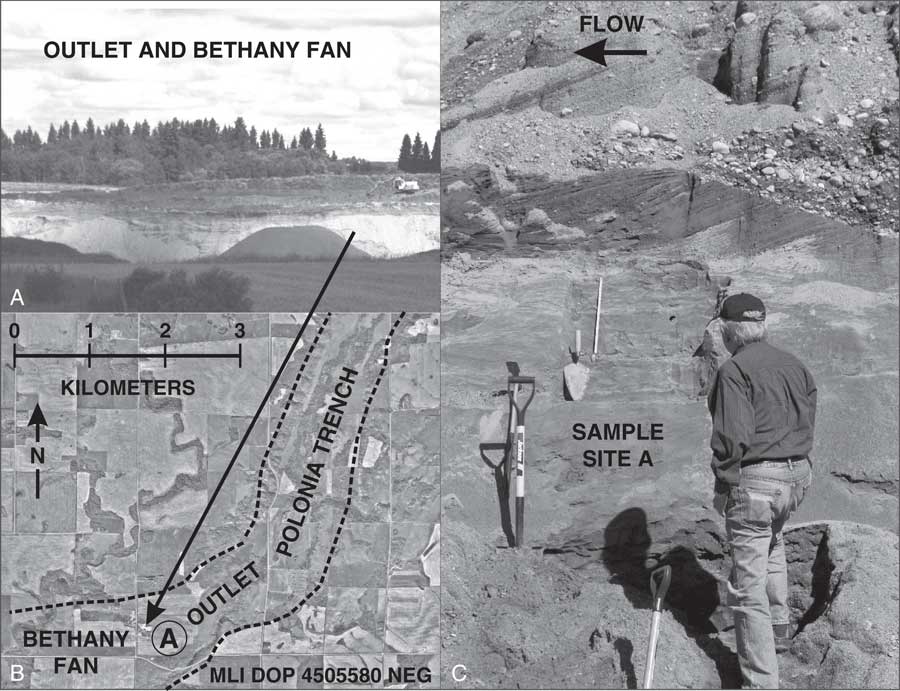
Two samples (A1 and A2) were collected from a 1-m-thick sandy silt lens at site A (Fig. 3), bounded by sand and sandy gravel, in the subaqueous Bethany outwash fan deposited at the southern end of the MVPT meltwater spillway (site A, Figs. 3 and 4; see stratigraphic section in the Supplementary Materials). Ages of these samples were obtained to provide the minimum age for entrenchment of the MVPT channel and the time of deglaciation in the adjacent Lake Agassiz basin and age of the oldest beaches.
Images showing cut through Bethany Fan (A), aerial photo showing lower Polonia Trench at Bethany Fan (B), and fluvial sands and gravels in Bethany Fan where samples A1 and A2 were collected (C). Stratigraphic details of sampled sequence are in the Supplementary Materials.
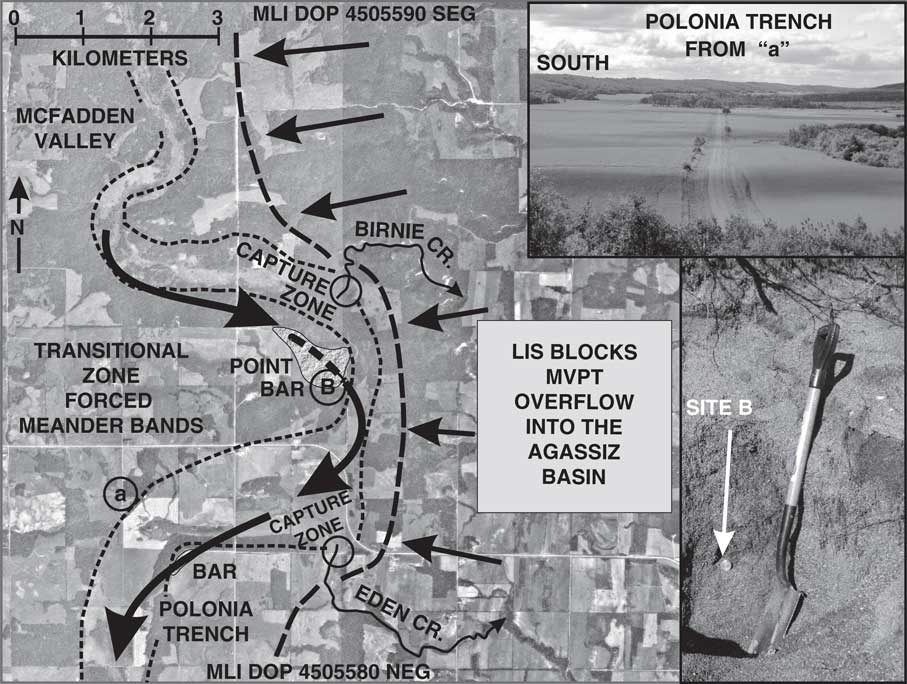
About 16 km to the northeast, a >2-m-thick pebbly coarse sand was sampled in the MVPT. This sample (B) was collected in a pit near the base (and ~40 m below the top) of a large cobble gravel mega point bar deposited in a prominent 180° bend in MVPT, where it turns away from the crest of the escarpment (site B, Fig. 5; see stratigraphic section in the Supplementary Materials). This sample was collected to place a minimum age on the entrenchment of the MVPT valley, which postdates retreat of the LIS from the nearby Lake Agassiz basin.
Aerial photo of meander loop and large point bar in McFadden Valley–Polonia Trench (MVPT), showing forced meander bend where the MVPT encountered the edge of Red River Lobe of the Laurentide Ice Sheet at the Manitoba Escarpment; zones circled where Birnie Creek and Eden Creek later captured drainage of the Polonia Trench. Ground views show Polonia Trench near capture zone and sample site B.
Beaches of Lake Agassiz east of Riding Mountain
Beaches of glacial Lake Agassiz extend for hundreds of kilometers along the Manitoba-Pembina Escarpment. Some of these strandlines are distinct and continuous for many kilometers; others occur as small and discontinuous features (see Fig. 6). Some beaches have multiple crests (e.g., Mihychuk and Groom, Reference Mihychuk and Groom1979), and some named beaches actually consist of groups of strandlines composed of several distinct and separate ridges (e.g., Johnston, Reference Johnston1946, fig. 2). Good grain-size sorting and planar bedding of the sediments, combined with the elevated ridge morphology, characterize most of these beaches. The Herman beaches have not been mapped as far north as Riding Mountain (Upham, Reference Upham1895; Johnston, Reference Johnston1931, Reference Johnston1946). Three samples were collected from what Johnston (Reference Johnston1931, Reference Johnston1946) identified as one of the Norcross beaches in the HNT complex of 9 beaches, east of Riding Mountain; most of these beaches are low in relief and barely visible on aerial photos (see Fig. 6). Mapping shows the numerous beach crests on this <1-km-wide Norcross beach in the area where we collected our samples (e.g., Mihychuk and Groom, Reference Mihychuk and Groom1979). Upham (Reference Upham1895) and Johnston (Reference Johnston1931, Reference Johnston1946) show some of these beaches extending north along Duck Mountain (Fig. 1) for another 200 km. Stratigraphic sections of these sample sites are presented in the Supplementary Materials. These samples were dated to assess the correlation and the ages of the highest beaches of Lake Agassiz in this area that had been established by others to the south, as well as to help constrain the age of ice retreat from this area.
Aerial photo of several Campbell beaches showing sample site E near Arden, Manitoba. Outcrops of sample sites C and D in the Norcross beach series shown and located on aerial photo; note how subtle the NNE-SSW oriented Norcross beaches in the region around around sites C and D are in the photo. Stratigraphic details of sampled sections are in the Supplementary Materials.
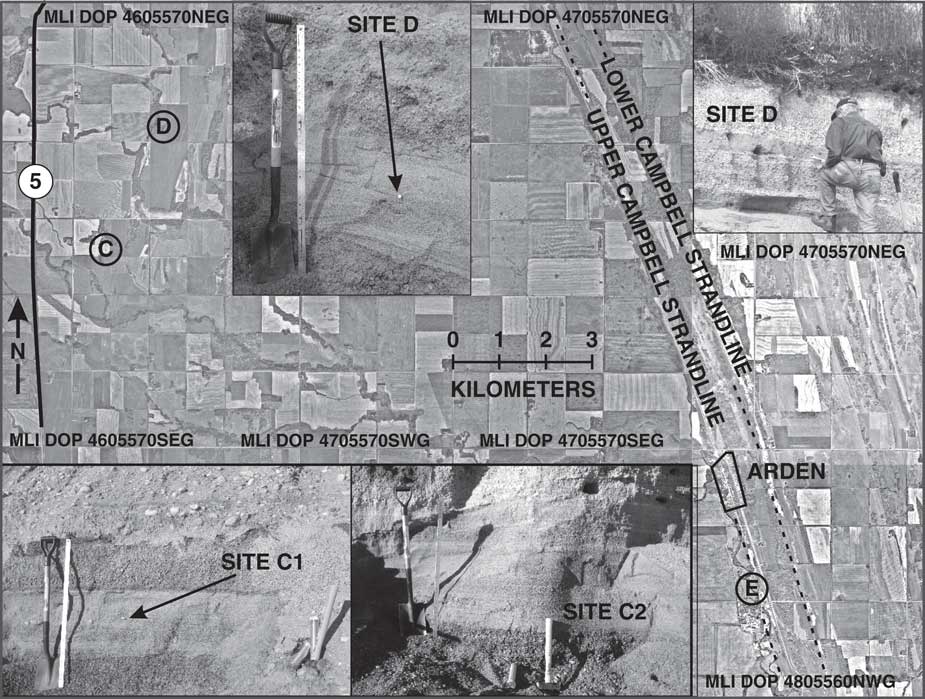
Samples were also taken from the Campbell beach, which is the largest, most distinct, and continuous beach complex in the Lake Agassiz basin. In this area, the most prominent Campbell strandline lies ~50 m lower in elevation than the sampled Norcross beach (see Fig. 2). Sample site E in the upper Campbell beach is located ~15 km to the southeast of Norcross sample site D on the gently sloping regional surface below the escarpment (Fig. 6) (see stratigraphic sections in the Supplementary Materials). Samples at site E were taken from the highest and largest ridge of the Campbell beach complex (Fig. 6) and lie 2–3 m above the adjacent paleolagoon to the west and 4–8 m above the next lower Campbell beach to the east. This dating was done to compare OSL ages in Manitoba with ages elsewhere on this distinct beach.
Two sites in the Gimli beach ridge were sampled (GB-A and GB-B). This feature is a distinct broad ridge ~170 km east of the Campbell beaches, which lies 84 m below the elevation of the Campbell beach and >100 m below the lowest HNT strandline sampled to the west (Fig. 2). The sample sites are 5 km west of modern Lake Winnipeg and 90 km north of the city of Winnipeg (Fig. 1). Each pit exposure consisted of ~2 m of horizontally bedded and laminated, well-sorted pebbly sand in a sand and fine gravel sequence (see stratigraphic sections in the Supplementary Materials). Samples from the Gimli beach were collected to establish the age of a previously undated strandline that had always been interpreted as one of the youngest in the Lake Agassiz basin. We also sampled the modern Lake Winnipeg beach, just north of the town of Gimli, Manitoba, and about 14 km southeast of the samples collected from Gimli beach ridge of Lake Agassiz.
Beaches of Lake Agassiz along the escarpment near Morden
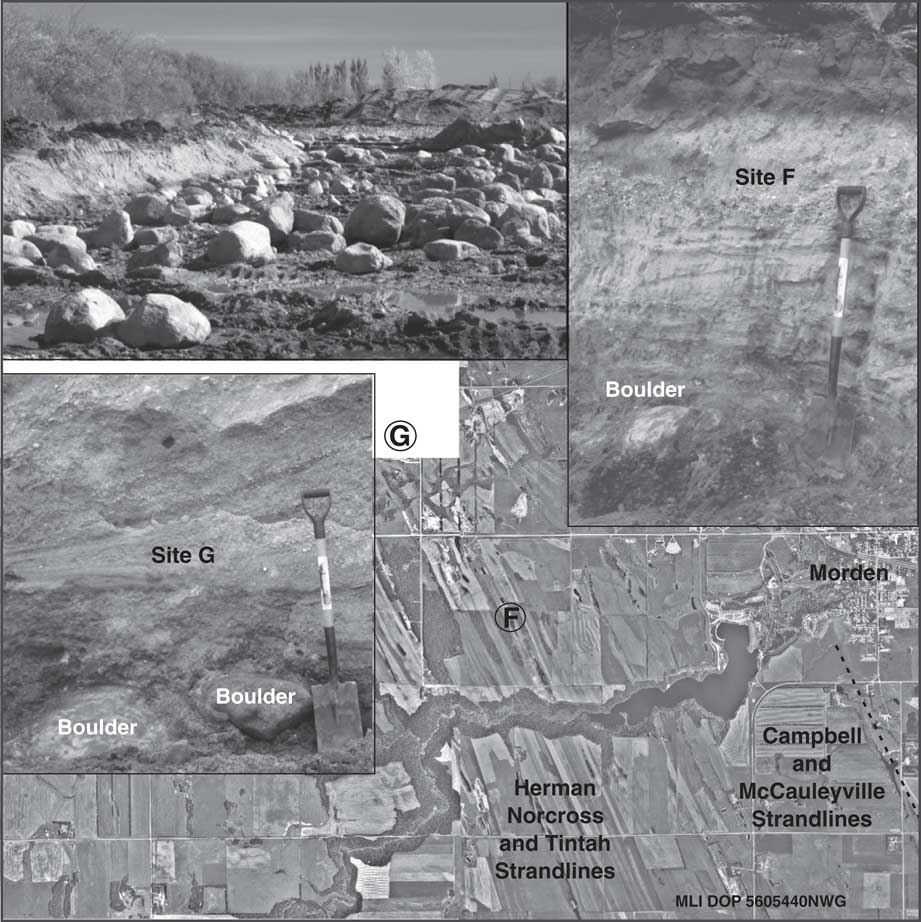
About 150 km south of Riding Mountain, in the Morden area, we sampled the oldest series of Lake Agassiz beaches that occur near the lake’s highest elevations in this part of Manitoba (Figs. 2 and 7). Upham (Reference Upham1890, Reference Upham1895), Johnston (Reference Johnston1946), Bertouille (Reference Bertouille1986), and McMillan and Teller (Reference McMillan and Teller2012) mapped these beaches, and Teller and Yang (Reference Teller and Yang2015) studied them using LIDAR (light detection and ranging) imagery. The HNT series of strandlines span <3 km in the Morden area and consist of numerous narrow ridges that rise only 1–3 m above the adjacent surface, with up to 10 ridges per kilometer (McMillan and Teller, Reference McMillan and Teller2012). We were only able to collect samples from below the uppermost (oldest) group of Herman strandlines in the HNT series. Most HNT beaches are neither distinct nor continuous landforms (Fig. 7), and mapping has not resulted in a clear (nor agreed on) distinction between the HNT groups of beaches. In contrast to the well-sorted and bedded beaches of a similar age that we sampled to the north along Riding Mountain, those in the Morden area mainly consist of moderately to poorly sorted coarse sand, gravelly sand, and bouldery sand (see the Supplementary Materials for stratigraphic section descriptions and photos of sample sites). Dating was done to provide ages on the HNT series of beaches in Manitoba and to compare them with ages on beaches to the south with which they have been correlated and to establish when this part of the Lake Agassiz basin was deglaciated.
Aerial photo of the Herman, Norcross, and Tintah beaches and the younger Campbell and McCauleyville strandlines near Morden, showing location of sample sites F and G (site G lies just outside photo coverage area). Sampled cuts and site G boulder concentrations at the beach sediment/till interface are shown; stratigraphic details are in the Supplementary Materials. Sample F taken from beach sands with an in situ soil developed in it and 40 cm above the boulder. Sample G taken from dipping backbeach sediment of Herman or Norcross beach 52 cm above boulder.
OSL AGES
Table 1 shows the OSL ages of samples in this study and related data used in their calculation; locations are shown in Figures 1 and 2, with exact locations and elevations of the samples given in Supplementary Table 2. The stratigraphy of each sample site is presented in the Supplementary Materials. Based on their geologic setting, OSL-dated samples can be grouped into four categories as described subsequently. In addition, a modern wave-washed sample from the Lake Winnipeg beach just east of the Gimli beach ridge was dated.
DISCUSSION AND INTERPRETATION OF OSL AGES
Group 1: upland channels of Riding Mountain above Lake Agassiz
The MVPT is a large abandoned meltwater channel that lies more than 200 m above the highest beaches of Lake Agassiz. The MVPT channel connects glacial Lake Proven to the ancestral Little Saskatchewan River system that once drained south into other valleys (Fig. 3) and eventually into glacial Lake Agassiz. Since entrenchment of this valley, two modern creeks (Birnie Creek and Eden Creek) have captured the runoff of McFadden Valley (Fig. 3). The elevation of the point bar surface at the inner bend of the 180° forced meander is higher than the eastern rim of the valley meander and substantially higher than the two stream valleys that have captured modern runoff. Relative ages of the now-abandoned glacial spillways on Riding Mountain have been proposed by McGinn (e.g., Reference McGinn1991, Reference McGinn2002) and McGinn et al. (2007, Reference McGinn, Wiseman and Zaniewski2009).
The morphology of the channel and surface elevation of the large point bar near site B indicate that glacial ice must have bounded the eastern side of the channel in order to confine its flow and have kept it from overflowing the crest of the Manitoba Escarpment into the Lake Agassiz basin (see Fig. 5). The presence of a thick ice dam in the Lake Agassiz basin implies that none of the Lake Agassiz beaches could have been forming in this region at that time. Thus, Riding Mountain was partially deglaciated in order for the channels to have formed, and an LIS ice dam must have been present in the adjacent Lake Agassiz basin for the main channel of MVPT to have carried meltwater without spilling over into the Agassiz basin.
Fluvial sediments from two locations on Riding Mountain related to the MVPT channel were OSL dated (Table 1): (1) 13.8±1 and 12.5±2.6 ka from a fan deposited at the mouth of the MVPT (site A, Fig. 4) and (2) 10.5±2.7 ka from a pit in the slope at the base of a mega point bar deposited in the sharp inner bend of the MVPT channel where it abruptly bends at the crest of the Manitoba Escarpment (site B, Fig. 5). This large point bar was not dated, but it must predate fluvial sediments at site B (10.5 ka) because those sediments are a separate deposit ~40 m below the surface of the mega point bar. If the LIS was present along the eastern side of the MVPT channel in order to confine early meltwater flow during initial entrenchment and deposition of the mega point bar, then the age of the point bar must be older than that of nearby beaches in the Lake Agassiz basin because beach formation requires that the basin be ice free. OSL ages of 13.8 ka and 12.5 ka on sediments in Bethany Fan at the mouth of the MVPT spillway (site A, Fig. 4) suggest that the fan was deposited during and/or after entrenchment of the spillway and after the LIS had retreated from the adjacent Lake Agassiz basin. OSL ages from a beach to the east of the escarpment (Table 1), plus the absence of the oldest Herman beaches as far north as the Riding Mountain area (Upham, Reference Upham1895; Johnston, Reference Johnston1931, Reference Johnston1946), support the conclusion that the Lake Agassiz basin was not ice free in this area until after ~14 ka.
Group 2: the oldest beaches east of the Manitoba Escarpment
Three samples (C1, C2, and D; Figs. 1 and 6) were collected just east of Riding Mountain from a small beach ridge identified by Johnston (Reference Johnston1931, Reference Johnston1946) as belonging to the Norcross series. Upham (Reference Upham1895) and Johnston (Reference Johnston1931, Reference Johnston1946) did not identify beaches of the older Herman series this far north (i.e., north of the Assiniboine delta). OSL ages on our samples there are 12.7±2.1, 13.9±1.6, and 12.1±0.8 (Table 1). The average of these three ages is 12.9 ka, which is in the range assigned to the next lower series of beaches, the Tintah group, and similar to the age assigned to the lowest beach in the HNT series by other researchers (e.g., Fisher et al., Reference Fisher, Yansa, Lowell, Lepper, Hajdas and Ashworth2008; Teller, Reference Teller2013).
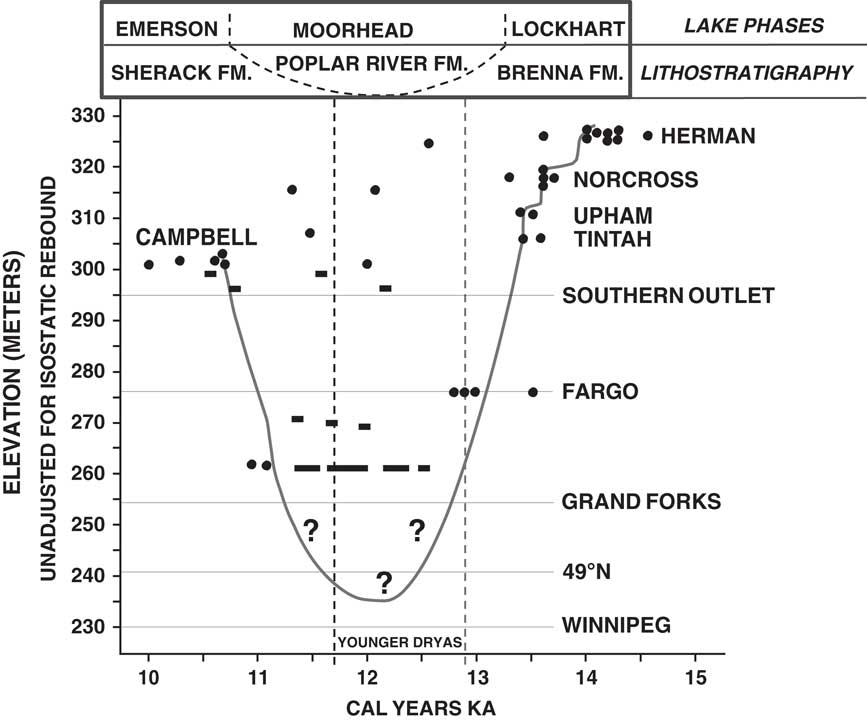
Although researchers state that there is some difficulty in directly correlating the HNT beaches in the southern Lake Agassiz basin with those in the northern areas because of lack of continuity (e.g., Upham, Reference Upham1895; Leverett, Reference Leverett1932; Fenton et al., Reference Fenton, Moran, Teller and Clayton1983; Fisher, Reference Fisher2005; Teller and Yang, Reference Teller and Yang2015), our OSL ages on Herman to Norcross beaches in the Morden area (Fig. 7) of 14.5±2.4 ka and 13.4±0.7 ka are in the range of OSL ages from transects across those beaches in the southern end of the Agassiz basin near and 100 km to the south of Fargo, North Dakota (Fig. 8; Lepper et al., Reference Lepper, Gorz, Fisher and Lowell2011, Reference Lepper, Buell, Fisher and Lowell2013), supporting previous geomorphic correlations (Upham, Reference Upham1895; Johnston, Reference Johnston1946). Our sample sites are 2.2 km apart and belong either to the Herman or Norcross series of beaches depending on whose interpretation is accepted (see McMillan, Reference McMillan2006, figs. 4–7; Bertouille, Reference Bertouille1986, figs. 40 and 41). Large-scale mapping by Upham (Reference Upham1895) does not provide a clear indication as to which of the HNT beaches were sampled, and they lie very near the boundary of the Herman and Norcross groups of beaches. Complicating the interpretations and correlations is the fact that many of the HNT beaches have been extensively quarried for aggregate since the nineteenth century (Upham, Reference Upham1890, Reference Upham1895), and they no longer form an elevated ridge nor are a clearly identifiable geomorphic feature. Based on Bertouille (Reference Bertouille1986, figs. 40 and 41), both our sample sites near Morden should belong to the Herman beach series, whereas McMillan’s map (2006, figs. 4–7) shows they are from the Norcross series. Two unpublished OSL ages on Herman and Norcross beaches 155 km east of Morden are 15.5±0.7 and 13.0±0.5 ka, respectively (Table 1) (Goble, R., University of Nebraska, personal communication, 2002), and these also conform to the general time for deposition of the Herman and Norcross beaches.
Curve showing the level of Lake Agassiz from 14.5 to 10 ka based on optically stimulated luminescence (OSL) ages (dots) from transects across beaches in the southern end of the Lake Agassiz basin near and ~100 km south of Fargo, North Dakota (Lepper et al., Reference Lepper, Gorz, Fisher and Lowell2011, Reference Lepper, Buell, Fisher and Lowell2013) (modified from Liu et al., Reference Liu, Fisher, Lepper and Lowell2014, fig. 9). These OSL ages are 160–270 km south of those reported from Manitoba in this article (which are not shown in this figure) and are more than 25 m lower in elevation than the same beaches in Manitoba because of differential isostatic rebound (see Fig. 2). Selected radiocarbon ages (rectangles and bars) are shown in the offshore part of the southern basin, which helped control interpretation of lake level, and are mainly from organics near Fargo (Liu et al., Reference Liu, Fisher, Lepper and Lowell2014) and west of Grand Forks (Lepper et al., Reference Lepper, Buell, Fisher and Lowell2013). Lake level curve shows the decline of Lake Agassiz during the Moorhead low-water phase when the lake floor was exposed down to elevations of the Gimli beach and possibly Winnipeg; this decline resulted from the opening of an outlet that was lower than the Southern Outlet. In this interpretation, the Tintah strandline is shown to have formed around 13.5 ka, long before the Younger Dryas (YD) began, whereas our OSL ages in Manitoba suggest the Tintah beach was deposited near the start of the YD as other research in the basin suggests (e.g., Fisher et al., Reference Fisher, Yansa, Lowell, Lepper, Hajdas and Ashworth2008, Teller, Reference Teller2013). The subsequent transgressive rise in lake level reached its maximum about 10.6 ka and resulted in deposition of the Campbell beach. Names of lake phases and corresponding offshore lithostratigraphic units noted.
Group 3: younger beaches along the eastern side of Riding Mountain
The Campbell strandline is the best-defined, largest, and most extensive strandline in the Lake Agassiz basin, extending around the southern half of the basin in Manitoba, North Dakota, and Minnesota. It lies ~50 m below the sampled beaches in the HNT series (Fig. 2). It consists of a wave-eroded escarpment (in places with a fringing sandy beach) or a large and distinct sandy to gravelly beach, which commonly is separated from the mainland by a paleolagoon; the latter is the setting for our sample site E (Fig. 6). The beach was formed along a transgressing margin of Lake Agassiz, as the level of the lake rose during the Moorhead low-water phase ~12.8 to 10.6 ka (e.g., Fisher et al., Reference Fisher, Yansa, Lowell, Lepper, Hajdas and Ashworth2008; Teller, Reference Teller2013). The Campbell strandline was abandoned at its maximum extent of transgression when the level of the lake dropped because a new and lower overflow outlet was opened. The beach has been radiocarbon dated at around 10.6 cal ka BP (e.g., Teller, Reference Teller1989; Teller et al., Reference Teller, Risberg, Matile and Zoltai2000; Fisher, Reference Fisher2007), and OSL ages in the United States are around 10.7–10.6 ka (Lepper et al., Reference Lepper, Buell, Fisher and Lowell2013).
The two ages in this group come from site E in the Campbell beach (Fig. 2) and are 11.7±1.4 and 10.1±0.7 ka. The mean of these is 10.9±1.6 ka, close to the generally accepted age of 10.6–10.7 ka assigned by others to this beach. Interestingly, OSL ages on this beach in the southern part of the Lake Agassiz basin show a considerable range (Fig. 8) and a possible bimodal distribution related to two different constructional phases (Lepper et al., Reference Lepper, Buell, Fisher and Lowell2013).
Group 4: old age of Gimli beach
Two sites in the Gimli beach ridge, located ~170 km east of the Campbell beach in the middle of the Lake Agassiz basin, gave OSL ages of 13.4±0.7 and 12.1±1 ka. This feature forms a distinct, extensive, and large ridge that extends for more than 50 km (Grant and Burt, Reference Grant and Burt2004) and lies ~80 m below the elevation of the Campbell beach to the west. Since the work of Upham (Reference Upham1895) and Johnston (Reference Johnston1946), all researchers have interpreted that this beach formed during a late stage of Lake Agassiz. It has an isostatically rebounded surface gradient that fits in that time frame (Johnston, Reference Johnston1946, fig. 2). The ridge rises 5–10 m above the lacustrine plain, and in many places, there is a low area on the western side of the ridge interpreted to be a paleolagoon. Hand augering into the lagoon area at several places did not yield typical organic-rich lagoonal sediment, and only lacustrine clay was recovered.
There are no published radiocarbon or OSL ages from the Gimli beach. Teller and Leverington (Reference Teller and Leverington2004) extrapolated its age from older and younger beach ages as ~8.7 cal yr BP. When compared with this 8.7 ka estimate, our OSL ages of 13.4±1.2 and 12.1±1.0 ka are too old by more than 3000 yr and are older than the Campbell beach dated at ~10.6 ka, which others have interpreted as having been deposited before the Gimli beach. This would suggest that the Gimli beach was deposited during the Moorhead low-water stage, before the higher-elevation Campbell beach was deposited at ~10.6 ka. In fact, Fenton et al. (Reference Fenton, Moran, Teller and Clayton1983, p. 71) state that “certainly some of the beaches below the Campbell level were formed prior to … the Moorhead low-water phase.” We conclude that the Gimli ridge is either an old beach that survived subsequent transgressions and regressions of the lake during and after the Moorhead low-water phase or a relict of an older glaciofluvial landform such as the nearby Belair-Milner Ridge-Sandilands moraine (Burt et al., Reference Burt, Brennand, Matile, Keller and Thorleifson2002; Burt, Reference Burt2004a, Reference Burt2004b), whose northern end lies only 30 km to the southeast.
Age of the modern Lake Winnipeg beach
An OSL age of 0.7 ka comes from a sample of the modern beach of Lake Winnipeg, located 14 km from the location of the OSL-dated samples in the Gimli ridge. The sample was collected a few centimeters from the surface of the beach in the zone actively being washed by waves; there were no nearby eroding cliffs of sand nor rivers that were actively delivering sand to the shoreline. The calculated age of 700 yr for the modern beach may reflect the extent of an inherited OSL signal.
DISCUSSION AND HISTORY OF DEGLACIATION
OSL ages from the beaches of Lake Agassiz in Manitoba and from glaciofluvial deposits on the adjacent Riding Mountain upland to the west provide the ages for events related to Lake Agassiz in the region. No previous OSL ages have come from this area. Also, no radiocarbon ages from any of the features studied have so far been reported. Integration of geomorphic analysis of the upland area of Riding Mountain with new ages from this study provides a better understanding of the chronology of deglaciation in the region and of the early history of Lake Agassiz in Manitoba. This includes a substantial revision in the age of the Gimli beach ridge.
Riding Mountain and the early stages of deglaciation
During the late stages of regional deglaciation, flow of the LIS diverged around Riding and Duck Mountains, and ice on the uplands eventually stagnated, as indicated by thick accumulations of hummocky drift (Klassen, Reference Klassen1966, Reference Klassen1979) (Fig. 9). In places, active ice was thrust up onto these upland “islands,” and this also became stagnant (McGinn, Reference McGinn1991, Reference McGinn1997). Meltwater ponded over the stagnant ice on Riding Mountain, creating small supraglacial lakes, and later an integrated network of ice-walled lakes and drainage channels formed (McGinn, Reference McGinn1991). McGinn (Reference McGinn1991) established that the supraglacial lakes drained eastward over stagnant ice into the McFadden Valley–Polonia Trench (MVPT) and deposited a large subaqueous fan (Bethany Fan) at its southern end (Fig. 3).
Glaciation in southwestern Manitoba during retreat of Laurentide Ice Sheet before 13.4 ka, showing ice flow around Riding Mountain and development of lakes and the meltwater channel system on Riding Mountain that overflowed into the Little Saskatchewan River spillway to the Pembina spillway and Lake Agassiz in North Dakota (after Klassen, Reference Klassen1975; Sun and Teller, Reference Sun and Teller1997). Subsequent ice retreat allowed Lake Agassiz and Lake Hind to expand and meltwater to enter the Assiniboine River to the north (see Fig. 10).
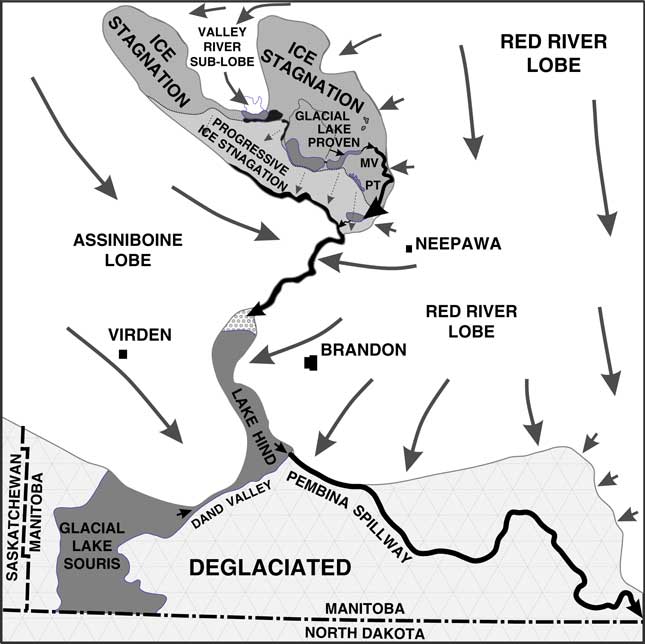
The history of this early postglacial phase of Riding Mountain is complex as described by Klassen (Reference Klassen1966, Reference Klassen1979), McGinn (Reference McGinn1991, Reference McGinn1997, Reference McGinn2002), and McGinn et al. (2007, Reference McGinn, Wiseman and Zaniewski2009). Outwash sediments accumulated in the newly eroded MVPT, and a large point bar was deposited in a 180° meander bend (Fig. 5) that abutted against the LIS, which still occupied the Agassiz basin to the east (Fig. 9). Regional studies show that this region was not deglaciated until after about 14 ka, and the oldest radiocarbon ages from outwash in the Assiniboine River system that lies just south and west of Riding Mountain (Fig. 1) are younger than 13 cal ka BP (e.g., Dyke and Prest, Reference Dyke and Prest1987; Klassen, Reference Klassen1989), although there is limited chronological control on the details of this phase. Initially, meltwater from the Riding Mountain upland flowed south into proto–glacial Lake Hind that overflowed into the Pembina River valley, entering Lake Agassiz just south of the Canada-U.S. border (Fig. 9).
Subsequently, the MVPT spillway on Riding Mountain was entrenched, and meltwater flow fell below the level of the escarpment divide along the eastern side of the channel (Fig. 3). This entrenchment must have occurred before the LIS retreated from the Agassiz basin because that ice provided the needed barrier that confined preentrenchment flow in the MVPT channel. OSL ages on the Bethany Fan at the mouth of the MVPT channel (Figs. 3 and 4) suggest that it was deposited after 14 ka, perhaps about the time the LIS disappeared from the nearby Lake Agassiz basin, based on OSL ages on Lake Agassiz beaches to the east. Eventually, after entrenchment, the eastern wall of the MVPT valley was breached by headward-eroding channels along the escarpment, capturing flow in that channel (Fig. 5).
The HNT beaches of Lake Agassiz
OSL ages of the HNT beaches in Manitoba reflect some of the earliest stages of Lake Agassiz history and span several thousand years. Figure 10A shows a reconstruction of the lake during the Norcross phase. We did not sample the uppermost Herman beach in the Morden area. The Herman beaches were not sampled in the Riding Mountain area because they are not present north of the Assiniboine delta based on the mapping of Upham (Reference Upham1895) and Johnston (Reference Johnston1931, Reference Johnston1946). The absence of the Herman strandlines in the Riding Mountain region suggests that deglaciation occurred later in that area than it did to the south (Upham, Reference Upham1890, p. 61).
Schematic maps showing extent of Lake Agassiz (dark grey) in southwestern Manitoba at three lake phases (in part after Teller et al., Reference Teller, Thorleifson, Dredge, Hobbs and Schreiner1983; Teller and Leverington, Reference Teller and Leverington2004, fig. 4): (A) Norcross beach phase around the time when residual ice around Brandon (site B) stopped blocking Assiniboine River flow to the Assiniboine delta; (B) Gimli beach phase (note location of Gimli beach site G); (C) Campbell beach phase about 10.6 ka. See Figure 1 for named features abbreviated here as letters. Stagnant ice on Riding Mountain shown in light grey in panel A. Dated sample sites shown. Box in panel A shows area of Figure 9. Note that the Laurentide Ice Sheet had retreated from this area by the early part of the Moorhead low-water phase.
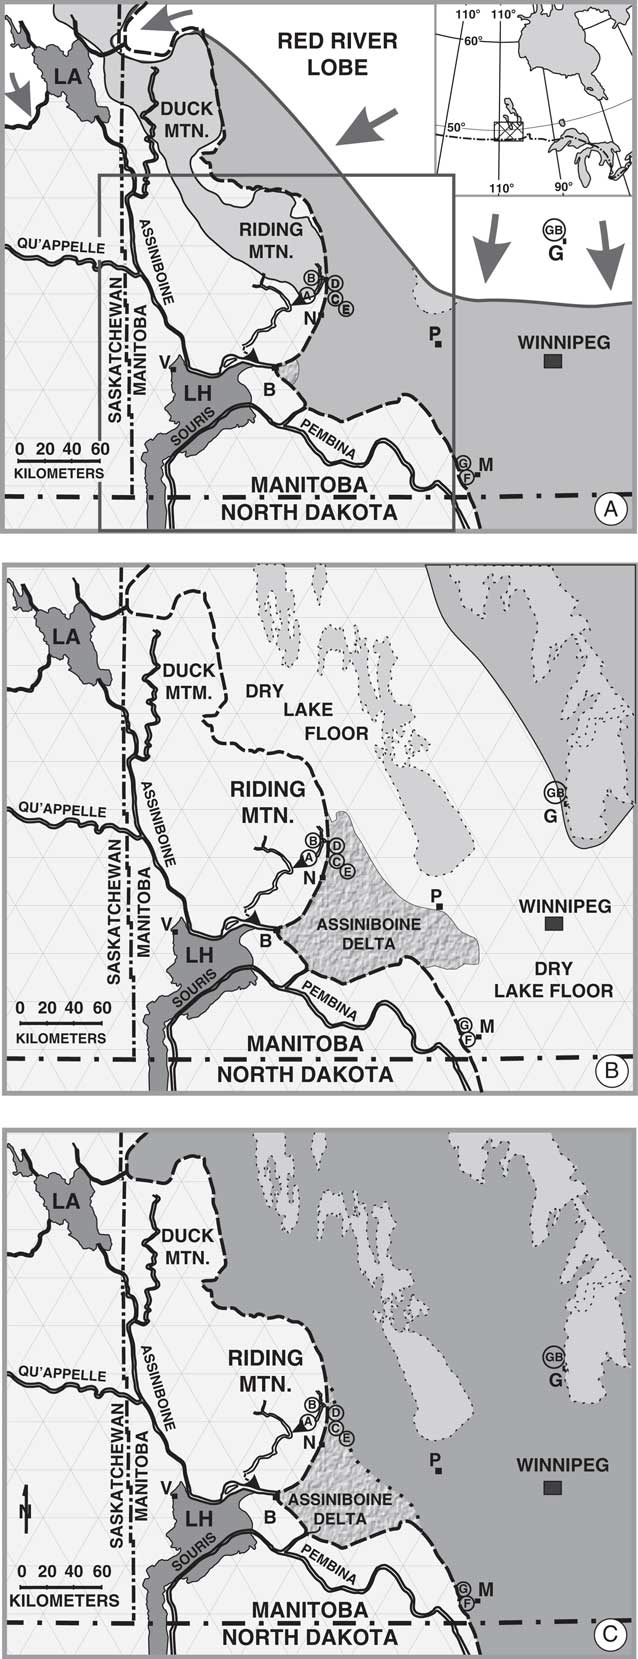
Initially, runoff from Riding Mountain and the west entered the Lake Hind basin and overflowed to Lake Agassiz through the Pembina River valley (Figs. 9 and 10A). Probably during the late Herman phase, the Assiniboine River valley breached the LIS near Brandon (“B” in Fig. 10A) and began to carry much of this meltwater, constructing the Assiniboine delta. New radiocarbon dates on the drainage of glacial Lake Hind to the west indicate that the eastern end of the Assiniboine spillway was deglaciated around 13 cal ka BP, and sediments in that basin show that a large flood of meltwater immediately preceded that (Teller et al., Reference Teller, LeCompte, Kennett, Telka, Diaz, Boyd, West, Garcia, Batchelor and Mooney2015). Thus, overflow from Riding Mountain probably shifted to that spillway from the Pembina spillway around that time (Fig. 10A).
The average age of our three OSL ages on a beach identified by Johnston (Reference Johnston1946) as a Norcross beach, just east of Riding Mountain, indicates that it formed around 12.9 ka. This age accords with the 13–12.8 ka age assigned to the next younger beach (the Tintah) (for discussion of Tintah age, see Fisher et al., Reference Fisher, Yansa, Lowell, Lepper, Hajdas and Ashworth2008; McMillan and Teller, Reference McMillan and Teller2012; Yang and Teller, Reference Yang and Teller2012; Lepper et al., Reference Lepper, Buell, Fisher and Lowell2013; Teller, Reference Teller2013; Breckenridge, Reference Breckenridge2015) and immediately precedes the start of the Younger Dryas. This would suggest that the correlation of named beaches from the Morden area to the Riding Mountain area may be incorrect, and this conclusion is supported by the age of 13.3–13.6 ka for the Norcross strandline in the southern end of the Lake Agassiz basin (Fig. 8; Lepper et al., Reference Lepper, Buell, Fisher and Lowell2013).
To the south near Morden, Manitoba, OSL ages on beaches near the boundary of the Herman and Norcross groups are 14.5 ± 2.4 and 13.4 ± 0.7 ka (Table 1), similar to OSL ages in North Dakota and Minnesota measured by Lepper et al. (Reference Lepper, Gorz, Fisher and Lowell2011, Reference Lepper, Buell, Fisher and Lowell2013) (Fig. 8). Their poor sorting led McMillan and Teller (Reference McMillan and Teller2012) to interpret HNT shoreline sediments in the Morden area to be related to storms. This interpretation is supported by Upham’s (Reference Upham1890, p. 68) observation that west of Morden there is “an extraordinary abundance of boulders” on the surface in between the HNT beaches that have since been removed to allow farming. In addition, to the north, Upham (Reference Upham1890, Reference Upham1895) noted that there were “plentiful boulders” between and on the HNT beaches along Riding and Duck Mountains, although these are no longer present today. Our observations suggest that this concentration of boulders still remains below the HNT beaches in some places, such as at our two Morden area sample sites that extend through the beach sequence (Fig. 7 and sites F and G in the Supplementary Materials). At those sites, beach gravel overlies a boulder bed, which, in turn, overlies a till. There are piles of large boulders in the pit at site F, some with diameters of up to 2.3 m and many that are 0.5–1.0 m in diameter, derived from the contact between the gravel and till (see Fig. 7). In the pit at site G, these boulder piles consisted mainly of Precambrian crystalline boulders 1–2 m in diameter.
The Gimli and Campbell stages of Lake Agassiz
The Gimli ridge lies ~80 m below the level of the Campbell beach that is dated at ~10.6±ka, and previous interpretations have assigned an age to the lake at the time the Gimli beach was formed that is more than 1500 yr younger than the 10.6 ka age of the Campbell beach (e.g., Elson Reference Elson1967; Teller and Last, 1981; Fenton et al., Reference Fenton, Moran, Teller and Clayton1983). Teller and Leverington (Reference Teller and Leverington2004) estimated the age of the Gimli beach to be ~8.7 ka. Our OSL ages on the Gimli beach ridge are 13.4±0.7 and 12.1±1 ka, far older than the age interpreted by others. We conclude that this ridge was deposited during the Moorhead low-water stage, dated to 12.8–10.6 ka (e.g., Fisher et al., Reference Fisher, Yansa, Lowell, Lepper, Hajdas and Ashworth2008; Teller, Reference Teller2013), when waters of Lake Agassiz fell by at least 80 m to the level of this ridge (see Figs. 2, 8, and 10B). Few have attempted to map the extent of the lake during this interval (see maps K to P for reconstructions in Teller and Leverington Reference Teller and Leverington2004, fig. 4, data repository), and shorelines have not been identified.
Fluctuating lake level during the Moorhead low-water phase may have allowed sediment to accumulate on the Gimli ridge over a long period, accounting for the two differing OSL ages at the two sites sampled. It is surprising, however, that that the Gimli ridge survived complete wave erosion as the lake deepened at the end of the Moorhead phase, and again when the lake level declined, although others have reported the drowning and preservation of beach landforms when water levels changed rapidly (e.g., Rampino and Sanders, Reference Rampino and Sanders1980). Relict beach ridges truncated by subsequent rising Lake Agassiz waters at the end of the Moorhead low-water phase have been identified in a few places in southeastern Manitoba (Matile, G., personal communication, 2017) and in North Dakota (Fisher et al., Reference Fisher, Yansa, Lowell, Lepper, Hajdas and Ashworth2008), and Fenton et al. (Reference Fenton, Moran, Teller and Clayton1983) note that some beaches that lie below the Campbell level were formed before the Campbell beach and survived subsequent events.
Following the Moorhead low-water phase of Lake Agassiz, waters transgressed to the Campbell beach (Figs. 2 and 8), which is a distinct and widespread feature in the Lake Agassiz basin (Fig. 10C). In Manitoba, this beach has been radiocarbon dated at ~10.6 cal ka (e.g., Teller et al., Reference Teller, Risberg, Matile and Zoltai2000). Our OSL age on this ridge is 10.9±1.6 ka, and ages across the region span several centuries (see Fig. 8). The Campbell beach reflects the limit of transgression of rising waters at the end of the Moorhead phase. The level of the lake then dropped again when a new and lower overflow outlet was opened, and the Campbell strandline was abandoned.
SUMMARY AND CONCLUSIONS
New OSL ages on several Lake Agassiz beaches in Manitoba and in fluvial deposits in the adjacent Riding Mountain uplands to the west provide insight into the early deglacial history of the region and the history of Lake Agassiz. The chronology of events in the region, based on new OSL ages and geomorphic relationships, is as follows.
The LIS stagnated over the upland areas west of the Lake Agassiz basin, and meltwater channels developed on the newly deglaciated surface, including the large MVPT on the Riding Mountain upland (Fig. 9). The LIS remained in the Lake Agassiz basin to the east of Riding Mountain until after ~14 ka, providing a boundary to this channel until it was entrenched and fluvial sediment was deposited in it and in the Bethany Fan at its terminus, which has an OSL age range of 13.8–12.5 ka.
To the south of Riding Mountain, retreating ice in the Lake Agassiz basin allowed the oldest (HNT) series of beaches to start being deposited by 14.5 ka. In the Morden area, beaches have OSL ages of 14.5 and 13.4 ka, which accord with OSL ages on the Herman and Norcross beaches to the south in North Dakota and Minnesota (see Fig. 8).
Geomorphic evidence and OSL ages in the Riding Mountain area indicate that the LIS did not retreat from that area until after 14.5 ka. Correlation of strandlines in the Lake Agassiz basin by Johnston (Reference Johnston1946) shows beaches along and to the north of Riding Mountain are Norcross or younger in age, meaning they would have been deposited after 14 ka, similar to the time interpreted from Norcross beaches in the southernmost part of the basin (Lepper et al., Reference Lepper, Buell, Fisher and Lowell2013; see Fig. 8). Our mean OSL age of 12.9 ka on a beach to the east of Riding Mountain that Johnston (Reference Johnston1946, fig. 2), correlated by geomorphology to the youngest Norcross beach, suggests that this beach may belong to the Tintah group, generally considered to have been deposited 13–12.8 ka. That would mean that this beach was deposited near the start of the Younger Dryas, just before the lake abruptly dropped to the Moorhead low-water level.
The average of two OSL ages from the Campbell beach is 10.9±1.6 ka, close to the established age of this beach based on radiocarbon and OSL ages of 10.6–10.7 ka in the Lake Agassiz basin (Fig. 8).
The lower elevation Gimli beach in the central part of the Agassiz basin has OSL ages of 13.4 and 11.9 ka, which do not fit with previous interpretations that assigned a much younger age of ~8.7 ka to this beach. These OSL ages are even older than those assigned to the Campbell beach, which lies ~80 m above the Gimli beach. We interpret this to mean that the Gimli beach is a relict strandline formed during the Moorhead low-water phase 12.8–10.6 ka and before the Campbell beach, which escaped complete erosion as the level of Lake Agassiz transgressed and regressed over it.
ACKNOWLEDGMENTS
Funding support came from a Discovery Grant to JTT from the Natural Sciences and Engineering Research Council of Canada. AKS thanks the Indian Departments of Science and Technology and Department of Atomic Energy for J.C. Bose and Raja Ramanna fellowships and research grants. We thank Ron Goble, Department of Earth and Atmospheric Sciences, University of Nebraska, for sharing the two unpublished OSL ages on Lake Agassiz beaches. Ms. Nikita Parmar helped with the initial luminescence measurements. We also thank Editor N. Lancaster, and two anonymous referees for their constructive comments.
SUPPLEMENTARY MATERIAL
To view supplementary material for this article, please visit https://doi.org/10.1017/qua.2017.107



