We were invited to contribute to the question: What advances in intelligence research should we expect in the 21st century? The question will be approached from three viewpoints: (1) discussing research into the neurobiological underpinning of g – even though all invited papers focus on g, particularly those by Santarnecchi and Chuderski (both in this volume) in which the brain-intelligence relation is tackled, we think that the diversity of research perspectives makes it necessary to clarify our standpoint, (2) raising the question: can we refine the construct of g by influencing or increasing intelligence, and (3) providing an example in which combining a correlational approach with an experimental intervention can provide a provisional positive answer to the latter question.
The biological background of intelligence
The neurobiological underpinnings of intelligence have attracted cognitive neuroscientists for decades. At first glance a mission impossible to attempt. On the one hand, we are dealing with a construct – g, without knowing its exact meaning or, in the best case, we are trying to mark its limits (Deary, Reference Deary2000). On the other hand, our brain is regarded as the most complex system we know off (Nunez, Reference Nunez and Nunez1995). Understanding the relationship between intelligence and the brain requires a lot of reductionism thereby allowing for speculation and scientific controversy.
On the construct level, test scores have been used to signify intelligence, which in our opinion comes close to the often repeated definition proposed by Boring (1923; p. 35): “Intelligence as the tests test it”. This statement actually represents the purest illustration of psychometric intelligence as provided by Spearman’s g factor. G is an empirical outcome of factor analysis derived from the first unrotated principal component that can account for a large proportion of variance in individuals’ mental test scores (Spearman, Reference Spearman1927). From the neurobiological perspective, different structural (e.g., brain volume, brain surface, thickness, convolution, callosal shape and more recently white matter integrity – fractional anisotropy) and functional (e.g., neuro-electric measures such as event related potentials –ERPs, or hemodynamic measures like the blood oxygenation level dependent – BOLD response) characteristics have been correlated with g.
To give just two examples: Colom, Jung, and Haier (Reference Colom, Jung and Haier2006) used hierarchical factor analysis to the Wechsler Adult Intelligence Scale (WAIS), showing that the subtests block design and vocabulary had the highest g-loadings. In a second step they correlated test scores with voxel-based morphometry data (gray matter intensities for each voxel) obtained from 48 subjects. Based on the results they concluded (Colom et al., Reference Colom, Jung and Haier2006; p. 1359): “[…] it is shown that two prototypical measures of verbal and nonverbal g (i.e., vocabulary and block design) correlate with the amount of regional gray matter across frontal, parietal, temporal, and occipital lobes, suggesting that the general factor of intelligence relates to areas distributed across the brain as opposed to the view that g derives exclusively from the frontal lobes”.
The opposing viewpoint that Colom and colleagues referred to was proposed by Duncan and Owen (Reference Duncan and Owen2000). Despite the fact that the main idea in both studies was the same, namely to compare high-g tasks with low-g tasks in relation to brain structure or function, conflicting conclusions were derived. The Duncan study used Positron Emission Tomography (PET) while 13 respondents solved high/low-g tasks with verbal and spatial content. For spatial content, regions of significantly greater blood flow in high-g tasks compared to low-g tasks occurred in the lateral prefrontal cortex, and in a discrete region of the medial frontal gyrus. For verbal content, the only significant difference was visible in the lateral frontal cortex of the left hemisphere, corresponding to the activation observed for the spatial tasks. The conclusion put forward was (Duncan & Owen, Reference Duncan and Owen2000; p. 458): “Such results argue strongly against the possibility that high-g tasks are associated with diffuse neural recruitment, as predicted by broad sampling of the brain’s major cognitive functions”.
Even though the conclusions put forward in the two exemplary studies differ, the approach they used was the same, namely trying to find evidence in brain structure or function that would correspond to the construct of intelligence, which we call the construct perspective. There are few studies that have investigated an opposite approach, to look how the brain is functioning and to see if this corresponds to the construct of intelligence – the brain perspective.
The most far reaching attempt in the so-called brain perspective is the study by Hampshire, Highfield, Parkin, and Owen (2012; Hampshire & Owen, Reference Hampshire and Owen2014). The authors compared factor models of brain functional organization with factor models of individual differences in performance. Sixteen individuals solved 12 cognitive tasks while they were in a MRI scanner. The activation levels of each voxel relative to the resting state were calculated for each task and used as an input for exploratory factor analysis. The activation patterns resulted in two principal components in the multiple-demand cortex (MD Footnote 1 ): a working memory component (MDwm) and a reasoning component (MDr). The working memory component was associated with a functional network comprised of the insula/frontal operculum, the superior frontal sulcus, and the ventral portion of the anterior cingulate cortex. The reasoning component was activated for tasks that required transformation of information according to logical rules and was associated with the inferior frontal sulcus, the inferior parietal cortex, and the dorsal portion of the anterior cingulate cortex. Factor analysis of behavioral data resulted in 3 factors, two of which corresponded to the components extracted based on brain activity, whereas the third component included tasks that used verbal information. The authors conducted an additional analysis in order to identify areas outside the MD cortex that corresponded to the verbal component. The results showed that the verbal component was associated with significant activations in a left lateralized network, including the the left inferior frontal gyrus and the bilateral temporal lobes. The interpretation of these findings was that intelligence is not unitary but is comprised of multiple cognitive components (Hampshire & Owen, Reference Hampshire and Owen2014). This would imply that there is no g, at least when we compare data based on brain function with behavioral data. However, an approach that would entirely rely on the “brain” is at the moment regarded as not viable (Hampshire & Owen, Reference Hampshire and Owen2014; p. 17): “[…] no neuroimaging method can accurately measure the capacity of a functional brain network; consequently, that approach for estimating ‘g’ is entirely intractable”.
To our knowledge the only definition of intelligence that completely relied on the central nervous system was suggested by Jensen (2011; p. 173): “Intelligence is the periodicity of neural oscillation in the action potentials of the brain and central nervous system.” The explanation provided by Jensen was that action potentials are the building blocks of all our thoughts, thus also of intelligence. Their periodical fluctuation is a response to incoming stimuli. A simplified example could be the change from alpha waves (8–12 Hz) in an eyes-closed condition to fast oscillations like beta waves (20 Hz <) when the eyes are opened. This idea we will be discussed in more detail in the last part of the paper.
Brain structure
The main findings obtained from research on the relationship between brain structure and intelligence can be summarized as follows: The best neuro-anatomical predictor of intelligence is total brain volume, explaining 9 to 16% of variance (Pietschnig, Penke, Wicherts, Zeiler, & Voracek, Reference Pietschnig, Penke, Wicherts, Zeiler and Voracek2015; Rushton & Ankney, Reference Rushton and Ankney2009; Vernon, Wickett, Bazana, & Stelmack, Reference Vernon, Wickett, Bazana, Stelmack and Sternberg2000). In a recent a large scale study (n = 672), structural equation modeling was used to relate 6 different brain variables, among which were brain volume, cortical thickness and different measures of white matter structure, to fluid intelligence and to g (Ritchie et al., Reference Ritchie, Booth, Valdés Hernández, Corley, Muñoz Maniega, Gow and Deary2015). Brain volume accounted for the largest portion of variance in intelligence (∼12%), followed by cortical thickness (∼5%). The authors explained these results by suggesting that larger brains contain more neurons therefore have greater computational power and in that way allow more complex cognitive processing (Ritchie et al., Reference Ritchie, Booth, Valdés Hernández, Corley, Muñoz Maniega, Gow and Deary2015).
A similar robust relation was also observed for white matter integrity. We examined 9 studies (n = 2537; age range approximately 8 – 80 years) in which white matter integrity was indexed with fractional anisotropy (FA). These studies consistently observed a positive correlation between FA magnitude and intelligence (Chiang et al., Reference Chiang, Barysheva, Shattuck, Lee, Madsen, Avedissian and Thompson2009; Reference Chiang, McMahon, de Zubicaray, Martin, Hickie, Toga and Thompson2011; Clayden et al., Reference Clayden, Jentschke, Munoz, Cooper, Chadwick, Banks and Vargha-Khadem2012; Dunst, Benedek, Koschutnig, Jauk, & Neubauer, Reference Dunst, Benedek, Koschutnig, Jauk and Neubauer2014; Haász et al., Reference Haász, Westlye, Fjær, Espeseth, Lundervold and Lundervold2013; Li et al., Reference Li, Yu, Li, Liu, Liu, Shu and Jiang2009; Navas-Sánchez et al., Reference Navas-Sánchez, Alemán-Gómez, Sánchez-Gonzalez, Guzmán-De-Villoria, Franco, Robles and Desco2014; Ritchie et al., Reference Ritchie, Booth, Valdés Hernández, Corley, Muñoz Maniega, Gow and Deary2015; Tamnes et al., Reference Tamnes, Østby, Walhovd, Westlye, Due-Tønnessen and Fjell2010). Given the considerable sample size, the correlations were as robust as those observed for brain volume. To some extent this might be explained by the fact that white matter volume is strongly associated with whole brain volume (e.g., Clayden et al., Reference Clayden, Jentschke, Munoz, Cooper, Chadwick, Banks and Vargha-Khadem2012). It was further suggested that the positive correlation between FA and IQ supports the idea that efficient information transfer between hemispheres and brain areas is essential for higher intellectual capabilities (Navas-Sánchez et al., Reference Navas-Sánchez, Alemán-Gómez, Sánchez-Gonzalez, Guzmán-De-Villoria, Franco, Robles and Desco2014). This notion is in line with recent trends in cognitive neuroscience describing brain structure and function as a dense connectome allowing for virtually unconstrained interactions among any pair of neurons in the brain, either through direct connections or via a few brain hubs (van den Heuvel & Sporns, Reference van den Heuvel and Sporns2013). An explanation that has received support also from empirical evidence (e.g., Pineda-Pardo, Martínez, Román, & Colom, Reference Pineda-Pardo, Martínez, Román and Colom2016; Santarnecchi, Tatti, Rossi, Serino, & Rossi, Reference Santarnecchi, Tatti, Rossi, Serino and Rossi2015).
Far less conclusive are correlations between measures of intelligence and other structural measures, such as brain surface and thickness (Burgaleta, Johnson, Waber, Colom, & Karama, Reference Burgaleta, Johnson, Waber, Colom and Karama2014; Karama et al., Reference Karama, Ad-Dab’bagh, Haier, Deary, Lyttelton, Lepage and Evans2009; Luders et al., Reference Luders, Narr, Bilder, Szeszko, Gurbani, Hamilton and Gaser2008; Reference Luders, Thompson, Narr, Zamanyan, Chou, Gutman and Toga2011; Luders, Narr, Thompson, & Toga, Reference Luders, Narr, Thompson and Toga2009; Narr et al., Reference Narr, Woods, Thompson, Szeszko, Robinson, Dimtcheva and Bilder2007; Ritchie et al., Reference Ritchie, Booth, Valdés Hernández, Corley, Muñoz Maniega, Gow and Deary2015; Román et al., Reference Román, Abad, Escorial, Burgaleta, Martínez, Álvarez-Linera and Colom2014; Schnack et al., Reference Schnack, van Haren, Brouwer, Evans, Durston, Boomsma and Hulshoff Pol2015; Shaw et al., Reference Shaw, Greenstein, Lerch, Clasen, Lenroot, Gogtay and Giedd2006) the size or form of the corpus callosum (Ganjavi et al., Reference Ganjavi, Lewis, Bellec, MacDonald, Waber and Evans2011; Hutchinson et al., Reference Hutchinson, Mathias, Jacobson, Ruzic, Bond and Banich2009; Luders et al., Reference Luders, Narr, Bilder, Thompson, Szeszko, Hamilton and Toga2007; Luders et al., Reference Luders, Thompson, Narr, Zamanyan, Chou, Gutman and Toga2011; Martín-Loeches, Bruner, de la Cuétara, & Colom, Reference Martín-Loeches, Bruner, de la Cuétara and Colom2013; Moreno, Concha, González-Santos, Ortiz, & Barrios, Reference Moreno, Concha, González-Santos, Ortiz and Barrios2014) and subcortical areas like basal ganglia and the thalamus (Burgaleta, MacDonald et al., Reference Burgaleta, Johnson, Waber, Colom and Karama2014; Grazioplene et al., Reference Grazioplene, Ryman, Gray, Rustichini, Jung and DeYoung2015; Rhein et al., Reference Rhein, Mühle, Richter-Schmidinger, Alexopoulos, Doerfler and Kornhuber2014; Sandman et al., Reference Sandman, Head, Muftuler, Su, Buss and Davis2014). Yet another interesting finding is that brain volume (e.g., Brouwer et al., Reference Brouwer, Hedman, van Haren, Schnack, Brans, Smit and Hulshoff Pol2014; Hedman, van Haren, Schnack, Kahn, & Hulshoff Pol, Reference Hedman, van Haren, Schnack, Kahn and Hulshoff Pol2012), cortical thickness (e.g., Burgaleta, Johnson et al., Reference Burgaleta, Johnson, Waber, Colom and Karama2014; Schnack et al., Reference Schnack, van Haren, Brouwer, Evans, Durston, Boomsma and Hulshoff Pol2015; Shaw et al., Reference Shaw, Greenstein, Lerch, Clasen, Lenroot, Gogtay and Giedd2006), and callosal size (Burgaleta, MacDonald et al., Reference Burgaleta, Johnson, Waber, Colom and Karama2014) undergo considerable developmental changes, which is related to the fact that these structural measures often correlate negatively with IQ in childhood and positively in young adulthood. This lead the authors conclude that intelligence is more related to the magnitude and timing of changes in brain structure than to brain structure by itself (e.g., Schnack et al., Reference Schnack, van Haren, Brouwer, Evans, Durston, Boomsma and Hulshoff Pol2015).
Brain function and theory building
As stressed by Deary (Reference Deary2012), the reductionism from g to the brain was not straightforward, but usually an interim cognitive level, using constructs like working memory and processing speed, or ad-hoc created ones, such as visuospatial processing (Colom et al., Reference Colom, Burgaleta, Román, Karama, Álvarez-Linera, Abad and Haier2013) or strategy refinement (Hayes, Petrov, & Sederberg, Reference Hayes, Petrov and Sederberg2015) were introduced, providing explanations for the relation between g and activated brain areas observed in neuroimaging studies.
The three most influential neurobiological theories of intelligence: the neural efficiency hypothesis (Haier et al., Reference Haier, Siegel, Neuchterlein, Hazlett, Wu, Paek and Buchsbaum1988), the parieto-frontal integration theory – P-FIT (Jung & Haier, Reference Jung and Haier2007), and the multiple-demand (MD) system theory (Duncan et al., Reference Duncan, Seitz, Kolodny, Bor, Herzog, Ahmed and Emslie2000; Duncan, Reference Duncan2010; Reference Duncan2013), are based on data obtained from hemodynamic brain imaging techniques like positron emission tomography (PET) and functional magnetic resonance imaging (fMRI). The contribution of studies based on electrophysiological data has been substantial for the neural efficiency theory and to some extent for the P-FIT theory, but was less often reported with respect to the MD theory. The latter is somewhat surprising given that Duncan (Reference Duncan, Duncan, McLeod and Phillips2005; Reference Duncan2013) sees intelligent behavior as a structured analysis of attentional episodes on different levels of abstraction in rather restricted time frames.
The essence of the neural efficiency theory summarized by Haier, Siegel, Tang, Abel, and Buchsbaum, (1992, p. 415) is: “Intelligence is not a function of how hard the brain works but rather how efficiently it works. This efficiency may derive from the disuse of many brain areas irrelevant for good task performance as well as the more focused use of specific task relevant areas”. Based on a review of research pertinent to the relationship between psychometrically determined intelligence and functional characteristics of brain activation observed during cognitive task performance, it can be concluded that most of the reviewed studies have demonstrated a negative correlation between brain activity under cognitive load and intelligence (Brancucci, Reference Brancucci2012; Neubauer & Fink, Reference Neubauer and Fink2009). Some studies have shown a specific fronto-parietal topographic pattern of differences. High-ability subjects made relatively greater use of parietal regions, and less use of frontal regions (Gevins & Smith, Reference Gevins and Smith2000; Jaušovec & Jaušovec, Reference Jaušovec and Jaušovec2004). Moreover, neural efficiency seems to be corroborated mainly when participants work on tasks of low to medium difficulty or complexity and is particularly prominent in frontal brain regions (Doppelmayr, Klimesch, Hödlmoser, Sauseng, & Gruber, Reference Doppelmayr, Klimesch, Hödlmoser, Sauseng and Gruber2005; Neubauer & Fink, Reference Neubauer and Fink2009; Nussbaumer, Grabner, & Stern, Reference Nussbaumer, Grabner and Stern2015). Another moderating variable influencing neural efficiency is sex (Neubauer & Fink, Reference Neubauer and Fink2009). The inverse intelligence–activation relationship (neural efficiency) appears to be moderated by task content and sex. Males and females display the expected inverse IQ–activation relationship in the domain in which they usually perform better: females in verbal and social-emotional domains and males in the visuospatial domain (Jaušovec & Jaušovec, Reference Jaušovec and Jaušovec2008; Lipp et al., Reference Lipp, Benedek, Fink, Koschutnig, Reishofer, Bergner and Neubauer2012; Neubauer & Fink, Reference Neubauer and Fink2003; Neubauer, Fink, & Schrausser, Reference Neubauer, Fink and Schrausser2002; Neubauer, Grabner, Fink, & Neuper, Reference Neubauer, Grabner, Fink and Neuper2005).
The P-FIT (Jung & Haier, Reference Jung and Haier2007) and the MD system (Duncan, Reference Duncan, Duncan, McLeod and Phillips2005) theories build on the question: where in the brain is intelligence? These theories were developed by determining a minimal number of converging brain areas involved in intelligent thinking with neuroimaging techniques such as PET, MRI or fMRI. In the second step, knowledge about the function of identified brain areas (e.g., lesion studies, neuro-cognitive research) was used to provide the explanatory content of the theory. In an influential paper by Jung and Haier (Reference Jung and Haier2007) it was suggested that variations in a distributed network, mainly involving frontal and parietal brain areas, are responsible for individual differences in intelligence, hence the name Parieto-Frontal Integration Theory (P-FIT). P-FIT was proposed based on a review of 37 studies, 11 of which were structural and 26 were functional. In a recent meta-analysis, Basten, Hilger, and Fiebach (Reference Basten, Hilger and Fiebach2015) divided functional brain imaging studies into two approaches: task and individual differences. The former approach aims to determine the neural correlates of processing a cognitive task. The analysis is based on brain activation patterns observed for the whole group of individuals, not taking into account the individual intelligence level of respondents. Some brain areas might show increased activity due to higher cognitive demands, however, this does not necessarily mean that they are related to individual differences in intelligence. In the individual differences approach, brain scans of more and less intelligent individuals are compared while they solve a task that is assumed to be highly saturated with g. Jung and Haier’s (Reference Jung and Haier2007) review included only 10 studies based on the individual differences approach. Their description of the P-FIT model suggested that the temporal and occipital lobes are critical in early processing of sensory information. This information is then fed forward to the parietal cortex, wherein abstraction and elaboration emerge. All these processes are dependent on the fidelity of the underlying white matter necessary to facilitate swift and error-free transmission of information from posterior to frontal brain regions. The P-FIT describes rather large parts of the association cortices in the brain as relevant for individual differences in intelligence. It is therefore surprising that several attempts to validate the P-FIT failed. When different test batteries were used to derive g, this changed also the brain areas related to g (Colom et al., Reference Colom, Jung and Haier2006; Haier et al., Reference Haier, Colom, Schroeder, Condon, Tang, Eaves and Head2009).
Basten et al. (Reference Basten, Hilger and Fiebach2015) put the P-FIT theory to an empirical test by conducting a voxel-based quantitative meta-analyses of 12 structural and 16 functional human brain imaging studies. The structural analysis showed overlap with P-FIT over the frontal, temporal, and occipital brain areas, while no correlation with local amounts of grey matter in parietal areas was observed. The analysis of functional brain imaging studies found an overlap with P-FIT only for frontal and parietal brain regions but far less overlap in temporal and occipital sensory regions. Another surprising finding was that no overlap between the results of the functional and structural meta-analyses was established. As put forward by the authors (Basten et al., Reference Basten, Hilger and Fiebach2015; p. 21): “[…] the dissociation of functional versus structural brain imaging correlates of intelligence is at odds with the principle assumption of the P-FIT that functional and structural studies on neural correlates of intelligence converge to imply the same set of brain regions”. In a recent structural connectivity analysis of areas that comprise the P-FIT network, a significant correlation between network efficiency and cognitive differences was observed only for working memory capacity, but not for fluid reasoning and processing speed. The nodes showing the greatest connectivity values included the middle frontal gyrus, the superior frontal gyrus and to a lesser extent (compared to frontal areas) the precuneus, a part of the parietal superior lobule (Pineda-Pardo et al., Reference Pineda-Pardo, Martínez, Román and Colom2016).
John Duncan’s idea of a multiple-demand system (MD) that can explain Spearman’s g is based on functional neuroimaging data showing that many different tasks activate the same brain regions in the frontal cortex and to some extent in the parietal cortex (Duncan et al., Reference Duncan, Seitz, Kolodny, Bor, Herzog, Ahmed and Emslie2000; Duncan, Reference Duncan2003; Reference Duncan, Duncan, McLeod and Phillips2005; Reference Duncan2010; Reference Duncan2013; Duncan & Owen, Reference Duncan and Owen2000). Even though the theory has lately expanded the MD system from being dominated by the prefrontal cortex to include parietal areas (e.g., intraparietal sulcus), the focus and level of precision in explanation is still mainly on the prefrontal cortex (e.g., Duncan, Reference Duncan, Duncan, McLeod and Phillips2005; Reference Duncan2010; Reference Duncan2013). For Duncan the lack of cognitive specificity – even when no task whatsoever was given to respondents, the same areas were activated – is evidence that g is a reflection of frontal lobe function (Duncan, Reference Duncan, Duncan, McLeod and Phillips2005; p. 254). The frontal cortex achieves this generality because neurons of the prefrontal cortex have no specific function and therefore can respond to multiple demands by emphasizing relevant information thereby producing a representation of the outer world. A structured series of attentional episodes therefore allows the organism to brake complex problems into manageable subgoals (Duncan, Reference Duncan2013). Subgoaling is maintained in working memory, which further supports the role of the prefrontal cortex in intelligent behavior. There is a large body of evidence that g is related to working memory (for a review see Buehner, Krumm, & Pick, Reference Buehner, Krumm and Pick2005) and that working memory processes activate the prefrontal cortex (e.g., Petrides, Reference Petrides, Toga and Mazziotta2000). Variability in the efficiency to build such models could explain individual differences in intelligence.
The best consensus based on the diversity of results reported would suggest that g is predominantly determined by lateral prefrontal attentional control of structured sensory episodes in posterior brain areas, a model that is also in line with the cognitive neuroscience of working memory. Contemporary cognitive research of working memory has favored state-based models because they accommodate well to neuroscience data (D’Esposito & Postle, Reference D’Esposito and Postle2015). The most well-known among these models is Cowan’s embedded-processes model in which working memory is defined as a cognitive state that retains information accessible (Cowan et al., Reference Cowan, Elliott, Saults, Morey, Mattox, Hismjatullina and Conway2005). The analogy of a searchlight comes to mind – spotting bits of internal or external information, where the frequency of brain oscillations determines the timing at which the focus of attention is shifted. High-frequency components increase the number of bits of information processed, which may explain the relationship between g and speed of information processing, as well as the memory capacity – scope of attention relation. From a neural perspective the lateral prefrontal cortex is important for attentional control: it represents top-down influence on posterior sensory regions reactivating cortical memory traces –the memories themselves (Sreenivasan, Curtis, & D’Esposito, Reference Sreenivasan, Curtis and D’Esposito2014). The similarity with neural models of intelligence is obvious, but not unexpected given that working memory has sometimes been proposed as virtually synonymous with intelligence (e.g., Martínez et al., Reference Martínez, Burgaleta, Román, Escorial, Shih, Quiroga and Colom2011).
Elucidating g by an experimental research approach
In our opinion the importance of the study by Jaeggi, Buschkuehl, Jonides, and Perrig (Reference Jaeggi, Buschkuehl, Jonides and Perrig2008), showing that working memory training can increase performance on tests of fluid intelligence, was in the tasks they used to bring about the observed improvements. According to Morrison and Chein (Reference Morrison and Chein2011), repetition of demanding WM tasks targeting general WM mechanisms could be classified as core training. This was also highlighted by Sternberg (Reference Sternberg2008) in his comment accompanying Jaeggi’s et al. (Reference Jaeggi, Buschkuehl, Jonides and Perrig2008) study, suggesting that the recent development in cognitive-based theories of intelligence provided insight into the type of training design, i.e., working memory training, that might be appropriate for influencing intelligence. It is surprising that the studies that followed were mainly replication studies interested in providing evidence that intelligence is either malleable or cannot be changed, rather than attempting to experimentally study the construct of g (e.g., Chooi & Thompson, Reference Chooi and Thompson2012; Owen et al., Reference Owen, Hampshire, Grahn, Stenton, Dajani, Burns and Ballard2010; Redick et al., Reference Redick, Shipstead, Harrison, Hicks, Fried, Hambrick and Engle2013; Thompson et al., Reference Thompson, Waskom, Garel, Cardenas-Iniguez, Reynolds, Winter and Gabrieli2013). Some studies used test batteries for a more fine grained analysis of WM training effects (e.g., Colom et al., Reference Colom, Burgaleta, Román, Karama, Álvarez-Linera, Abad and Haier2013; Lilienthal, Tamez, Shelton, Myerson, & Hale, Reference Lilienthal, Tamez, Shelton, Myerson and Hale2013; Stephenson & Halpern, Reference Stephenson and Halpern2013; von Bastian & Oberbauer, Reference van den Heuvel and Sporns2013), others examined training effects on brain activity (e.g., Buschkuehl, Hernandez-Garcia, Jaeggi, Bernard, & Jonides, Reference Buschkuehl, Hernandez-Garcia, Jaeggi, Bernard and Jonides2014; Jaušovec & Jaušovec, Reference Jaušovec and Jaušovec2012; Jolles, Grol, van Buchem, Rombouts, & Crone, Reference Jolles, Grol, Van Buchem, Rombouts and Crone2010; McKendrick, Ayaz, Olmstead, & Parasuraman, Reference McKendrick, Ayaz, Olmstead and Parasuraman2014; Román et al., Reference Román, Lewis, Chen, Karama, Burgaleta, Martínez and Colom2015; Takeuchi et al., Reference Takeuchi, Sekiguchi, Taki, Yokoyama, Yomogida, Komuro and Kawashima2010), yet others used different training tasks beyond the n-back task used by Jaeggi (e.g., Harrison et al., Reference Harrison, Shipstead, Hicks, Hambrick, Redick and Engle2013; Schmiedek, Lövdén, & Lindenberger, Reference Schmiedek, Lövdén and Lindenberger2010; Tulbure & Siberescu, Reference Tulbure and Siberescu2013; Waris, Soveri, & Laine, Reference Waris, Soveri and Laine2015). The diversity of approaches makes generalization rather difficult, however the main point is that an experimental approach for studying g by means of training is possible. Presently a theoretical framework is missing that would provide direction for a stepwise combined analysis using correlational and experimental research approaches. Another aspect that has to be addressed is a methodological one. Training approaches are especially prone to error because of unforeseen variables that can influence the outcome of an experiment and undermine valuable findings.
For example, Colom and colleagues (2013) compared an experimental (adaptive n-back dual training program) and a passive control group on several ability tests in a pre/posttest experimental design. The two groups were equalized on the main variables studied. The participants (n = 56) were all female. They were tested on three occasions, separated by a time interval of 24 weeks (posttest fluid intelligence) and another 3 weeks (posttest cognitive tasks). It is likely that for a given female participant, the tests took place at different stages of her menstrual cycle. With respect to the female menstrual cycle, research has shown that the relative release of sexual hormones in different phases of the menstrual cycle affects cognitive responses (e.g., Amin, Epperson, Constable, & Canli, Reference Amin, Epperson, Constable and Canli2006; Berman et al., Reference Berman, Schmidt, Rubinow, Danaceau, van Horn, Esposito and Weinberger1997). High levels of estrogen and progesterone have been associated with positive affect and higher activity in the prefrontal cortex. The second problem is that the training sessions were interrupted for the Christmas break (2 weeks). One can only speculate about the effects such an interruption might have had on the training outcomes collected on the two posttests. A recent meta-analysis of 47 studies with 65 group comparisons showed that training dose, session duration, supervision, and location had a significant influence on transfer effects (Schwaighofer, Fischer, & Bühner, Reference Schwaighofer, Fischer and Bühner2015). In support for the visuospatial interpretation of the observed test score increases reported in the Colom study, Hayes and colleagues (2015) suggested another explanatory construct – strategy refinement. The description of the experimental design in the Hayes study is difficult to evaluate because of missing information. Thirty-five university students completed two short-form Raven’s matrices tests separated by one week. In the week between pre/posttests, 23 respondents were enrolled in two training sessions practicing Raven-like problems. The remaining group served as a control. During testing, the students’ eye-movements were recorded with an eye-tracker. No data on the sex of the subjects was provided, neither any equalization with respect to the studied variables, except for vision being either normal or corrected-to normal. This shortcoming may have influenced the outcomes of the study, as it was shown that mean fixation and amplitude saccade duration differ from person to person and tend to be stable across tasks (Henderson & Luke, Reference Henderson and Luke2014). The authors established that one-third of the variance of score gains could be attributed to test-taking strategy alone, as revealed by eye-fixation patterns. Because the information on respondents’ sex is missing, it can be merely speculated that if only females were involved, or if the sample consisted of males and females, the recordings were biased, first, because of the influence of the menstrual cycle on brain activity discussed above, and second, because several gender-related differences in exploratory eye movements have been established (Cazzato, Basso, Cutini, & Bisiacchi, Reference Cazzato, Basso, Cutini and Bisiacchi2010; Miyahira, Morita, Yamaguchi, Morita, & Maeda, Reference Miyahira, Morita, Yamaguchi, Morita and Maeda2000). Furthermore, an interaction between the menstrual cycle and saccadic eye movements has been reported (Wolohan, Bennett, & Crawford, Reference Wolohan, Bennett and Crawford2013). However, if the sample consisted entirely of male respondents, then the data obtained would have little explanatory value for the study by Colom et al. (Reference Colom, Burgaleta, Román, Karama, Álvarez-Linera, Abad and Haier2013), where only female respondents participated. Last but not least, the data could have been also explained in terms of enhanced brain activity in areas assumed to be related to g. Brain imaging studies showed that exploratory eye movements are related to activity in the frontal cortex (Tsunoda et al., Reference Tsunoda, Kawasaki, Matsui, Tonoya, Hagino, Suzuki and Kurachi2005). It was further found that the prefrontal cortex is central in directing attention to novel events (Daffner, Reference Daffner2000) and in Duncan’s (Reference Duncan, Duncan, McLeod and Phillips2005; Reference Duncan2010) terms g is a reflection of frontal lobe function.
Individual alpha frequency and g
The alpha rhythm dominates the EEG power spectrum recorded from the scalp during relaxed wakefulness and may tap into general central nervous system functioning, as well as the status of mental health and cognitive performance. Recent conceptions proposed that alpha oscillations represent a general mechanism for the timing of neural inhibition that are closely linked to two fundamental functions of attention (suppression and selection), which enable controlled knowledge access and semantic orientation (Klimesch, Sauseng, & Hanslmayr, Reference Klimesch, Sauseng and Hanslmayr2007; Klimesch, Reference Klimesch2012; Mazaheri & Jensen, Reference Mazaheri and Jensen2010). Scalp alpha rhythms result from sequences of inhibitory and excitatory post-synaptic potentials at the dendrites of cortical pyramidal neurons. These potentials depend mainly on the influence of near and distant cortical modules (Nunez, Wingeier, & Silberstein, Reference Nunez, Wingeier and Silberstein2001), as well as on the interactions of excitatory cortico-thalamo-cortical relay fibers and inhibitory thalamic reticular fibers (Lopes da Silva, Vos, Mooibroek, & van Rotterdam, Reference Lopes da Silva, Vos, Mooibroek and van Rotterdam1980). Alpha power supposedly reflects the number of neurons that discharge synchronously in these integrated cortico-cortical and cortico-thalamo-cortical systems (Hindriks & van Putten, Reference Hindriks and van Putten2013; Klimesch, Reference Klimesch1999). On the other hand, peak alpha frequency, or individual alpha frequency (IAF) is assumed to mainly reflect a delay in the intra-cortical circuit at alpha baseline frequency (Hindriks & van Putten, Reference Hindriks and van Putten2013). A study by Smit, Wright, Hansell, Geffen, and Martin (Reference Smit, Wright, Hansell, Geffen and Martin2006) showed that genetic influences on IAF and alpha power are largely independent. Therefore, it has been suggested that each of these measures, IAF and alpha power, may capture different neural processes. Moretti et al. (Reference Moretti, Babiloni, Binetti, Cassetta, Dal Forno, Ferreric and Rossini2004) suggested that alpha power during wakeful rest is related to the full integrity of the cholinergic systems and cortico-cortical connections more than to the integrity of white matter. Several recent studies lend support to the suggestion that IAF is related to characteristics of the white matter structure like fiber density, axonal diameter, and myelination (Jann, Koenig, Dierks, Boesch, & Federspiel, Reference Jann, Koenig, Dierks, Boesch and Federspiel2010; Jann et al., Reference Jann, Federspiel, Giezendanner, Andreotti, Kottlow, Dierks and Koenig2012; Valdés-Hernández et al., Reference Valdés-Hernández, Ojeda-González, Martínez-Montes, Lage-Castellanos, Virués-Alba, Valdés-Urrutia and Valdes-Sosa2010). IAF is hypothesized to be an index of cognitive capacity termed cognitive preparedness (Angelakis, Lubar, & Stathopoulou, Reference Angelakis, Lubar and Stathopoulou2004; Shaw, Reference Shaw2004), which refers to the brain’s capacity for higher-level cognitive functions, and is not a synonym for arousal that modulates lower-level functions.
Within groups of healthy individuals, there are substantial and highly stable between-person differences in alpha frequency and power over test-retest intervals up to several years (Kondacs & Szabó, Reference Kondacs and Szabó1999; Salinsky, Oken, & Morehead, Reference Salinsky, Oken and Morehead1991) showing remarkably high heritability and thus are likely under strong genetic control (Anokhin, Müller, Lindenberger, Heath, & Myers, Reference Anokhin, Müller, Lindenberger, Heath and Myers2006; Smit et al., Reference Smit, Wright, Hansell, Geffen and Martin2006). Even though alpha band oscillatory activity may be seen as a relatively stable individual characteristic, it undergoes developmental changes. The frequency of the alpha rhythm increases from approximately 3–5 Hz at birth until an adult value near 10 Hz at around 20 years of age (Marshall, Bar-Haim, & Fox, Reference Marshall, Bar-Haim and Fox2002), followed by an age-related decrease in adults independent of pathology (Aurlien et al., Reference Aurlien, Gjerde, Aarseth, Eldoen, Karlsen, Skeidsvoll and Gilhus2004). A similar pattern was also observed for alpha power (Chiang et al., Reference Chiang, McMahon, de Zubicaray, Martin, Hickie, Toga and Thompson2011; Gmehlin et al., Reference Gmehlin, Thomas, Weisbrod, Walther, Pfüller, Resch and Oelkers-Ax2011).
There have been mixed reports with respect to sex differences in the alpha rhythm in the healthy population (Benninger, Matthis, & Scheffner, Reference Benninger, Matthis and Scheffner1984; Cohn, Kircher, Emmerson, & Dustman, Reference Cohn, Kircher, Emmerson and Dustman1985; Gmehlin et al., Reference Gmehlin, Thomas, Weisbrod, Walther, Pfüller, Resch and Oelkers-Ax2011; Harmony, Marosi, Díaz de León, Becker, & Fernández, Reference Harmony, Marosi, Díaz de León, Becker and Fernández1990). Sex differences were mainly observed in adolescents. Girls were found to have a maturational lag in the increase of alpha frequency in EEG compared to boys, which disappeared during early adulthood (Chiang et al., Reference Chiang, McMahon, de Zubicaray, Martin, Hickie, Toga and Thompson2011; Clark et al., Reference Clark, Veltmeyer, Hamilton, Simms, Paul, Hermens and Gordon2004). The findings for sex differences in alpha power are also diverse; studies have reported no differences (Gmehlin et al., Reference Gmehlin, Thomas, Weisbrod, Walther, Pfüller, Resch and Oelkers-Ax2011; Nikulin & Brismar, Reference Nikulin and Brismar2005), higher alpha power in males than females (Clarke, Barry, McCarthy, & Selikowitz, Reference Clarke, Barry, McCarthy and Selikowitz2001; Zappasodi et al., Reference Zappasodi, Pasqualetti, Tombini, Ercolani, Pizzella, Rossini and Tecchio2006), as well as higher alpha power in females as compared to males (Aurlien et al., Reference Aurlien, Gjerde, Aarseth, Eldoen, Karlsen, Skeidsvoll and Gilhus2004; Jaušovec & Jaušovec, Reference Jaušovec and Jaušovec2010).
Individual variation in the alpha rhythm has been hypothesized to reflect individual differences in cognition and mental health. Support for this assumption comes from several studies reporting that IAF differs between healthy and clinical individuals. Reduced IAF was observed in patients with Alzheimer’s Disease (Garcés et al., Reference Garcés, Vicente, Wibral, Pineda-Pardo, López, Aurtenetxe and Fernández2013; Huang et al., Reference Huang, Wahlund, Dierks, Julin, Winblad and Jelic2000), mild cognitive impairment (Fernández et al., Reference Fernández, Hornero, Mayo, Poza, Gil-Gregorio and Ortiz2006; Garcés et al., Reference Garcés, Vicente, Wibral, Pineda-Pardo, López, Aurtenetxe and Fernández2013), demented patients (Samson-Dollfus, Delapierre, Do Marcolino, & Blondeau, Reference Samson-Dollfus, Delapierre, Do Marcolino and Blondeau1997), patients with neurogenic pain (Sarnthein, Stern, Aufenberg, Rousson, & Jeanmonod, Reference Sarnthein, Stern, Aufenberg, Rousson and Jeanmonod2005), schizophrenia (Boutros et al., Reference Boutros, Arfken, Galderisi, Warrick, Pratt and Iacono2008; Galderisi, Mucci, Volpe, & Boutros, Reference Galderisi, Mucci, Volpe and Boutros2009), and in boys diagnosed with attention-deficit/hyperactivity disorder (Lansbergen, Arns, van Dongen-Boomsma, Spronk, & Buitelaar, Reference Lansbergen, Arns, van Dongen-Boomsma, Spronk and Buitelaar2011). Furthermore, given that IAF is assumed to be related to white matter integrity and, as discussed above, different characteristics of white matter structure were found to be positively related to intelligence, a similar relation would be also expected for individual alpha frequency. However, empirical research has mostly failed to find such a relation, at least with intelligence.
Some early research conducted before 1960 reported positive correlations. Considering the technical possibilities at that time, it is questionable whether the findings can be compared to those obtained with EEG acquisition systems available today. For instance, Mundy-Castle and Nelson (Reference Mundy-Castle and Nelson1960) reported a positive correlation (r = .34) between what he called alpha frequency and IQ. The data were obtained on 94 men and 2 women in a socially isolated white community in South Africa. The average intelligence score (WAIS) was 75. Another problem reported by Mundy-Castle and Nelson was that about half of the EEG recordings were characterized with abnormal recording features. No information on EEG acquisition and the determination of alpha frequency, whether obtained in eyes closed or open conditions, was provided. Based on the figure showing an example of 2 EEG recordings and its description, the analysis was probably conducted via visual inspection of just one rater Footnote 2 and obtained in an eyes-open condition. Another problem observed in many studies is that when the analysis focuses on endophenotypic qualities of the alpha frequency, the eyes-closed approach should be employed because only this method reflects the aggregate generation of alpha (Hooper, Reference Hooper2005).
Studies performed on more sophisticated EEG acquisition systems and software provided mixed findings (Anokhin & Vogel, Reference Anokhin and Vogel1996; Grandy et al., Reference Grandy, Werkle-Bergner, Chicherio, Schmiedek, Lövdén and Lindenberger2013; Jaušovec & Jaušovec, Reference Jaušovec and Jaušovec2000; Posthuma, Neale, Boomsma, & De Geus, Reference Posthuma, Neale, Boomsma and De Geus2001). The study by Anokhin and Vogel (Reference Anokhin and Vogel1996) showed positive correlations between peak alpha frequency (eyes closed) and test scores obtained on Raven’s matrices (correlations between .20 and .36; n = 101 males). Recently, Grandy and colleagues (2013) used structural equation modelling to estimate the association between IAF and intellectual functioning. The correlation between g (Berlin Intelligence Structure test – BIS) and composed eyes open/closed IAF was .40 (n = 85). However, the correlations reported ranged between .06 and .37; the highest correlations were reported for the memory tests, followed by tests of perceptual speed, and were not significant for the reasoning part of BIS. Among the 12 correlations determined (eyes: open/close; subtests: speed, memory and reasoning; respondents: young/old) only 5 were significant at a p < .05 level. Hence none would have survived a correction for multiple comparison. On the other hand, two large scale studies conducted by Jaušovec and Jaušovec (Reference Jaušovec and Jaušovec2000) and Posthuma et al. (Reference Posthuma, Neale, Boomsma and De Geus2001) showed no significant correlations between IAF and IQ obtained with the Wechsler Adult Intelligence Scale.
More consistent relations were obtained for performance on memory and reading tests (Angelakis, Lubar, & Stathopoulou, Reference Angelakis, Lubar and Stathopoulou2004; Angelakis, Lubar, Stathopoulou et al., Reference Angelakis, Lubar and Stathopoulou2004; Clark et al., Reference Clark, Veltmeyer, Hamilton, Simms, Paul, Hermens and Gordon2004; Klimesch, Schimke, & Pfurtscheller, Reference Klimesch, Schimke and Pfurtscheller1993; Lebedev, Reference Lebedev1994). In a large scale study by Clark and colleagues (2004), it was shown that only frontal IAF was a significant predictor of reverse digit span. Specifically, a 1 Hz increase in frequency corresponded to a 0.21 increase in reverse digit span. Still another aspect worth mentioning is that the positive correlations were obtained from IAF measures based on EEG recordings either during test performance (Klimesch et al., Reference Klimesch, Schimke and Pfurtscheller1993) or immediately after performing the task (Angelakis, Lubar, & Stathopoulou, Reference Angelakis, Lubar and Stathopoulou2004; Angelakis, Lubar, Stathopoulou et al., Reference Angelakis, Lubar and Stathopoulou2004), whereas correlations with IAF based on eyes-closed conditions obtained before the task showed a mixed pattern of significance (e.g., Angelakis, Lubar, & Stathopoulou, Reference Angelakis, Lubar and Stathopoulou2004; Angelakis, Lubar, Stathopoulou et al., Reference Angelakis, Lubar and Stathopoulou2004), or showed the smallest of all correlations observed (Klimesch et al., Reference Klimesch, Schimke and Pfurtscheller1993). These findings are difficult to explain, but might point either to arousal or cognitive preparedness, or, considering the timeline of significant correlations observed, aftereffects of these processes.
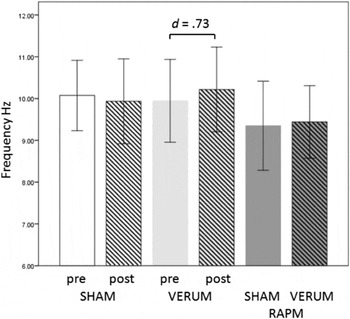
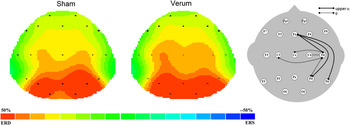
The aim of the present study was to further investigate the relationship between IAF and measures of fluid intelligence and memory storage capacity. This relation was explored using correlational (Study 1 and 2) and experimental approaches (Study 3). In the latter we attempted to increase IAF with transcranial alternating current stimulation (tACS). We then compared behavioral and neuro-electric measures between sham and verum stimulation conditions, while the participants solved the Raven’s progressive matrices test.
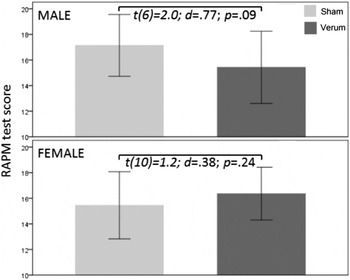
It was observed that several structural and functional characteristics of the brain which are related to intelligence are sex-specific, and that also on the behavioral level differences in test performance related to sex exist (Jaušovec & Pahor, Reference Jaušovec and Pahor2016). Therefore, a second objective was to examine the moderating role of sex in the IAF, IQ and memory relation.
STUDY 1
The objective of the first part of the study was to establish a correlation between IAF and IQ in a large dataset of individuals. We also examined whether the correlations differ in relation to brain location (anterior/posterior) and sex. The anterior-posterior direction for IAF averaging was relevant for two reasons. First, recent discoveries on the organization of the human cortical connectome have identified three main networks, two of which connect posterior brain regions with anterior brain regions: the central executive network and the default mode network (for a review see Smith et al., Reference Smith, Vidaurre, Beckmann, Glasser, Jenkinson, Miller and Van Essen2013). The default mode network is particularly important for the objective of the present study, since it shows deactivation during performance on demanding cognitive tasks and increased activation during performance on social cognitive tasks, suggesting its major involvement in autobiographical, self-monitoring and social cognitive functions. The network is anchored in the ventral medial prefrontal cortex, the dorsal medial prefrontal cortex, and the posterior cingulate cortex along with the precuneus (Bressler & Menon, Reference Bressler and Menon2010; Raichle et al., Reference Raichle, MacLeod, Snyder, Powers, Gusnard and Shulman2001; Raichle, Reference Raichle2006; Seeley et al., Reference Seeley, Menon, Schatzberg, Keller, Glover, Kenna and Greicius2007; Sridharan, Levitin, & Menon, Reference Sridharan, Levitin and Menon2008). Second, research on sex differences in resting-state brain activity showed that the most pronounced differences tend to occur in the anterior-posterior direction (Jaušovec & Jaušovec, Reference Jaušovec and Jaušovec2010).
Another aspect that might have influenced the observed inconsistency between studies reporting either positive or no correlations between IAF and measures of intelligence could be the type of intelligence test used. Both large scale studies that reported no significant correlations employed the Wechsler IQ test (Jaušovec & Jaušovec, Reference Jaušovec and Jaušovec2000; Posthuma et al., Reference Posthuma, Neale, Boomsma and De Geus2001), whereas the studies that reported low positive correlations used Raven’s Matrices and the BIS test (Anokhin & Vogel, Reference Anokhin and Vogel1996; Grandy et al., Reference Grandy, Werkle-Bergner, Chicherio, Schmiedek, Lövdén and Lindenberger2013). Therefore the goal of the second part of the study was to investigate whether a relation between IAF and lower order factors (third-stratum in a hierarchical four stratum model, Johnson & Bouchard Jr, Reference Johnson and Bouchard2005) can be observed. For that purpose we adopted the Verbal-Perceptual-Image Rotation model of human intelligence (Johnson & Bouchard Jr, Reference Johnson and Bouchard2005; Reference Johnson and Bouchard2007a,Reference Johnson and Bouchardb). Specifically, Johnson and Bouchard Jr (Reference Johnson and Bouchard2005) constructed a factor model of residual abilities (after removing the effects of general intelligence) which extracted three factors: one representing a rotation–verbal dimension, one representing focus–diffusion of attention, and one representing content memory. Rotation and verbal factors tend to be negatively correlated, that is, individuals with relatively strong abilities that lie at one pole of each dimension tend to show relatively weak abilities on the other pole, and vice versa. Verbal ability is related to strong performance on vocabulary, spelling, and verbal interpretation tests, while relatively strong performance on mental rotation and shape manipulation tests dominates the rotation dimension. The second dimension captures the negatively correlated focus and diffusion of attention and ranges from problem solving abilities involving attentional focus on details one at a time (verbal, scholastic, spatial, and image rotation abilities), to the application of diffuse attention to a variety of cues simultaneously (fluency, content memory, and perceptual speed abilities). In addition, Johnson and Bouchard Jr (Reference Johnson and Bouchard2007a) reported strong gender differences on these two dimensions. Both men and women are located throughout the ranges of both dimensions, but women are concentrated towards the diffusion and verbal poles, and men are concentrated towards the focus and rotation poles. Johnson, Jung, Colom, and Haier (Reference Johnson, Jung, Colom and Haier2008) tested their model in relation to brain functioning. They correlated the rotation–verbal and focus–diffusion dimensions with brain volumes of gray and white matter. The correlations involving the rotation–verbal dimension were relatively localized to areas of the brain that have been implicated in tasks involving the relevant content areas in prior studies. The correlations observed involving the focus–diffusion dimension were primarily with white matter volumes and were distributed more widely across areas of the brain involved in sensory processing and attention. This division seems plausible since, as discussed in the previous sections, brain gray matter reflects information processing centers in the brain, and brain white matter handles communication between these centers.
With respect to the first part of the study, we expected to find no significant correlations between IAF and IQ test measures: Full-scale IQ (fIQ); Verbal IQ (vIQ) and Performance IQ (pIQ) – an assumption based on previous research (Jaušovec & Jaušovec, Reference Jaušovec and Jaušovec2000; Posthuma et al., Reference Posthuma, Neale, Boomsma and De Geus2001). In the second part of study, we predicted that IAF would significantly correlate with the factors rotation–verbal and focus–diffusion of attention. We further expected a moderating influence of the variable sex. This hypothesis was based on two premises: (1) the assumption that IAF is an indicator of the white matter structure supporting efficient communication between brain areas (e.g., Jann et al., Reference Jann, Koenig, Dierks, Boesch and Federspiel2010; Reference Jann, Federspiel, Giezendanner, Andreotti, Kottlow, Dierks and Koenig2012; Valdés-Hernández et al., Reference Valdés-Hernández, Ojeda-González, Martínez-Montes, Lage-Castellanos, Virués-Alba, Valdés-Urrutia and Valdes-Sosa2010) and (2) the observed gender differences reported for the two factors showing that women are more concentrated towards the diffusion and verbal poles, and men towards the focus and rotation poles (e.g., Johnson & Bouchard Jr, Reference Johnson and Bouchard2007a). For men, positive correlations between IAF and focus and rotation factors was predicted, whereas for women a similar correlation was expected for diffusion and verbal factors.
Method
Participants
The sample included 417 right-handed students; undergraduates and graduates, aged between 19 and 24 (248 females and 169 males, age: M male= 22.35, SD = 2.14; M female= 22.55, SD = 1.99). They were recruited from a large pool of individuals who participated in different experiments conducted at our lab in the last 6 years (e.g., Jaušovec & Jaušovec, Reference Jaušovec and Jaušovec2010; Tement, Pahor, & Jaušovec, Reference Tement, Pahor and Jaušovec2016; to name just some of them). The participants were tested with the WAIS-R test battery (Wechsler, Reference Wechsler1981), and their fIQ, vIQ and pIQ scores were determined. The sample for the second part of the study consisted of 188 individuals (117 females and 71 males, age: M male= 21.89, SD = 1.89; M female= 22.05, SD = 1.99) for whom data for all 11 WAIS-R subtests were available. This data was used to determine verbal-rotation and focus-diffusion scores for each individual (as described by Johnson et al., Reference Johnson, Jung, Colom and Haier2008). The formula used to determine the verbal-rotation dimension was: 100*(Block Design – Vocabulary) /Full Scale IQ. Negative scores indicate orientation towards verbal ability, whereas positive scores indicate orientation towards image rotation ability. The focus-diffusion dimension was determined by the formula: 100*(Block Design + Information – Coding – Digit Span) /Full Scale IQ. Negative scores indicate an orientation towards application of diffuse attention to a variety of cues simultaneously, by contrast, positive scores indicate orientation toward attentional focus on details one at a time. The experiment was undertaken with the understanding and written consent of each subject, following the recommendations of the ethics committee of the Slovene Psychological Association.
Procedure, EEG recording and quantification
The participants were seated in a reclining chair while their resting eyes closed EEG was recorded for 5 min. Afterwards they solved several tasks which were part of different studies described above. A Quick–Cap with sintered (Silver/Silver Chloride; 8 mm diameter) electrodes was fitted to each participant. Using the Ten-twenty Electrode Placement System of the International Federation, the EEG activity was monitored over nineteen scalp locations (Fp1, Fp2, F3, F4, F7, F8, T3, T4, T5, T6, C3, C4, P3, P4, O1, O2, Fz, Cz and Pz). All leads were referenced to linked mastoids (A1 and A2), and a ground electrode was applied to the forehead. Vertical eye movements were recorded with electrodes placed above and below the left eye. Electrode impedance was maintained below 5 kΩ. EEG was recorded using NeuroScan Acquire Software and a SynAmps RTamplifier (Compumedics, Melbourne Australia), which had a band-pass of 0.15–100.0 Hz. At cutoff frequencies the voltage gain was approximately –6 dB. The 19 EEG traces were digitized online at 1000 Hz with a gain of 10x (accuracy of 29.80 μV/LSB in a 24 bit A to D conversion) and stored on a hard disk. Offline EEG analysis was performed using NeuroScan Scan 4.5 software (Compumedics, Melbourne, Australia). IAF for each subject was determined based on their resting EEG (Angelakis, Lubar, Stathopoulou et al., Reference Angelakis, Lubar and Stathopoulou2004). First, power spectra were calculated over the entire epoch length of 11 s (11,132 data points) and automatically screened for artifacts. Second, an automatic peak detection procedure found the highest peak (maximum alpha power) in a 7 to 14 Hz window (frequency steps of 0.09 Hz) separately for each lead. This method was used because it is more adequate for studying endophenotypic qualities during resting (eyes closed) EEG sessions (Hooper, Reference Hooper2005; Klimesch et al., Reference Klimesch, Schimke and Pfurtscheller1993) than the peak frequency center of gravity method proposed by Klimesch et al. (Reference Klimesch, Schimke and Pfurtscheller1993), which is used for eyes open conditions. Third, IAF was computed for each channel and averaged over anterior (Fp1, Fp2, F3, F4, F7, F8, Fz), and posterior (T5, T6, P3, P4, O1, O2, Pz) locations.
Results and Discussion
Pearson’s correlation coefficients between IQ test scores and IAF measures are shown in Table 1. As predicted, none of the correlation coefficients reached significance. Further, no differences in relation to sex or location could be observed.
Pearson’s correlations of Full-scale IQ (fIQ), Verbal IQ (vIQ) and Performance IQ (pIQ) with anterior/posterior IAF measures for the whole sample and the male and female subsamples. Numbers in brackets are significance (p) values

For the whole sample, correlations between IAF measures and the factors verbal-rotation and focus-diffusion revealed no significant differences. In contrast, males showed significant positive correlations between the rotation-verbal factor and posterior IAF (r = .43; FDR p < .01) and between the focus-diffusion factor and anterior IAF (r = .25; FDR p < .07). For the female sample all correlations were negative, pointing to a reverse trend, although not reaching significance (see Table 2).
Pearson’s correlations of the verbal-rotation (VE-ROT) and focus-diffusion (FOC-DIFF) factors with anterior/posterior IAF measures for the whole sample and the male and female subsamples. Numbers in brackets are significance (p) values

* FDR p < .01; † FDR p < .07.
This distribution of correlations suggests that higher peak alpha frequency (IAF) is related to higher spatial ability in males. On the other hand, for females, higher IAF does not appear to be related to the level of verbal ability. A similar suggestion was put forward in a recent DTI study conducted by Dunst and colleagues (2014). A significant correlation between intelligence and white matter integrity (fractional anisotropy) was reported only for men, while for women no significant relations were observed. This led the authors to conclude that particularly in men higher myelination and a higher number of axons is related to a higher level of intelligence. Moreover, a large scale DTI study by Ingalhalikar and colleagues (2014) found that on the cerebral level male brains display more connectivity within the hemispheres (intrahemispheric), whereas female brains display more connectivity between hemispheres (interhemispheric), whereas in the cerebellum a reverse pattern was observed, with males showing stronger connections between the left cerebellar hemisphere and the contralateral cortex. These findings imply that male brains are structured to facilitate connectivity between perception and coordinated action, whereas female brains are designed to facilitate communication between analytical and intuitive processing (Ingalhalikar et al., Reference Ingalhalikar, Smith, Parker, Satterthwaite, Elliott, Ruparel and Verma2014). Even more complex findings in relation to white matter integrity, intelligence, socio-economic-status, sex and genetic factors were reported by Chiang and colleagues (2009; 2011). In brief, the authors found that genetic factors in high intelligent individuals explained almost 80% of variance in white matter integrity and that this relation was more pronounced in males than in females.
Furthermore, these sex-specific differences in correlations between IAF and the verbal-rotation and focus-diffusion factors also correspond to reported sex differences in spatial and verbal performance (e.g., Garai & Scheinfield, Reference Garai and Scheinfeld1968; Halpern, Reference Halpern2004; Jensen, Reference Jensen1998; Lippa, Collaer, & Peters, Reference Lippa, Collaer and Peters2010; Mackintosh & Bennett, Reference Mackintosh and Bennett2005; Masters & Sanders, Reference Masters and Sanders1993; Voyer, Voyer, & Bryden, Reference Voyer, Voyer and Bryden1995), suggesting a form of resting state neural efficiency, similar to the one observed in brain areas under cognitive load, which is also moderated by task content and sex (Jaušovec & Jaušovec, Reference Jaušovec and Jaušovec2008; Lipp et al., Reference Lipp, Benedek, Fink, Koschutnig, Reishofer, Bergner and Neubauer2012; Neubauer et al., Reference Neubauer, Fink and Schrausser2002; Neubauer & Fink, Reference Neubauer and Fink2003; Neubauer et al., Reference Neubauer, Grabner, Fink and Neuper2005).
Yet another characteristic worth mentioning is the topography of the significant correlations in males: high IAF over posterior areas was related to strong performance on mental rotation and shape manipulation tests (verbal-rotation factor) whereas high IAF over anterior areas was associated with good performance on problem solving orientations involving attentional focus on details one at a time (focus-diffusion factor). The topography is consistent with the major division of cortical function wherein the frontal cortex plays a role in top-down control of attention (Miller & Buschman, Reference Miller and Buschman2013) and the parietal cortex is important for spatial processing (Husain & Nachev, Reference Husain and Nachev2007). In addition, the topography of correlations displayed in males corresponds to the main assumptions of P-FIT (Jung & Haier, Reference Jung and Haier2007) and to Duncan’s (Reference Duncan, Duncan, McLeod and Phillips2005) multiple-demand system.
STUDY 2
Correlations reported between IAF and performance on memory tests (Angelakis, Lubar, & Stathopoulou, Reference Angelakis, Lubar and Stathopoulou2004; Clark et al., Reference Clark, Veltmeyer, Hamilton, Simms, Paul, Hermens and Gordon2004; Klimesch et al., Reference Klimesch, Schimke and Pfurtscheller1993) and reading tests (Angelakis, Lubar, Stathopoulou et al., Reference Angelakis, Lubar and Stathopoulou2004) are more consistent than those observed for intelligence. Therefore, it could be speculated that IAF is more engaged in working memory processes such as attention or temporary storage of information, than with those involved in fluid intelligence reasoning. The objective of the second study was to further explore this hypothesis.
In a large scale study (550 individuals, age 11 – 70 years), Clark and colleagues (2004) found a positive correlation between IAF (eyes-closed) and backward digit span, but not with forward digit span. In a second study by Angelakis, Lubar, and Stathopoulou (Reference Angelakis, Lubar and Stathopoulou2004), only a forward digit span task was administered. They observed a positive correlation between performance on the memory test and resting state eyes-closed IAF that was determined immediately prior to test administration. On the other hand, no significant correlation between memory performance and IAF determined immediately after the memory span test could be observed. Furthermore, correlations with IAF determined on the next day were also insignificant, even though they positively correlated with performance on WM tests administered on the same day. In a second study by Angelakis, Lubar, Stathopoulou et al. (Reference Angelakis, Lubar and Stathopoulou2004) a reading test was used. This time the correlations with IAF showed an even more unexpected pattern. The only correlations with IAF that were significant were obtained during reading, and were strongest when IAF was determined immediately after task completion. Angelakis, Lubar, Stathopoulou et al. (Reference Angelakis, Lubar and Stathopoulou2004) suggested that IAF may not be related to memory or reading ability as such, but is a manifestation of general cognitive capacity termed cognitive preparedness. Furthermore, the relations with test performance and their dependence on the time when IAF was determined (e.g., immediately prior, during task performance, or immediately after) may suggests that IAF could be on the one hand regarded as a trait (endophenotypic) and on the other, that it may index the current cognitive state. Similarly, Klimesch et al. (Reference Klimesch, Schimke and Pfurtscheller1993) demonstrated that (1) increased memory load led to a drop in IAF and (2) the IAF of good performers remained at a comparatively constant level as task demands increased, whereas in bad performers a decrease was observed. A third finding was that this difference was the highest during memory retrieval (1.25 Hz), followed by encoding and a reference interval preceding the task onset, and the smallest during a resting eyes-closed state. However, in all three studies a relatively small group of respondents participated, nineteen in the Angelakis, Lubar, and Stathopoulou (Reference Angelakis, Lubar and Stathopoulou2004); Angelakis, Lubar, Stathopoulou et al. (Reference Angelakis, Lubar and Stathopoulou2004) studies and sixteen in the Klimesch et al. (Reference Klimesch, Schimke and Pfurtscheller1993) study.
One of the main problems in WM research is to distinguish between storage and information processing components usually referred to as maintenance (Baddeley, Reference Baddeley2012; Baddeley, Allen, & Hitch, Reference Baddeley, Allen and Hitch2011; Cowan, Reference Cowan2001). Even the classic digit-span test for determining WM storage capacity is not immune to “chunking” of digits – the use of intelligent grouping of elements. This ambiguity has prompted several suggestions what the real WM capacity might be; ranging from Miller’s (Reference Miller1956) 7 ± 2 chunks; to the concept that WM is limited by the amount of time that has elapsed rather than by the number of elements that can be held simultaneously (Baddeley, Reference Baddeley1986); to today’s most popular view that storage limits exist, but they are completely task-specific, hence it is not possible to extract a general estimate (Cowan, Reference Cowan2001). Because the studies reported used mainly digit-span tests which are prone to rehearsal processes, this might have biased the correlations observed. Therefore in our second study we used measures of verbal and spatial WM capacity along with measures of the scope of attention that do not include any processing components (Cowan, Reference Cowan2011). An additional goal was to explore the relations between IAF’s endophenotypic characteristics (eyes-closed) and state-based characteristics (eyes-open) – the latter was determined during performance on a WM task.
Method
Participants
The sample included 115 right-handed students; undergraduates, aged between 19 and 21 (75 females and 40 males, age: M male = 20.18, SD = 1.14; M female = 20.25, SD = 1.09). Two males participated in the study only on the first day.
Procedure and tasks
The participants were invited to the lab on two consecutive days at approximately the same hour each day. On the first day, the participants were seated in a reclining chair while their resting eyes closed EEG was recorded for 3 min, after which they solved 4 WM tasks. The order of task presentation was counterbalanced. All tasks were presented on a computer monitor. The tasks used were: (1) forward and backward Corsi block-tapping tasks, measures of spatial WM capacity (Corsi, Reference Corsi1972). In this task nine blue squares were presented on a screen. On each trial the squares lit up one at a time in sequence. The respondents had to click on each square in the same order they were given (forward) or in the reverse order (backward). (2) Forward and backward digit-span tasks, measures of verbal WM capacity (Wechsler, Reference Wechsler1981). The task consisted of a sequence of digits, which were presented on the screen one at a time. The subjects had to type the list of digits in exactly the same order as presented (forward), or in a reverse order (backward). For each WM task, a memory span score was determined. On the second day, individuals solved a visual-array comparison task (Luck & Vogel, Reference Luck and Vogel1997) while their EEG was recorded. The visual-array comparison task measures WM for objects, however, it can also be seen as a measure of scope-of-attention, i.e., the limited capacity of the focus of attention (Cowan et al., Reference Cowan, Elliott, Saults, Morey, Mattox, Hismjatullina and Conway2005). On each trial, an array of colored squares was presented for 400 ms, followed by an inter-stimulus interval of 1000 ms, and a second array for 2000 ms. The second array was either identical to the first one or differed with respect to the color of one item. The target square in the second array was encircled and the participant had to press “2” on the response pad if the square differed in color from the square in the previously presented array, or press “1” if it did not differ in color. Three series with 4, 6, and 8 simultaneously presented colored squares were used. Each series consisted of 30 trials. A memory capacity score was determined for each participant (Pashler, Reference Pashler1988). The STIM2 stimulator (Compumedics Neuroscan Systems, Charlotte, NC, USA) generated all task items, recorded the correct answers and the reaction times for each answer.
EEG recording and quantification
EEG recording was the same as in Study 1. The procedure to determine resting eyes-closed IAF prior to WM task performance on the first day of the experiment was also the same as in Study 1. IAF during task performance was calculated from EEG recordings after a correction for ocular artifacts was performed. Epochs ranged from 1500 ms preceding the presentation of the first array to 3400 ms post-presentation and were automatically screened for artifacts. Epochs with amplitudes above ±100 μV were rejected (about 1%). IAF was determined via the channel reactivity-based method (CRB), freely available online at http://bio.dei.unipd.it/crb/ (Goljahani et al., Reference Goljahani, D’Avanzo, Schiff, Amodio, Bisiacchi and Sparacino2012; Goljahani, Bisiacchi, & Sparacino, Reference Goljahani, Bisiacchi and Sparacino2014). The values entered for the calculations were as follows. The reference interval was determined as –1500 to –500 ms corresponding to the resting period preceding the stimulus onset. The test interval was determined from 1400 ms to 2400 ms corresponding to the retrieval phase when the encircled square was presented on the monitor and the participant had to give their answer (press 1 or 2 on the response pad). The retrieval period was selected based on Klimesch et al.’s (Reference Klimesch, Schimke and Pfurtscheller1993) finding that the highest IAF reduction compared to resting state was observed during this memory process. The electrodes selected for anterior and posterior IAF averaging, as well as the frequency interval to determine IAF, were the same as in Study 1. Channel alpha frequencies (CAFs) were computed separately based on the reference interval and on the test interval. For the anterior and posterior IAF locations an average difference between the reference and test IAF was calculated using the formula: (IAFref – IAFtest)/(IAFref + IAFtest)/2. Subsequently, Fisher Z-transformation was applied to the calculate average differences.
Results and Discussion
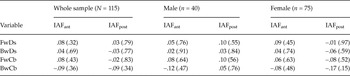
Correlations between IAF measures and the four WM tests are shown in Table 3. None of the correlations reached statistical significance. These results do not support the findings reported by Angelakis, Lubar, and Stathopoulou (Reference Angelakis, Lubar and Stathopoulou2004) and Clark et al. (Reference Clark, Veltmeyer, Hamilton, Simms, Paul, Hermens and Gordon2004). One can just speculate about the reasons that might have caused this difference. The most obvious possibility with respect to the Clark et al. (Reference Clark, Veltmeyer, Hamilton, Simms, Paul, Hermens and Gordon2004) study are differences in the age structure of individuals in both samples. Clark et al.’s (Reference Clark, Veltmeyer, Hamilton, Simms, Paul, Hermens and Gordon2004) sample of individuals ranged between 11 and 70 years of age. The regression analysis was performed across the entire sample and showed that age and anterior IAF were the only significant predictors of performance on the reverse digit span task explaining 10.2% of variance. No separate analysis for specific age groups were reported. In our study only young adults of almost equal age and educational background were tested, who in comparison with the Clark et al. (Reference Clark, Veltmeyer, Hamilton, Simms, Paul, Hermens and Gordon2004) study displayed higher and less variable digit span measures. Compared to the Angelakis, Lubar, and Stathopoulou (Reference Angelakis, Lubar and Stathopoulou2004) study, the most likely reason for the discrepant findings is the small sample size used in their study. This could also explain the diversity of significant correlations with respect to the time when IAF was determined (Angelakis, Lubar, & Stathopoulou, Reference Angelakis, Lubar and Stathopoulou2004; Angelakis, Lubar, Stathopoulou et al., Reference Angelakis, Lubar and Stathopoulou2004). A tentative conclusion could therefore be that on the population level (healthy individuals of equal age), there is no relation, or just a marginal one, between endophenotypic IAF (eyes closed) and WM capacity. As mentioned in the introduction, Grandy et al. (Reference Grandy, Werkle-Bergner, Chicherio, Schmiedek, Lövdén and Lindenberger2013) reported significant positive correlations between IAF and the BIS subtest memory, however, our findings suggest that IAF and WM capacity are not related. It should be noted that the BIS memory subtest relates to a much broader aspect of memory (similar to secondary memory Footnote 3 ) than the WM storage capacity determined by digit span and corsi block type tasks. The BIS memory subtest consist of tasks that require memorizing stories, lists of German or fantasy words and figural arrangements – tasks that are indirectly related to measures of working memory capacity.
Pearson’s correlations of forward digit-span tasks (FwDs ); backward digit-span tasks (BwDs); forward Corsi block-tapping tasks scores (FwCb); and backward Corsi block-tapping tasks scores (BwCb), with anterior/posterior IAF measures for the whole sample and the male and female subsamples. Numbers in brackets are significance (p) values

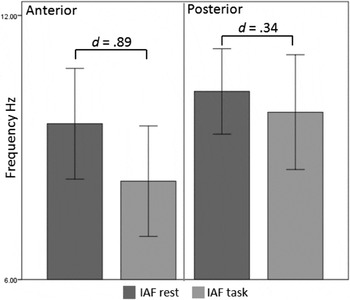
In the next step we analyzed IAF obtained while the participants were engaged with the visual-array comparison task. A general linear model for repeated measures was conducted in which the variables condition (reference/task) and location (anterior/posterior) were treated as within-subjects variables, and the variable sex (male/female) was handled as a between-subjects variable. The analysis showed a significant main effect of condition (F(1, 111) = 65.48; p < .001; Partial η2 = .371). IAF determined during task performance (retrieval phase) was on average .81 Hz lower than during the interval preceding stimulus onset. This finding is similar to the one reported by Klimesch et al. (Reference Klimesch, Schimke and Pfurtscheller1993) who also observed a drop in IAF during task performance. Also significant were the interactions between the variables condition and location (F(1, 111) = 18.99; p < .001; Partial η2 = .146) and between the variables location and sex (F(1, 111) = 9.07; p < .01; Partial η2 = .076). As can be seen in Figure 1, the decrease (reference interval versus task) in anterior IAF was much more pronounced than the one observed in posterior IAF, which might suggest a greater involvement of the frontal lobe due to the attentional processes required to solve the visual-array comparison task (Duncan et al., Reference Duncan, Seitz, Kolodny, Bor, Herzog, Ahmed and Emslie2000; Duncan, Reference Duncan2013). These interactions showed no sex specific patterns, however, women tended to display higher parietal and lower frontal IAF than males both in resting and task conditions.
Histograms of average IAF (Hz) in the anterior and posterior locations determined for the reference interval (rest) preceding stimulus onset and the task interval (test – retrieval of information). The t-tests for both differences revealed significant differences. Shown are Cohen’s effect size measures. Error bars = ±1 SD.

As can be seen in Table 4, individuals with higher memory span scores on the visual-array comparison task showed the lowest drop in IAF during task performance and also tended to respond faster than low memory performers with a more pronounced IAF drop. These findings are in agreement with those reported by Klimesch et al. (Reference Klimesch, Schimke and Pfurtscheller1993). Significant correlations with performance measures were in general related to IAF measured at anterior locations, which is in line with the above observed trend in task-related IAF decreases. The relations showed also a sex specific pattern – in males the relation tended to be stronger for the amount of correct answers, whereas in females it was stronger for processing speed. Sex differences in cognitive performance and sensory processing could explain these results. For instance, Irwing (Reference Irwing2012) reported that females outperformed males on tasks of processing speed (0.72 – 1.30d). It has been further shown that females have larger visual fields than men – they can see farther out on the periphery while fixating on a central point (Burg, Reference Burg1968) and they are also better than males at visual scanning of objects (Kimura, Reference Kimura1999). In a study conducted at our lab it was found that females displayed significantly higher amplitudes in evoked gamma responses (mainly in the visual domain) when they were passively viewing geometric shapes, which would point to an amplified transfer of visual stimulus features compared to males (Jaušovec & Jaušovec, Reference Jaušovec and Jaušovec2009a). Furthermore, for more complex visual tasks females displayed shorter reaction times than males (Jaušovec & Jaušovec, Reference Jaušovec and Jaušovec2009b).
Pearson’s correlations of the average memory capacity score (Pashler, Reference Pashler1988) on the visual-array comparison task (VACT) and reaction times (VACT-RT) with anterior/posterior Fisher-Z transformed average differences between IAF at rest (reference) eyes open and IAF during VACT performance (test) measures for the whole sample and the male and female subsamples. Numbers in brackets are significance (p) values

* FDR p < .03.
No significant correlations between resting eyes-closed IAF obtained on the first day of examination and performance on the visual-array comparison task were observed. Similarly, there were no significant correlations between eyes-open IAF determined during task performance and the performance on the four memory span tasks (forward and backward Corsi block-tapping and digit span tasks) administered on the first day. These findings further support the division between an endophenotypic IAF and a state-based IAF reflecting fluctuations in moment-to-moment activity as suggested by Angelakis, Lubar, Stathopoulou et al. (Reference Angelakis, Lubar and Stathopoulou2004); Barry et al. (Reference Barry, Clarke, Johnstone, Magee and Rushby2007) and Klimesch et al. (Reference Klimesch, Schimke and Pfurtscheller1993), who made the distinction between arousal and activation – stating that they have different energetic effects on physiological responding. The former obtained in eyes-closed conditions was defined as the current energetic level of the organism, whereas the latter observed in eyes-open conditions was defined as a separable tonic measure reflecting task-related mobilization of energy needed to perform a task. This would also imply that arousal and activation are related at an intraindividual level. The significant correlations between the IAFs obtained in eyes-closed and eyes-open task conditions observed in our study (r = .31 to r = .65; p < .01) are in line with this assumption.
STUDY 3
The objective of this study was to establish a causal relation between IAF and fluid intelligence (measured with an IQ test). For that purpose we increased IAF of individuals with transcranial alternating current stimulation (tACS). tACS is a non-invasive stimulation technique that applies oscillating electrical currents in specific frequency bands thereby affecting neuronal membrane potentials. It is thought that tACS interacts with ongoing rhythmic cortical activities during cognitive processes (Kuo & Nitsche, Reference Kuo and Nitsche2012). tACS can influence brain oscillations via interference or entrainment of ongoing oscillations (Thut & Miniussi, Reference Thut and Miniussi2009), as recently demonstrated with rhythmic transcranial magnetic stimulation (rTMS) in the alpha band (Thut et al., Reference Thut, Veniero, Romei, Miniussi, Schyns and Gross2011), and by tACS in individually determined alpha frequency bands (Zaehle, Rach, & Herrmann, Reference Zaehle, Rach and Herrmann2010). In a recent study Neuling, Rach, and Herrmann (Reference Neuling, Rach and Herrmann2013) replicated and extended the findings of Zaehle et al. (Reference Zaehle, Rach and Herrmann2010) by showing that the tACS-induced alpha amplitude enhancement remained present for at least 30 min after stimulation offset.
In our study, individual alpha frequency was up-regulated by applying tACS in the IAF + 1 Hz frequency band. In the next step we analyzed the differences in behavioral and neuro-electric measures between sham and verum tACS sessions. Based on the results obtained in study 1 and 2 we expected that increased IAF will have a positive influence on performance on Raven’s matrices test, which will be reflected in neuro-electric brain activation patterns – induced event related desynchronization/synchronization (ERD/ERS) and induced event related coherence (ERCoh). Because tACS was delivered in the IAF + 1 Hz frequency band differences in neuroelectric measures were expected mainly in the upper alpha band.
Method
Subjects
The sample included 20 right-handed students (11 females and 9 males, age: M = 20.18, SD = 0.40). They were invited to the laboratory on two consecutive days. Two males were excluded from the analysis because verum tACS did not increase their IAF. The males and females did not significantly differ with respect to their IQ scores (WAIS-R: M male = 110.4; SD = 5.26; M female = 108.2; SD = 6.85; t(16) = .74; p < .47; d = .36). Because it has been shown that the relative release of sexual hormones during different phases of the menstrual cycle affects cognitive responses of females (Amin et al., Reference Amin, Epperson, Constable and Canli2006), the female respondents have been equalized with respect to their menstrual cycle. Six of the female participants were in their follicular phase and 5 in their luteal phase of their menstrual cycle.
Procedure and tasks
Respondents participated on two consecutive days in a sham and a verum tACS setting that were counterbalanced. On both days, the participant’s resting eyes-closed EEG was recorded for 3 min, followed by sham or verum stimulation, after which post-stimulation resting eyes-closed EEG was recorded for 3 min, then the participant solved RAPM tests. At the end of the experiment they answered a questionnaire about their sensations during the stimulation. The RAPM was based on a modified version of Raven’s progressive matrices (Raven, Reference Raven1990), which is a widely used and well established test of fluid intelligence (Sternberg, Ferrari, Clinkenbeard, & Grigorenko, Reference Sternberg, Ferrari, Clinkenbeard and Grigorenko1996). The correlation between this modified version of RAPM and WAIS-R was r = .56, (p < .05, N = 97) (Jaušovec & Jaušovec, Reference Jaušovec and Jaušovec2012). Similar correlations on the order of 0.40 to 0.75 were also reported for the standard version of RAPM (Court & Raven, Reference Court and Raven1995). Therefore it can be concluded that the modified application of the RAPM did not significantly alter its metric characteristics. We used 50 test items—25 easy (Advanced Progressive Matrices Set I: 12 items and the B Set of the Colored Progressive Matrices) and 25 difficult (Advanced Progressive Matrices Set II: items 12 to 36). The RAPM tasks were presented on a computer screen (positioned about 80–100 cm in front of the participant), at fixed 10 or 14 s interstimulus intervals. On a given trial, a figural matrix with the lower right entry missing appeared, and the participant had to determine which of 4 options fit into the missing space. The 50 test items were divided into 2 parallel forms consisting of 25 items each and were alternated between the sham/verum conditions. Test items were exposed for 6s (easy) or 10 s (difficult) following a 2s interval during which a fixation cross was presented. During this time, the participants were instructed to press a button on a response pad (1–4) to indicate their answer (Jaušovec & Jaušovec, Reference Jaušovec and Jaušovec2012).
Electrical stimulation
Transcranial alternating current stimulation (tACS) was applied via two sponge electrodes attached to the head underneath an EEG recording cap (Quik-Cap Compumedics Neuromedical supplies, Charlotte, NC, USA). The target electrodes were placed over the left/right dorsolateral prefrontal cortex (F3/F4). This location was chosen because the correlational analysis in study 2 showed that the anterior location showed the most significant relations with IAF. The electrodes (7×5 cm) were placed in saline soaked sponges (Moliadze, Antal, & Paulus, Reference Moliadze, Antal and Paulus2010). The waveform of the stimulation was sinusoidal without DC offset with a 0° relative phase. The impedance was kept below 10 kΩ. We applied oscillating currents 1 Hz above IAF (determined prior to verum stimulation) of each participant (M = 10.95; SD = 0.98) using a battery-operated stimulator system (DC-stimulator plus, Neuroconn, Ilmenau, Germany). In the verum condition, tACS was applied for 15 minutes. The current was ramped up and down over the first and last 15s of stimulation. In the sham condition, the procedure was the same except for the duration of stimulation, which was applied for 1 minute and turned off automatically. Because most participants feel an itching sensation only initially during tACS, this procedure prevents awareness of the stimulation conditions (Nitsche et al., Reference Nitsche, Cohen, Wassermann, Priori, Lang, Antal and Pascual-Leone2008).
The magnitude of the stimulating current was based on individually determined thresholds for skin sensations induced by tACS. To determine these thresholds, we applied tACS at the individual alpha frequency for 1 minute (ramping up and down for 15 ms) at a time and increased the amplitude stepwise by 250 μA starting with 1000 μA until a maximum of 2250 μA was reached. Participants were asked to keep their eyes closed and indicate the presence of a sensation. For the remaining experiment, stimulation intensity was kept at 250 μA below the threshold for skin sensations (Modus = 1750 μA peak-to-peak; Range = 1000 μA to 2000 μA).
EEG recording and quantification
EEG recording and the determination of IAF during rest and during task performance were the same as in Study 2. The calculation of the ERD/ERS and ERCoh measures were based on epochs comprised from 2000 ms preceding and 10000 ms following stimulus presentation. Prior to analysis, a correction for ocular artifacts was performed and epochs were automatically screened for artifacts. All epochs showing amplitudes above ± 80 μV were excluded. Overall, 2.1 % of epochs were excluded from further analysis.
The frequency bands for the ERD/ERS and ERCoh analyses were individually determined in 2.0 Hz steps based on the individual alpha peak frequency determined prior to verum/sham stimulation (Verum: M IAF = 9.98; SD IAF = 0.98; Sham: M IAF = 10.07; SD IAF = 0.84); upper alpha = [IAF to IAF + 2.0 Hz]; lower-2 alpha = [IAF to IAF – 2.0 Hz]; lower-1 alpha = [IAF – 2.0 Hz to IAF – 4.0 Hz]; and theta = [IAF – 4.0 Hz to IAF – 6.0 Hz]; (Klimesch, Reference Klimesch1999). The induced ERD/ERS was determined using the method of complex demodulation with a simultaneous signal envelope computation (Andrev, Reference Andrev, Pfurtscheller and Lopes da Silva1999). For this method, raw data for each channel were multiplied, point-by-point, by a pure cosine based on the selected center frequency and pure sine with the same center frequency. Both time series (multiplied by a pure sine and cosine) were then lowpass filtered by the half-bandwidth (1 Hz).
The quantification of induced ERD was done using the intertrial variance method (induced, non-phase-locked activity). The formulas used were as follows (Pfurtscheller, Reference Pfurtscheller, Pfurtscheller and Lopes da Silva1999):
 $$I{V_{\left j \right}} = {1 \over {N - 1}}\sum\limits_{i = 1}^N {{{\left\{ {{y_{f\left {i,j} \right}} - {{\bar y}_{f\left j \right}}} \right\}}^2}}$$
In equation (1) N is the total number of trials, yf(i,j) is the j-th sample of i-th trial data, and
 ${\bar y_{f\left( j \right)}}$
is the mean of the j-th sample over all trials. ERD (IV) data were used to calculate the ERD/ERS values that were defined as the percentage change of the power at each sample point (Aj) relative to the average power during the resting 1000 ms reference interval (R) preceding the stimulus onset (–1500 ms to –500 ms):
 $$ER{D_{\left j \right}}\% = {{R - Aj} \over R}2$$
A positive ERD indicates a power decrease, and a negative ERS indicates a power increase (Pfurtscheller, Reference Pfurtscheller, Pfurtscheller and Lopes da Silva1999). The ERD/ERS values were determined for six 1000 ms time windows (from stimulus onset till 6000 ms). The ERD/ERS values were collapsed for different electrode locations, distinguishing the hemispheres as well as frontal, central, and parietal brain areas. The electrode positions were aggregated as follows: frontal left (Fp1, F3, F7, Fz), frontal right (Fp2, F4, F8, Fz), central left (T3, C3, Cz), central right (T4, C4, Cz), parietal left (T5, P3, O1, Pz), and parietal right (T6, P4, O2, Pz).
The ERCoh was determined from the same bandpass-filtered time series:
 $y_{i,n}^{\left( r \right)}$
. The time-dependent complex correlation between each pairwise combination of channels, i and k, was then computed as:
 $$\hat \rho = {{\sum\limits_{r = 1}^R {\left {y_{i,n}^{\left r \right} - {{\bar y}_{i,n}}} \right{{\left {y_{k,n}^{\left r \right} - {{\bar y}_{k,n}}} \right}^*}} } \over {\sqrt {\sum\limits_{r = 1}^R {{{\left| {y_{i,n}^{\left r \right} - {{\bar y}_{i,n}}} \right|}^2}\sum\limits_{r = 1}^R {{{\left| {y_{k,n}^{\left r \right} - {{\bar y}_{k,n}}} \right|}^2}} } } }}3$$
In equation (3) * denotes complex conjugation and
 ${\bar y_{i,n}}$
are the complex average potentials calculated by averaging the complex time series for channel i across all trials.
Because of the potential for spurious coherence due to volume conduction effects, EEG coherence should be examined between sites that are widely spaced (>5 cm). In our case, the data analyzed were recorded with electrodes spaced about 7 cm apart, minimizing the effects of volume conduction (e.g., Babiloni et al., Reference Babiloni, Babiloni, Fattorini, Carducci, Onorati and Urbano1995). ERCoh values were determined for the same narrow frequency band as the ERD/ERS measures. They were estimated for all electrode pairs. In that way 171 coherence measures were computed for each frequency band. Subsequently, the Fisher Z-transform was applied to the coherence values. This serves not only to normalize the distributions of values, but also to reduce the difference in confidence intervals between greater and smaller values.
Results and Discussion
The questionnaire data were analyzed with a Wilcoxon nonparametric test for two related samples (sham/verum). The test showed no significant differences between participants’ sensations during sham and verum tACS settings (Z(17) = .51; p exact < .68).
Differences between pre- and post-tACS effects on IAF in the sham and verum settings during rest (eyes closed) and while solving the RAPM were determined with t-tests for repeated measures. As can be seen in Figure 2, the only significant difference between pre- and post-tACS on IAF was observed in the verum setting (t(17) = 3.09; p < .007; d = .73). Verum tACS significantly increased IAF (on average for .28 Hz), whereas no influence of sham tACS on IAF could be observed. Similar influences of verum tACS delivered in the IAF range on power measures were reported in several other studies (e.g., Neuling et al., Reference Neuling, Rach and Herrmann2013; Vossen, Gross, & Thut, Reference Vossen, Gross and Thut2015; Zaehle et al., Reference Zaehle, Rach and Herrmann2010).
Histograms of average IAF (Hz) in sham and verum settings recorded prior and after tACS and during performance on RAPM. Shown are Cohen’s effect size measures for significant differences determined with a t-test for repeated measures. Error bars = ±1 SD.

Performance data were analyzed with a GLM for repeated measures – tACS (sham/verum) was treated as a within-subjects variable, whereas sex (male/female) was handled as a between-subjects variable. The analysis showed only a significant interaction effect between tACS and sex (F(1, 16) = 5.21; p < .04; Partial η2 = .25). As can be seen in Figure 3, males showed lower RAPM performance in the verum tACS condition compared to the sham tACS condition, whereas females showed increased performance in the verum condition compared to sham. Subsequent t-tests comparing RAPM performance in sham and verum tACS settings conducted separately for males and females (see Figure 3) were not significant. However, there was a trend that in males the disruption effect of verum tACS on RAPM performance was more pronounced (d = .77) than the beneficial effect for females (d = .38).
Histograms of average performance on the RAPM test in sham and verum tACS settings separated for males and females. Shown are t-tests with significance levels and Cohen’s effect size measures. Error bars = ±1 SD.

The verum tACS-related disruptive effect on male RAPM performance is unexpected. However, in our opinion it can be explained as a summation of several small effects such as test characteristics and format of presentation, the sex specific relation of endophenotypic IAF with factors of fluid intelligence as well as preferred solution strategies. The Raven’s matrices test is based on Spearman’s (Reference Spearman1927) principles of eduction of relations and correlates (Deary, Reference Deary2000) and is regarded as one of the best measures of g. It is based on abstract figures and therefore requires visuo-spatial ability (e.g., Abad, Colom, Rebollo, & Escorial, Reference Abad, Colom, Rebollo and Escorial2004). In Study 1 it was shown that endophenotypic posterior IAF has in males a strong relation with performance on mental rotation and shape manipulation tasks (rotation factor). In contrast, anterior IAF was in males related to orientations involving attentional focus on details one at a time. In addition, the reported male advantage in mental rotation tests has been most often attributed to sex-specific differences in strategy use (Butler et al., Reference Butler, Imperato-McGinley, Pan, Voyer, Cordero, Zhu and Silbersweig2006; Gootjes, Bruggeling, Magnee, & van Strien, Reference Gootjes, Bruggeling, Magnée and Van Strien2008a,Reference Gootjes, Bruggeling, Magnée and Van Strienb; Hugdahl, Thomsen, & Ersland, Reference Hugdahl, Thomsen and Ersland2006; Jordan, Wüstenberg, Heinze, Peters, & Jäncke, Reference Jordan, Wüstenberg, Heinze, Peters and Jäncke2002). It was hypothesized that women performed mental rotation tasks in an effortful, “top-down” way, whereas men used an automatic, “bottom-up” strategy. This corresponds also to the reported negative relation of time limits when solving rotation tasks observed in females (Voyer, Reference Voyer2011). Therefore, it could be speculated that tACS delivered to the left and right dorsolateral prefrontal cortex enhanced ordered step-wise problem solving processes that correspond to female solution strategies and conflict with male problem solving strategies. Two recent studies reported similar findings: tACS delivered to parietal brain areas had a much more positive effect on RAPM performance than when delivered to frontal brain areas (Pahor & Jaušovec, Reference Pahor and Jaušovec2014; Wammerl, Benedek, Jauk, & Jaušovec, Reference Wammerl, Benedek, Jauk and Jaušovec2015). Moreover, Sellers et al. (Reference Sellers, Mellin, Lustenberger, Boyle, Lee, Peterchev and Fröhlich2015) applied bilateral anodal tDCS (enhanced cortical activity and excitability) over frontal locations (F3/F4) and showed that tDCS decreased performance on full-scale IQ (WAIS-IV). The most pronounced differences were observed for perceptual reasoning subtests and in particular for matrix reasoning. This subtest is similar to the modified version of Raven’s matrices used in our study and its scores are also speed-dependent, which lends further support for the provided explanation of verum tACS disrupting effects on male RAPM performance.
ERD/ERS data were analyzed with a GLM for repeated measures: tACS (sham/verum) x time (six 1000 ms segments) x hemisphere (left/right) x location (frontal, central, occipito-parietal) x sex (male/female). The GLM analysis showed a significant main effect for tACS (sham/verum) only in the upper alpha band (F(1, 16) = 5.50; p < .03; η2 = .24). No significant sex-specific interaction effects were observed. As can be inferred from Figure 4, participants in the verum tACS condition as compared to the sham condition showed increased upper alpha desynchronization (ERD) pointing to increased brain activation. A similar pattern of brain activity, although accompanied by substantial gains on several fluid intelligence tests, was also reported in our study where we delivered theta tACS to parietal locations (Pahor & Jaušovec, Reference Pahor and Jaušovec2014).
Topographic maps of ERD/ERS activity in the upper alpha band during performance on RAPM in a sham and verum tACS condition. Connectivity map of significant differences in ERCoh values in the upper alpha and theta frequency band between the sham and verum tACS settings (FDR corrected).

Differences in induced ERD/ERS measures were only observed in the upper alpha band which is in line with our expectation given that tACS was delivered in the IAF+1 Hz frequency band, which represents the mid frequency of the upper alpha band.
ERD/ERS measures are calculated as a percentage change in power relative to a resting reference interval preceding the stimulus onset (–1500 ms to –500 ms). It is therefore possible that the observed differences were the result of changed resting state brain activity induced with tACS. To check for this possibility, we analyzed differences in resting intervals between sham and verum tACS sessions. A GLM for repeated measures (upper alpha frequency band) showed no significant difference in relation to tACS (F(1, 16) = .94; p < .35; η2 = .06). This further indicates that increased IAF induced by tACS influenced brain activation patterns only while respondents solved the RAPM tasks.
Differences in Fisher-Z transformed induced ERCohs were analyzed with a Wilcoxon nonparametric test for two related samples (sham/verum). The obtained 171 p values for each frequency band were then corrected for false discovery rate (FDR; p < .05) (Benjamini, Krieger, & Yekutieli, Reference Benjamini, Krieger and Yekutieli2006). Significant differences were only obtained in upper alpha and theta frequency bands (see Figure 4). All values showed increased dissociation mainly over a hub located in the right temporo-parietal area. In the upper alpha band the dissociation was between midfrontal and right parietal areas, whereas in the theta band it was mainly between right temporal and central locations. These locations are close to the main hubs of the salience and central executive networks, which may suggest switching of activity from the default mode network to the central executive network (Bressler & Menon, Reference Bressler and Menon2010; Raichle et al., Reference Raichle, MacLeod, Snyder, Powers, Gusnard and Shulman2001; Raichle, Reference Raichle2006; Seeley et al., Reference Seeley, Menon, Schatzberg, Keller, Glover, Kenna and Greicius2007; Sridharan et al., Reference Sridharan, Levitin and Menon2008). Furthermore, a similar fronto-parietal dissociation was also observed in an fMRI study by Takeuchi et al. (Reference Takeuchi, Taki, Nouchi, Hashizume, Sekiguchi, Kotozaki and Kawashima2013) in relation to working memory training-induced changes in resting-state brain activation. After 4 weeks of training, decreased resting functional connectivity between the medial prefrontal cortex, the right posterior parietal cortex and the right lateral prefrontal cortex (key nodes of the default mode network and the external attentional system) were observed. This pattern could therefore suggest that higher cognitive performance is related to a dissociation between the two networks. Similar small-world activation patterns in relation to working memory performance obtained with high density EEG recordings were also reported by Langer, von Bastian, Wirz, Oberauer, and Jäncke, (2013). However, in our study only females showed increased cognitive performance, while the same brain activation pattern was in males related to decreased performance. As discussed above, this difference could stem from sex-specific solution strategies.
Conclusion
The objective of the 3 studies was to further elucidate the relation between IAF and fluid intelligence. The main finding is that this association is not as straightforward as proposed in several studies either implying a positive correlation (Anokhin & Vogel, Reference Anokhin and Vogel1996; Grandy et al., Reference Grandy, Werkle-Bergner, Chicherio, Schmiedek, Lövdén and Lindenberger2013) or no correlation (Jaušovec & Jaušovec, Reference Jaušovec and Jaušovec2000; Posthuma et al., Reference Posthuma, Neale, Boomsma and De Geus2001). As revealed in Study 1, the relationship seems to be moderated by sex, brain location, and specific mental abilities. Once again, this opens the question of the existence of a neuro-g put forward by Haier et al. (Reference Haier, Colom, Schroeder, Condon, Tang, Eaves and Head2009) and more recently by Hampshire et al. (Reference Hampshire, Highfield, Parkin and Owen2012), who proposed that intelligence is not unitary but is formed of multiple cognitive components. Study 2 opened the question whether IAF can be regarded as a unique biomarker of neuro-electric brain activity, or should be divided into an endophenotypic IAF indicative for the arousal of the attentional system and an activation IAF reflecting state dependent fluctuations in moment-to-moment brain activity (Barry et al., Reference Barry, Clarke, Johnstone, Magee and Rushby2007). In study 3 an experimental approach was introduced suggesting that electrical stimulation techniques like tDCS and tACS represent valuable tools for studying the neurobiological underpinning of intelligence.