Introduction
Semiconductor electronic devices exploiting the confinement of electrons with well-defined quantum states present a promising route toward computing systems that can solve problems that are not within the capabilities of classical computers [Reference Zwanenburg, Dzurak, Morello, Simmons, Hollenberg, Klimeck, Rogge, Coppersmith and Eriksson1]. Examples include solutions to problems that become intractable for large numbers or for complex systems, as, for example, in the use of Shor’s algorithm to find the prime factors of an integer number or in many-body physics problems studied using quantum simulators [Reference Vandersypen, Steffen, Breyta, Yannoni, Sherwood and Chuang2, Reference Bernien, Schwartz, Keesling, Levine, Omran, Pichler, Choi and Zibrov3, Reference Zhang, Pagano, Hess, Kyprianidis, Becker, Kaplan, Gorshkov, Gong and Monroe4]. Quantum bits or qubits form the basis for the development of quantum devices and can be realized in high-mobility semiconductor heterostructures by tuning the electrostatic potential of quantum dots using metallic electrodes [Reference Hanson, Kouwenhoven, Petta, Tarucha and Vandersypen5]. Large numbers of physical qubits are required to address practical problems, but presently, the challenge of precisely defining and controlling multiple qubits have led to efforts to develop computational methods involving relatively few qubits, as in quantum algorithms for chemistry problems [Reference Hastings, Wecker, Bauer and Troyer6].
A proposed approach to scaling up the number of qubits in semiconductor-based systems is to use several local registers of few-quantum-dot arrays connected by long-distance couplers [Reference Vandersypen, Bluhm, Clarke, Dzurak, Ishihara, Morello, Reilly, Schreiber and Veldhorst7]. Recent results of strong spin–photon coupling suggest that superconducting resonators can be used as long-distance couplers [Reference Landig, Koski, Scarlino, Mendes, Blais, Reichl, Wegscheider, Wallraff, Ensslin and Ihn8, Reference Samkharadze, Zheng, Kalhor, Brousse, Sammak, Mendes, Blais, Scappucci and Vandersypen9, Reference Mi, Benito, Putz, Zajac, Taylor, Burkard and Petta10]. Although there is no consensus about the design of the local registers, a linear quantum-dot array is a strong candidate because of its simpler fabrication and control challenges. Experiments with linear arrays with up to five dots have been performed so far [Reference Ito, Otsuka, Amaha, Delbecq, Nakajima, Yoneda, Takeda, Allison, Noiri, Kawasaki and Tarucha11]. Cross-capacitance effects and the increasing distance of the quantum dots from the reservoirs from which electrons are drawn, however, lead to a significant increase in the complexity of tuning these arrays as the size of the array increases.
An additional challenge is fabricating quantum dot devices with accurately predicted electronic properties. One particular issue arises from the mechanical stress imposed on devices by residual and thermal stresses in the metallic gate electrodes used to define the quantum dots. The magnitude of the residual stress in the metallic gates, the gate-induced lattice distortions, and their impact on the electronic properties of double-dot quantum devices have been measured and modeled quantitatively in both Si-based and GaAs-based heterostructures [Reference Park, Ahn, Tilka, Sampson, Savage, Prance, Simmons, Lagally, Coppersmith, Eriksson, Holt and Evans12, Reference Pateras, Park, Ahn, Tilka, Holt, Reichl, Wegscheider, Baart, Dehollain, Mukhopadhyay, Vandersypen and Evans13]. Here, we show that there is an additional series of structural issues that arises in devices incorporating many quantum dots because these multi-dot devices occupy large, micrometer-scale areas and thus pose significant challenges to the uniformity of device preparation. Multiple-quantum-dot devices exhibit distortions due to the formation of electrodes and are affected by variations in the residual stress at sub-micrometer scales along each electrode. The experimental study consists of structural characterization of multiple-quantum-dot devices and complementary detailed measurements of distortions near individual electrodes.
The structural consequences of electrode-induced distortions were investigated in a linear array of eight quantum dots, termed a qubyte, fabricated in an epitaxial GaAs/AlGaAs heterostructure. Each quantum dot is located within a two-dimensional electron gas (2DEG), which forms at the GaAs/AlGaAs interface. Several structural problems arise during the fabrication and integration of multiple-qubit semiconductor devices. The gates used for the electrostatic definition of quantum dots introduce stress through the mismatch of the metal/semiconductor thermal expansion coefficients and because the metal thin films from which the gates are formed incorporate residual stress. Sources of the residual stress include the crystal growth of the polycrystalline electrode and the formation of the metal–semiconductor interface. The electrode stress is elastically coupled to the 2DEG interface, which produces unintentional distortions in GaAs/AlGaAs double-dot quantum devices [Reference Pateras, Park, Ahn, Tilka, Holt, Reichl, Wegscheider, Baart, Dehollain, Mukhopadhyay, Vandersypen and Evans13].
The existence of elastic distortions introduced by periodic arrays of metallic electrodes has been inferred from magnetoresistance measurements in GaAs/AlGaAs heterostructures [Reference Davies and Larkin14, Reference Larkin, Davies, Long and Cuscó15]. The magnitude and spatial distribution of the residual stress vary within individual electrodes at the nanoscale over distances of hundreds of nanometers and are difficult to predict because these factors depend on several variables associated with the deposition process, geometrical distribution, and lithography of the electrodes [Reference Chaudhari16]. Experimental characterization of multiple-quantum-dot devices is important because there are significant difficulties in predicting the distortion due to the large number of electrodes required for device operation and because the electrodes have a complex nanoscale pattern. The distortions resulting from residual stress and its variation have a large enough magnitude to be important considerations in devices, for example, through perturbations in the charging energies of the quantum dots.
Synchrotron X-ray nanobeam diffraction measurements of the multiple quantum dot device indicate that there is spatial inhomogeneity of the gate-induced strain with a variation of 105 in strain among different quantum dots and a difference of similar magnitudes between the dots and the unpatterned heterostructure. In comparison with other characterization techniques, such as transmission electron microscopy (TEM), X-ray nanobeam diffraction measures nanoscale lattice distortions in thick layers without extensive sample preparation and the accompanying possibility of perturbing the strain state of the heterostructure. The Bragg reflection geometry employed in X-ray nanobeam diffraction allows large areas to be studied and provides an extended field of view spanning entire multiple-quantum dot devices. TEM offers sub-nanometer-scale real-space resolution, which can be important in probing strain near interfaces or in nanoscale devices but requires the preparation of thin sample using methods that can perturb the strain state [Reference Hytch and Minor17, Reference Hytch, Putaux and Penisson18].
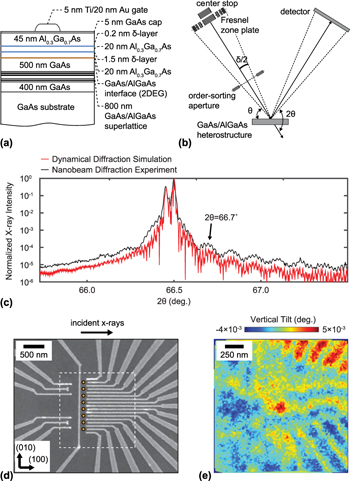
The device probed in these experiments consisted of a linear array of eight quantum dots electrostatically defined in a 2DEG interface formed in the GaAs/AlGaAs heterostructure. A cross-sectional schematic of the heterostructure, including the AlGaAs layer beneath which the 2DEG is formed, is shown in Fig. 1(a). The nanofabricated gates are formed from a metal thin film consisting of a 5-nm-thick Ti adhesion layer and 20 nm of Au. The synchrotron X-ray nanodiffraction experimental arrangement used to probe the device is shown in Fig. 1(b). Further experimental details, including the thicknesses and compositions of the layers of the heterostructures, the arrangement of X-ray optical elements, and definitions of scattering angles are provided in the Experimental details section.
(a) Cross section of the GaAs/AlGaAs heterostructure. (b) Schematic of the X-ray nanodiffraction experiment, including definitions of the scattering angles θ and 2θ. (c) X-ray intensity (black curve) obtained during a θ/2θ scan using the focused nanobeam, plotted as a function of the angle of incidence θ. The red line shows the intensity predicted by a dynamical diffraction simulation using a plane-wave incident X-ray beam. (d) SEM image of the quantum multi-dot array. Disks indicate the locations of the electrostatically defined quantum dots. (e) Map of the vertical tilt within the region of the qubyte.

The angular distribution of diffracted X-ray intensity acquired with the X-ray nanobeam in a scan along the specular rod in reciprocal space is shown in Fig. 1(c). This scan is equivalent to a conventional thin-film diffraction θ–2θ scan. The methods required to acquire a high-angular-resolution diffraction pattern using the convergent X-ray nanobeam are discussed in the Experimental details. The measured intensity in Fig. 1(c) is accurately fit by a diffraction simulation method considering a monochromatic σ-polarized incident X-ray plane wave and using the Darwin theory of dynamical X-ray diffraction [Reference Durbin and Follis19, Reference Pateras, Park, Ahn, Holt, Kim, Mawst and Evans20].
Figure 1(d) shows a scanning electron microscopy (SEM) image of the gate structure used to define the quantum dots. A series of disks are overlaid on the image to indicate the designed locations of the individual quantum dots. As discussed in detail below, the device region is distorted by the electrode layers. A map of the angular tilt of the AlGaAs layers of the quantum dot array is shown in Fig. 1(e). The tilts plotted in Fig. 1(e) correspond to the rotation of the atomic planes of the AlGaAs layer toward the top or bottom edges of the images, the direction perpendicular to the footprint of the X-ray beam on the sample surface, termed the vertical tilt in this paper. The acquisition of maps of the vertical tilt is described in the following section and in the Experimental details. The clear systematic distortion of the quantum well apparent in Fig. 1(e) immediately indicates that the devices are distorted by their electrodes. The structural effects leading to this distortion, the quantitative relationship between the lattice tilts and the residual stress in the electrodes, and the effects of the distortion on the device are discussed in detail in section “Results”.
Measurement of gate-induced distortion
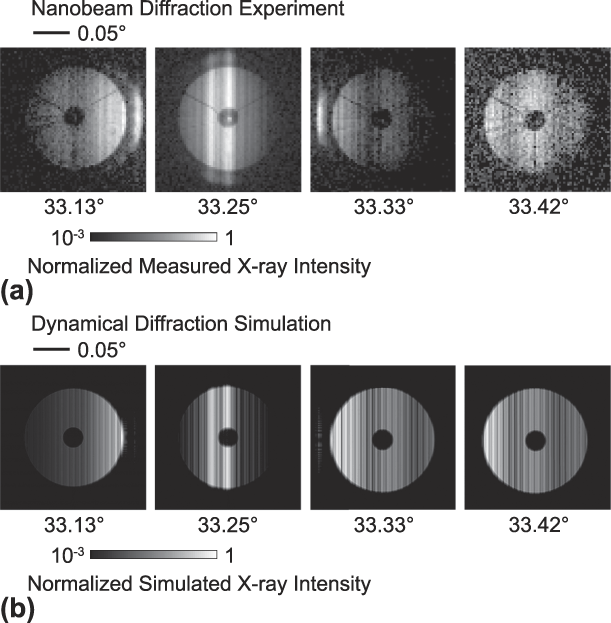
Nanobeam diffraction experiments yield complex distributions of scattered intensity that must be interpreted carefully to identify the intensity features appearing in each diffraction pattern unambiguously [Reference Pateras, Park, Ahn, Holt, Kim, Mawst and Evans20, Reference Tilka, Park, Ahn, Pateras, Sampson, Savage, Prance, Simmons, Coppersmith, Eriksson, Lagally, Holt and Evans21]. Figure 2(a) shows diffraction patterns acquired at a series of values of the X-ray incidence angle θ. As described in the Experimental details, each diffraction pattern exhibits a disk-shaped distribution of scattered intensity with an angular width corresponding to the convergence angle of the focused X-ray beam. The center of each diffraction pattern has an angular region of low intensity arising from the shadow of the order-sorting aperture (OSA) within the cone of focused incident radiation. The vertical line of high intensity at the center of the diffraction pattern at θ = 33.25° in Fig. 2(a) arises from the 004 Bragg reflection of the GaAs substrate. The bright line of intensity to the left of the substrate reflection, at a lower 2θ angle, corresponds to the 004 reflection of the GaAs/AlGaAs SL. The thin AlGaAs layers give rise to broad angular thickness fringes in the experimental diffraction patterns in Fig. 2(a) with a spacing of 0.13°. The angles at which the signals appear, their relative intensities, and their angular widths are not reproduced by the kinematical theory of X-ray diffraction, but can be accurately modeled using dynamical diffraction [Reference Pateras, Park, Ahn, Holt, Kim, Mawst and Evans20].
(a) Measured and (b) simulated diffraction patterns at different values of the X-ray incident angle θ. The 2θ scattering angle spans the horizontal direction, increasing from left to right.

The nanobeam dynamical simulation predicts diffraction patterns that exhibit X-ray reflections and intensity fringes matching the experimental observations. Predicted diffraction patterns for the same incident angles as the experimental diffraction patterns are shown in Fig. 2(b). The simulation reproduces the angles and angular widths of the thickness fringes originating from the AlGaAs layers above the 2DEG, which indicates that the correct lattice parameters and layers thicknesses are included in the modeling. The experimentally measured fringe spacing corresponds to a total thickness of 82 nm for the two top AlGaAs layers above the 2DEG, in good agreement with the 85 nm designed thickness. The agreement between the predicted and observed diffraction patterns shows that the simulation can be used to uniquely associate key features in the diffraction patterns with variations in the component layers of the heterostructure. The simulations thus allow a detailed interpretation of the diffraction results, including the analysis of the tilt of the crystal lattice within the AlGaAs layer described below.
The distortion of the AlGaAs layers above the 2DEG was measured using the tilt toward the vertical direction (i.e., along the [010] direction) of the lattice planes, as imaged in Fig. 1(e). These vertical tilts correspond to a rotation of the crystallographic planes toward the top or bottom of the image. The AlGaAs layers above the 2DEG are the components of the heterostructure that are nearest to the metal/semiconductor interface of the gate, where the stress reaches its maximum value. The map in Fig. 1(e) was acquired at θ = 33.6°, 0.35° greater than the GaAs 004 Bragg angle and spanned the area within the dashed outline in Fig. 1(d). The highest values for the lattice tilts are observed near the wide diagonally oriented electrodes, with a distribution of orientations over approximately 0.01° centered at the average orientation. However, the rapid spatial variation of the tilt arises from the complex lattice distortion imparted from the electrodes.
Results
As is apparent from the tilt map shown in Fig. 1(e), the scanning nanobeam diffraction measurement reveals a distortion of the lattice within the multi-dot device. We have taken an experimental approach based on understanding the contributions of individual electrodes to the observed tilts, followed by considering the complexity introduced by the presence of multiple electrodes. In the analysis of the individual electrodes, the value of the residual stress was calculated by comparing the experimentally extracted lattice tilt with a mechanical model of the distortion. A key result of the consideration of the single electrode is that the average value of residual stress varies by more than 20% along sub-micrometer lengths of the metallic electrodes. The variation shows that the residual stress and the induced lattice distortions are spatially heterogeneous in electrodes, complicating the prediction of stresses in the complete device.
Electrode residual stress and stress variation
The residual stress imposed by the electrodes was characterized in a series of measurements of electrode patterns of increasing complexity. The measurement of the magnitude of the residual stress and the basic effects of the electrode-induced distortion in isolated linear electrodes enabled a subsequent understanding of the more complex multiple-quantum-dot device. The linear electrodes were particularly advantageous for understanding the basic effects underpinning electrode-induced distortions because the results can be interpreted using analytical models. The characterization of the electrode-induced distortion near a linear electrode consisted of two steps. First, a measurement of the tilt near an isolated 275-nm-wide electrode allowed the value of the residual stress to be determined. The tilt and strain were then predicted at arbitrary locations within the device and for arbitrary electrode widths using a mechanical simulation incorporating this value of the residual stress.
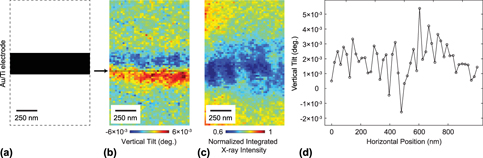
The tilt of the AlGaAs planes in the vertical direction, i.e., toward the top or bottom of the image, was measured using a horizontally oriented electrode, as shown in Fig. 3(a). In this configuration, the bending arising from the residual stress within the electrode is primarily in the vertical direction, matching the sensitivity of the measurement to tilts in this scattering geometry. Figure 3(b) shows the depth-averaged lattice tilt within the volume of the top AlGaAs thin layers in which the magnitude of the tilt reaches values up to 6 × 10⁻³ °.
(a) Schematic of a horizontal 275-nm-wide Au/Ti electrode. (b) Map of the depth-averaged vertical tilt of the AlGaAs lattice obtained by recording the intensity of the 2θ = 66.7° thickness fringe of the AlGaAs layers as a function of the position of the X-ray nanobeam. (c) Map of the integrated diffracted intensity of the AlGaAs thickness fringe between 2θ = 66.64° and 2θ = 66.77° in the region near the electrode. (d) Variation of the vertical tilt as a function of position along the line indicated by the arrow in (b).

The variation of the vertical tilt as a function of the distance from the electrode results in a large change of the diffracted intensity in the region near the electrode, as illustrated in Fig. 3(c). Figure 3(c) shows a map of the integrated intensity from the thickness fringe appearing at 2θ = 66.7° in Fig. 1(c), which arises from the AlGaAs layers. The map in Fig. 3(c) shows that lattice distortions exist in the vicinity of the electrodes and extend with a magnitude larger than the precision of the measurement for a distance of at least 1 μm. A comparison of the computed strain with the tilts plotted in Fig. 3(b) shows that the lattice tilts reach maxima near the electrode edges. The large intensity variation near the edges of the electrode in Fig. 3(c) has been previously observed and can be attributed to the strain gradient within the volume underneath the electrodes that change the effective angle of incidence of the X-ray nanobeam with respect to the lattice planes [Reference Pateras, Park, Ahn, Tilka, Holt, Reichl, Wegscheider, Baart, Dehollain, Mukhopadhyay, Vandersypen and Evans13].
The magnitude of the vertical tilts varies along the length of the linear electrodes. The variation of the tilt is apparent in effect as differences in the vertical tilt at different positions along the horizontal direction of the tilt image in Fig. 3(b). There is a spatial heterogeneity of the measured lattice tilt along the length of the metallic gate observed in the positive–negative tilt distribution instead of a symmetric, spatially invariant distribution of tilts one would expect along the length electrode with a fixed value of the residual stress at all positions along its length. The variation of the tilt along the length of the electrode at a distance of 100 nm from its center is shown in Fig. 3(d). The magnitude of the tilt varies several millidegrees around its mean value of 2 × 10⁻³ °. As indicated below, the tilt depends on the electrode stress and on the distance between the location of each measurement and the edge of the electrode.
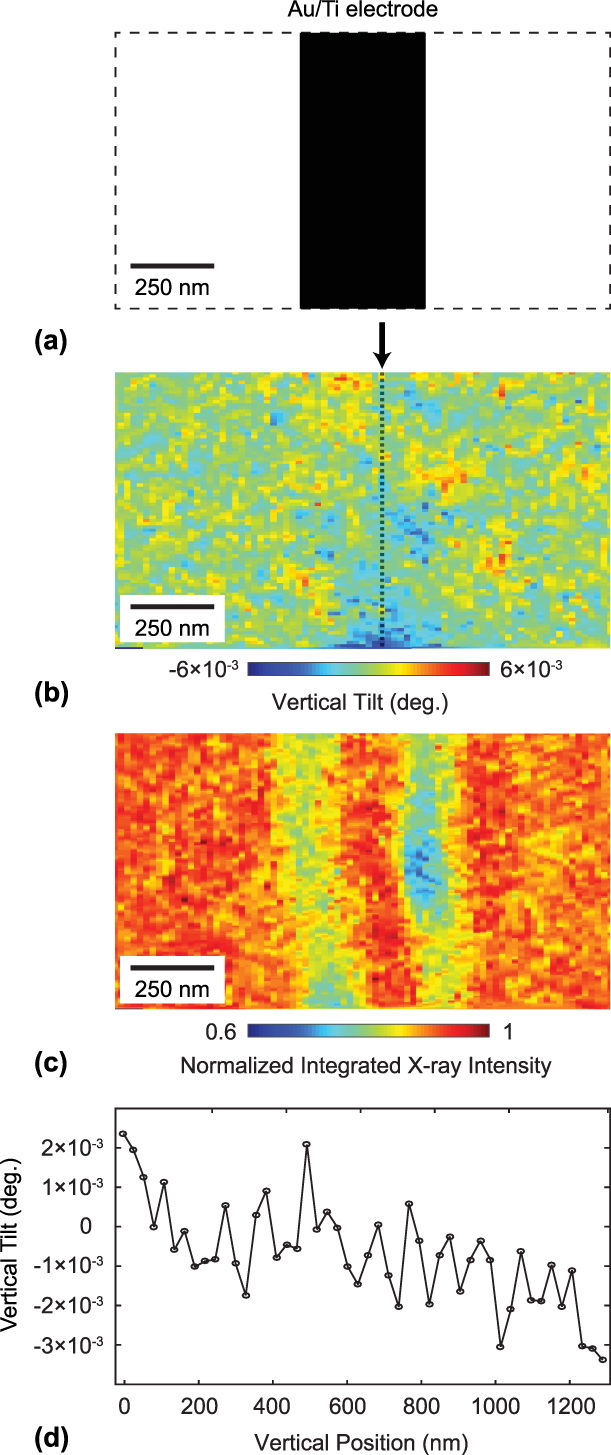
A complementary picture of the variation of the residual stress along the length of the electrode can be gained by examining the vertical tilts along vertically oriented electrodes. The orientation of a vertical electrode is shown in Fig. 4(a). The tilt along the vertical direction near a vertically oriented electrode would be precisely zero in the case of a uniform stress due to symmetry considerations. Instead, the map of the vertical tilt near a vertical electrode in Fig. 4(b) shows a large variation of the vertical tilt along the electrode. The integrated diffracted intensity in the same area is shown in Fig. 4(c) and exhibits a variation of intensity due to the overall, primarily horizontal tilt.
(a) Schematic of a vertical 400-nm-wide Au/Ti electrode. (b) Map of the depth-averaged tilt along the normal to the beam footprint direction from the top AlGaAs layers. (c) Integrated intensity of the AlGaAs thickness fringe between 2θ = 66.64° and 2θ = 66.77° near the electrode. (d) Variation of the vertical tilt along the line indicated in (b).

The key aspect of the measurement of the vertical tilts near the vertical electrode is that areas of the AlGaAs layer imaged in Fig. 4(b) have vertical tilts of up to 6 × 10⁻³ °, which is comparable to the total angular tilt observed around the horizontal electrodes. The variation of the vertical tilt along a line 100 nm from the center of the electrode is shown in Fig. 4(d). The tilts along the line shown in Fig. 4(d) vary on the order of 1 × 10⁻³ ° over distances of 100 nm. Qualitatively, the variation of the vertical tilts along the vertical electrode provides direct evidence that the stress is not uniform along the length of the electrodes. The magnitude of the variation is interpreted below in terms of the magnitude of the strain variation that is induced in the quantum dot devices.
Magnitude of residual stress and predicted strain at the 2DEG depth
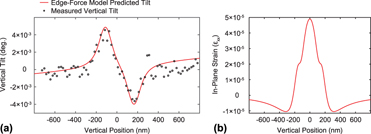
The lattice tilts induced by the electrodes can be quantitatively interpreted by comparing the experimental results with predictions derived from an elastic model of the effect of the stress imparted on the GaAs/AlGaAs heterostructure by the gates. The magnitude of the predicted tilt depends on the residual stress in the electrodes. The comparison of the model and the data thus allows the residual stress in the electrodes to be determined. The average vertical tilt within a region in Fig. 3(b) with a width of 51 nm is plotted in Fig. 5(a) as a function of the distance from the center line of the electrode.
(a) Vertical tilt as a function of the distance from the center of the electrode from the X-ray nanobeam measurement (points). Tilt simulated for a residual stress of 28 MPa using the edge-force mechanical model (line). (b) Prediction of the in-plane strain εxx around the 275-nm-wide Au/Ti electrode at the depth of the GaAs/AlGaAs interface, 90 nm below the surface of the heterostructure.

The spatial variation of the tilt near the electrodes was predicted by the edge-force model, in which the strain near a linear electrode is described analytically in a construction in which the total force is concentrated at the edges of the metallic gates [Reference Blech and Meieran22]. The edge-force model assumes that the residual stress is transferred elastically through the metal/semiconductor interface from the gate to the thin layers underneath. The analytical model gives the lattice displacement along the z direction, termed u, as a function of depth z below the surface and distance d from the center of the electrode. The tilt of the lattice is given by the derivative of the displacement with respect to z [Reference Blech and Meieran22]:
 $${{\partial u} \over {\partial z}} = 2Sz\left\{ {\left( {AB - C} \right)\left[ {{1 \over {r_2^2\left( 0 \right)}} - {1 \over {r_1^2\left( 0 \right)}}} \right] + 2A\left[ {{{d_2^2} \over {r_2^4\left( 0 \right)}} - {{d_1^2} \over {r_1^4\left( 0 \right)}}} \right]} \right\}\quad ,$$
Here, S = σt is the force per unit length, σ is the stress that transfers through the metal/semiconductor interface, t is the thickness of the metallic gate, d 1 and d 2 are the distances of the point at which the tilt is evaluated from the gate edges, and r 1(0) and r 2(0) are the distances from the point at which the tilt is evaluated to the nearest points on the gate edges. The parameters A, B, and C depend on the Poisson’s ratio ν and Young’s modulus E:
 $$A = {{\left( {1 + \nu } \right)} \over {2\pi E}}\quad ,$$
 $$B = 3 - 4\nu \quad ,$$
 $$C = {{\left( {1 + \nu } \right)\left( {1 - 2\nu } \right)} \over {2\pi E}}\quad .$$
The heterostructure layer was approximated as an isotropic elastic medium with E = 84.7 GPa, matching the value for AlxGa1−xAs with x = 0.31 [Reference Gehrsitz, Sigg, Herres, Bachem, Kohler and Reinhart23]. This approximation applies because 95% of the material between the 2DEG interface and the electrode consists of Al0.3Ga0.7As. The parameters describing the width of the electrode and the magnitude of the residual stress in the model were tuned to fit the experimental curve. To compare the experimentally measured tilts with values calculated using the edge-force model, the results of the simulation were convolved with the Gaussian intensity profile of the focused X-ray beam. The lattice tilts shown in Fig. 5(a) are plotted for an electrode width of 275 nm and residual stress of 28 MPa. Since the strain inside the semiconducting layers is tensile, the residual stress is expected to be compressive in the metallic gates (−28 MPa).
The origin of the variation of the electrode stress is likely linked to the experimental procedure used to fabricate the electrodes. As the initially deposited electrodes are deposited, grains form, and stress develops at the grain boundaries between neighboring crystallites of various shapes and preferential orientations [Reference Chaudhari16, Reference Chason, Sheldon, Freund, Floro and Hearne24, Reference Floro, Hearne, Hunter, Kotula, Chason, Seel and Thompson25, Reference Nix and Clemens26, Reference Freund and Suresh27]. The stress induced by the metallic gates can vary as a function of several interdependent parameters, such as the temperature during growth, the metal grain size, background pressure during deposition, and deposition rate [Reference Flinn, Gardner and Nix28, Reference Hodge, Bidstrup-Allen and Kohl29, Reference Dong, Cui, Wang, Zhu, Jin and Xu30]. The residual stress in 360-nm-thick, as-deposited Au films grown by electron beam evaporation on SiO2 substrates, for example, was found to be tensile with values of 90 MPa [Reference Zhou, Wu and Shao31]. Annealing increased the residual stress, with higher annealing temperatures leading to higher values of residual stress up to 300 MPa [Reference Zhou, Wu and Shao31]. In the case of unannealed films, stress relaxation and values of tensile residual stress as low as to 50 MPa were reported [Reference Zhou, Wu and Shao31]. Similar considerations likely apply to the metal films employed in the quantum dot electrodes. The variation of the tilts along a single electrode, as apparent in Figs. 3 and 4, shows that the uncertainty in empirically estimating the electrode stress also extends to the nanometer scale within a single device structure.
The results of the edge-force model were used to calculate the in-plane strain distribution laterally in the vicinity of the electrode and as a function of the depth inside the semiconducting layers. The in-plane strain εxx calculated at the 2DEG depth using the experimentally determined residual stress is shown as a function of the distance from the center line of the horizontal electrode is shown in Fig. 5(b). A positive in-plane strain indicates that the lattice has a larger in-plane lattice parameter at that location, corresponding to a tensile strain. The predicted in-plane strain is 5 × 10⁻⁵ in the most distorted region immediately below the center of the electrode. The strain rapidly varies as a function of distance, changing to compressive at distances of several hundreds of nanometers.
Distortion in multi-quantum-dot arrays
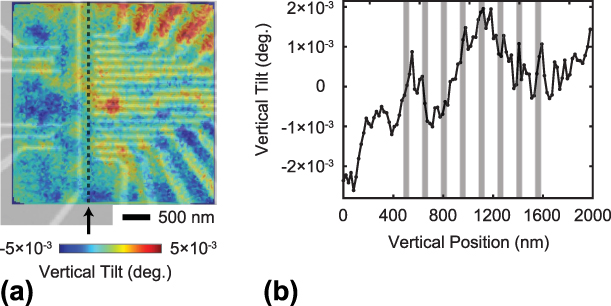
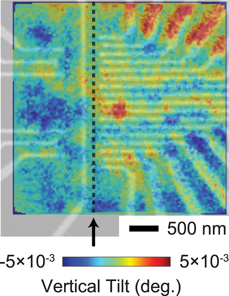
The spatial variation of the distortion induced by the electrodes is also apparent in the region of the quantum dot array. In this area, the tilts have a complex spatial distribution due to the complicated arrangement of the electrodes. Figure 6(a) shows a map of vertical lattice tilts overlaid with the SEM image of the electrodes. The relative position of the two images was determined using the vertical tilts observed at the locations of the metallic electrodes as a reference.
(a) SEM image of the quantum dot region of the linear array overlaid with the vertical tilt map obtained from the X-ray nanobeam diffraction experiment. (b) Vertical tilt in the quantum dot device along the line indicated by the arrow in (a). Gray rectangles represent the locations where the individual quantum dot regions form.

The image in Fig. 6(a) spans the precise region in which the quantum dots comprising the qubyte are located. The quantum dots are arranged along the dashed vertical line in Fig. 6(a). The distortion within the quantum dots can be probed by considering the tilt of the crystal lattice in the region in which they are formed. Figure 6(b) shows the variation of the vertical tilt along the vertical line passing through the quantum dots and indicates the locations of the quantum dots along this line. The lattice tilt profile along the line through the quantum dot array exhibits a variation of 3 × 10⁻³ ° over the region occupied by the quantum dots. The variation in the tilt arises because the quantum dots have different distances to nearby electrodes and because the strain in each electrode varies along its length. The multidot structure is a comparatively large device, that has an overall curvature induced by the total extent of the pattern, and the individual electrodes are arranged in a pattern for which the stress is more easily predicted. The tilt variation indicates that the strain in the quantum dot region varies by approximately the same amount as in Fig. 5(b), in which the curvature gives a strain on the order of 10−5. The electronic consequences of a strain variation of this magnitude are discussed below.
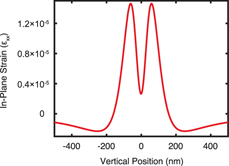
A complementary prediction of the strain within the quantum dot array was obtained by employing the edge-force model to predict the in-plane strain that develops at the GaAs/AlGaAs interface due to the finer electrodes that define the quantum dots. Note that the mechanical model prediction cannot be compared with the experimental results in this case because the spatial resolution of the X-ray nanodiffraction measurement was not sufficient to map the tilts around the individual fine electrodes. The calculation employs the value of the residual stress measured using the wider electrodes in Fig. 5(a). The dimensions of the horizontal electrodes near the quantum dots have widths of 50 nm and a thickness of 25 nm. The in-plane strain is plotted in Fig. 7 as a function of the lateral distance from the center of the electrode. As was illustrated for the wider electrode, the strain at the depth of the 2DEG is tensile underneath the gate. The strain becomes compressive the further away from the edges of the electrode. The predicted variation of the strain around each gate in Fig. 7 is on the order of 10−5. This variation of the strain is similar to the value estimated from the gradient of the tilts illustrated for the quantum dot array region in Fig. 6(b).
Computed in-plane strain εxx near a 50-nm-wide Ti/Au electrode at the depth of the GaAs/AlGaAs interface. The strain is calculated using the edge-force model for the 28 MPa residual stress obtained from fitting the experimental data with the model in Fig. 5(a).

Discussion and conclusions
The stress arising from the formation of electrodes has potential implications in the electronic properties of multiple-quantum-dot devices and ultimately in their design. The structural study reported here shows that there is a significant strain arising from the electrodes and furthermore that the tilt, curvature, and associated strain vary due to factors associated with materials processing.
The structural measurement of the lattice tilt within the multiple-quantum-dot device in Fig. 6(b) shows that the curvature and thus the strain are different for each of the quantum dots. Each dot thus has a different piezoelectric potential difference with respect to the electrodes and a different local value of the deformation potential than its neighbors. The variation of the tilt, and thus the tilt-induced strain, between dots is approximately equal to its total magnitude. As illustrated in Fig. 2, the induced strain is on the order of 10−5. The piezoelectric potential difference developed between electrodes and the 2DEG due to a strain of a similar magnitude is on the order of 1 mV. We thus expect that the variation between quantum dots in the potential is on the order of 1 mV. This variation can pose challenges in establishing the bias applied to the electrodes defining each quantum dot and the operating conditions of the device.
Ultimately, the manipulation of the local strain state using stress from a nanoscale pattern has the potential to provide a new degree of freedom in quantum device design. If the stress distribution can be accurately predicted and subsequently controlled through the nanolithography process, there is the potential to create devices incorporating elastic distortions in their design. Theoretical and computational studies indicate, for example, that stress from patterned layers can provide the confinement potential necessary to create quantum dots [Reference Thorbeck and Zimmerman32]. The variation of the stress along the electrodes, however, can complicate the design of devices based on employing electrode-induced stress effects.
In addition to the variation of the stress, the orientation of the gate electrodes with respect to the crystal lattice of the heterostructure will be an important issue in understanding and exploiting electrode stress. The piezoelectric coupling between the distortion and electronic energies depends on the crystallographic direction along which the stress is applied [Reference Skuras, Long, Larkin, Davies and Holland33]. Modeling the complex multiple-quantum-dot structure is thus far more complicated than the straightforward analytical model employed in this work. The exact prediction of the effective Hamiltonian can be made using three-dimensional modeling methods, which consider the stress-induced lattice distortions along with many-electron interactions [Reference Fischer, Trif, Coish and Loss34].
The further application of elastic effects in multiple-quantum-dot devices will also require understanding other potential sources of stress. The X-ray diffraction study reported here evaluated the stress and lattice deformation at room temperature. Additional stress arises from differences in the thermal expansion properties of the semiconductor and the metal electrodes. In the case of Au and GaAs, the difference of the thermal expansion coefficients acts to reduce the magnitude of the stress between low temperature and room temperature [Reference Pateras, Park, Ahn, Tilka, Holt, Reichl, Wegscheider, Baart, Dehollain, Mukhopadhyay, Vandersypen and Evans13]. A quantitative estimate for a single metal electrode indicates that the strain at low temperature is reduced by approximately a factor of two [Reference Pateras, Park, Ahn, Tilka, Holt, Reichl, Wegscheider, Baart, Dehollain, Mukhopadhyay, Vandersypen and Evans13]. Previous work in Si devices showed that when cooling to cryogenic temperatures the strain in the semiconducting layers is compressive [Reference Thorbeck and Zimmerman32]. The residual stress can act against the differential contraction due to cooling the device down to cryogenic temperatures at which the device is operated [Reference Thorbeck and Zimmerman32]. The stress could even, in principle, cancel each other by carefully choosing the type and thickness of the material used for the gate fabrication.
Experimental details
Starting from the sample surface, the layers of the GaAs/AlGaAs heterostructure are a 5-nm-thick GaAs cap, a 45-nm-thick Al0.3Ga0.7As layer, a 0.2-nm δ-layer consisting of a single atomic layer of Si between Al0.3Ga0.7As layers, 20 nm of Al0.3Ga0.7As, a 1.5-nm δ-layer, 20 nm Al0.3Ga0.7As, 500 nm of GaAs, a GaAs/AlGaAs superlattice (SL) consisting of 80 repeats of a 7-nm Al0.3Ga0.7As/3-nm GaAs unit cell, and a 400-nm-thick GaAs layer. The layer structure was grown by molecular beam epitaxy on a 450-μm-thick GaAs (001) substrate. The 2DEG forms at the GaAs/AlGaAs interface 90 nm below the surface. The nanofabricated gates are formed using a 5-nm-thick Ti adhesion layer followed by 20 nm of Au. The gates have a range of widths, with a minimum width of 40 nm. The detailed procedure for the fabrication of the metallic gates can be found in Ref. Reference Pateras, Park, Ahn, Tilka, Holt, Reichl, Wegscheider, Baart, Dehollain, Mukhopadhyay, Vandersypen and Evans13.
X-rays with a photon energy of 8 keV were focused using a Fresnel zone plate (FZP) focusing optic with 300-μm-diameter and 60-nm-wide outermost zone, as in Fig. 1(b). An 80-μm-thick center stop with 60-μm diameter was placed in front of the FZP to absorb unfocused X-ray radiation. The higher orders of focused X-ray radiation were removed using an OSA with a 50-μm diameter. The focused beam had a 150-nm full width at half maximum (FWHM) intensity distribution at the focal point, with an approximately Gaussian profile and an angular divergence δ = 0.14°. A two-dimensional pixel-array detector (ESRF Maxipix) was placed at a distance of 1.08 m from the center of rotation. The detector consists of a square arrangement of 512 × 512 pixels with 55 × 55 μm2 area each. The incident angle θ of the focused X-ray nanobeam and scattering angle 2θ are defined with respect to the ray of X-rays passing through the center of the FZP. The angular axes of the diffraction patterns correspond to the two angular directions of the Bragg geometry of the experiment. The horizontal and vertical axes of the diffraction patterns are spanned by the angles 2θ and χ, respectively. The angle χ varies in a direction approximately normal to the scattering plane. The lattice constant of bulk GaAs, a GaAs = 5.653 Å, was used to calibrate the absolute detector 2θ angle.
The intensity in the θ/2θ scan shown in Fig. 1(c) was extracted by integrating a narrow angular range of the two-dimensional diffraction pattern acquired at each incident angular setting of the convergent focused X-ray beam. The integrated angular region of the detector had a width of 0.003° along 2θ and 0.131° along χ, corresponding to 1 pixel and 45 pixels on the detector, respectively. For epitaxial thin films this process is analogous to the acquisition of a conventional parallel beam θ/2θ scan [Reference Tilka, Park, Ahn, Pateras, Sampson, Savage, Prance, Simmons, Coppersmith, Eriksson, Lagally, Holt and Evans21]. The high-intensity peaks at 2θ = 66.45° and 2θ = 66.5° originate from the 004 reflections of the 800-nm-thick GaAs/AlGaAs SL and the GaAs substrate. The experimental curve is normalized with respect to the maximum intensity of the GaAs 004 reflection. A good fit of the experimental and simulated θ/2θ scans is obtained for the layer thicknesses given above. The 2θ angle of the SL reflection gives an average out-of-plane lattice parameter of 5.659 Å for the 800-nm-thick GaAs/AlGaAs SL, resulting from the small difference in the lattice constants of GaAs and Al0.3Ga0.7As in the SL repeating unit. The 2θ angle of the SL reflection gives an average out-of-plane lattice parameter of 5.659 Å for the 800-nm-thick GaAs/AlGaAs SL, resulting from the small difference in the lattice constants of GaAs and Al0.3Ga0.7As in the SL repeating unit. The measured value of the Al0.3Ga0.7 lattice constant is slightly larger than its unstressed value because the AlGaAs layers are under stress due to heteroepitaxy on the GaAs substrate.
The beam footprint orientation with respect to the electrode pattern was selected to facilitate a measurement of the vertical tilt by having the narrow dimension of the beam illuminate the space between the long edges of the metallic electrodes. The in-plane component of the incident X-ray beam was along the [100] direction, which is along the horizontal direction in Figs. 1(d) and 1(e).
The distribution of diffracted X-ray intensity in the focused X-ray nanobeam experiment is complicated because of the angular divergence of the focused beam and because diffraction from the GaAs/AlGaAs SL and GaAs substrate must be considered using the dynamical theory of X-ray diffraction. The use of the dynamical theory of X-ray diffraction is necessary because AlGaAs and GaAs components of the heterostructure have a lattice mismatch of only 4 × 10⁻⁴. The diffracted intensity from the thin AlGaAs layers at the top of the heterostructure thus appears in an angular range that also includes the intensity from the GaAs substrate, which the kinematical theory cannot quantitatively predict. The scattered X-ray wavefield from the substrate interferes coherently with the X-ray wavefield scattered from the AlGaAs layers, leading to a complex intensity distribution. The dynamical diffraction theory accurately predicts diffraction from crystals with thicknesses larger than the X-ray extinction depth and accounts for effects such as multiple scattering, primary extinction, refraction, and absorption [Reference Pateras, Park, Ahn, Holt, Kim, Mawst and Evans20, Reference Shabalin, Yefanov, Nosik, Bushuev and Vartanyants35]. The X-ray intensity distribution in the nanobeam diffraction patterns was predicted by computing the incident X-ray wavefield at the focal spot using an optical simulation method, computing the diffracted wavefield using the Darwin dynamical theory of X-ray diffraction, and propagating the diffracted wavefield to the detector [Reference Pateras, Park, Ahn, Holt, Kim, Mawst and Evans20, Reference Ying, Osting, Noyan, Murray, Holt and Maser36].
In other nanobeam diffraction studies, the wavefront at the X-ray focal spot is often retrieved using ptychographic algorithms [Reference Hönig, Hoppe, Patommel, Schropp, Stephan, Schöder, Burghammer and Schroer37]. It is not possible at present, however, to use ptychography to retrieve the focused beam amplitude and phase from diffraction patterns that include dynamical effects. We found that in this case the more idealized focal spot intensity and phase distribution predicted using an optical calculation is a useful approach in describing the diffraction patterns [Reference Tilka, Park, Ahn, Pateras, Sampson, Savage, Prance, Simmons, Coppersmith, Eriksson, Lagally, Holt and Evans21, Reference Ying, Osting, Noyan, Murray, Holt and Maser36]. The amplitude and phase of the focused X-ray beam in our calculation were thus determined using an optical simulation method using the experimental parameters given above [Reference Ying, Osting, Noyan, Murray, Holt and Maser36, Reference Goodman38].
The X-ray measurements provide the depth-averaged tilt in the top three AlGaAs layers measured using the angular shift of the thickness fringe feature at 2θ = 66.7°, which originates from these layers. The signal from the top three AlGaAs overlayers contains the clearest structural signatures of the tilts and lattice distortions. The tilt was experimentally mapped by setting the X-ray incidence angle θ to a fixed value and acquiring an array of diffraction patterns within a grid on the sample surface. The angular setting was selected so that the thickness fringe from the AlGaAs layers in the angular range between 2θ = 66.64° and 2θ = 66.77° appeared in the diffraction patterns. At each point in the map, the vertical tilt of the lattice was measured by determining the angular shift Δχ along the vertical direction of the diffraction pattern of the thickness fringe at 2θ = 66.7°. In the scattering geometry used in this experiment, the corresponding vertical tilt of the lattice is Δχ/(2 sin θB), where θB corresponds to the Bragg angle of the GaAs 004 reflection [Reference Park, Ahn, Tilka, Sampson, Savage, Prance, Simmons, Lagally, Coppersmith, Eriksson, Holt and Evans12, Reference Pateras, Park, Ahn, Tilka, Holt, Reichl, Wegscheider, Baart, Dehollain, Mukhopadhyay, Vandersypen and Evans13]. The dependence on the Bragg angle arises from the requirement that the change in the X-ray momentum must match both the direction and magnitude of the scattering vector.
Acknowledgments
A.P. and P.G.E. acknowledge support from the U.S. DOE, Basic Energy Sciences, Materials Sciences and Engineering, under contract no. DE-FG02-04ER46147 for the X-ray scattering studies and analysis. Work at TU Delft was supported by The Netherlands Organization of Scientific Research (NWO).