





Most adults in the UK consume too much fat (82 %), salt (70 %) and sugar (81 %)(1,2) . UK adults also struggle with comfort eating(Reference Marwood, Radley and Evans3), defined as eating induced by negative emotions(Reference Gibson4). One out of six adults comfort eat often(Reference Sze, Donkor and Yang5). Unlike eating induced by positive emotions, comfort eating predicts weight gain and difficulties in achieving weight loss(Reference Frayn and Knäuper6). The health costs of inadequate diet quality and comfort eating are numerous, including cardiovascular disease, cancer and type 2 diabetes(Reference Morze, Danielewicz and Hoffmann7). Understanding the psychological mechanisms underpinning low diet quality and comfort eating is therefore critical for improving health in the UK population.
Multiple psychological theories describe motivations for comfort eating and low diet quality(Reference Klatzkin, Nolan and Chaudhry8); however, expectancy theory uniquely explains a cognitive mechanism that causes people to continue these behaviours once learnt(Reference Roberts, Ince and Neubeck9). Expectancy theory proposes that, through earlier social and personal learning, adults have memories regarding outcomes of a behaviour; these ‘expectancies’ influence future behaviour(Reference Goldman, Del Boca and Darkes10–Reference Bandura and Walters12). Food-related emotional expectancies – anticipated emotional outcomes of consuming food and non-alcoholic beverages (hereafter, referred to as foods) – would impact eating(Reference Cummings, Hoover and Turner13). For example, after receiving ice cream as a child from parents after they fight, a person may expect ice cream to bring happiness, leading to greater intake of ice cream throughout his or her life. In an experiment, increasing positive food expectancies led to greater energy intake(Reference Cummings, Hoover and Turner13), which supports expectancy theory’s application to the domain of eating.
Although expectancies form through early learning(Reference Smit, Voogt and Hiemstra14), they are malleable in adulthood. Environment factors including cues in pubs and restaurants(Reference Cummings, Hoover and Turner13,Reference Wall, McKee and Hinson15) and advertising exposures(Reference Cummings, Hoover and Gearhardt16) can temporarily increase positive expectancies and subsequently impact behaviours. Behavioural programmes in which individuals receive feedback about their behaviour that counters their positive expectancies, known as ‘expectancy challenge,’ are also effective(Reference Gesualdo and Pinquart17,Reference Coates, Gullo and Feeney18) . Professionals can deliver expectancy challenge in group settings or individually with patients, and meta-analysis indicates that, in the domain of substance use, even a 1-hr session reliably decreases positive expectancies and changes behaviour for at least one month(Reference Gesualdo and Pinquart17). However, there is no existing intervention that targets modification of food-related emotional expectancies.
It is unknown which food-related emotional expectancies to target modification of in UK adults. Interventions should focus on expectancies that are prevalent and predictive of worse health(Reference Gesualdo and Pinquart17,Reference Coates, Gullo and Feeney18) . Nearly half of energy consumed in the UK is from consumption of high fat, salt, and/or sugar foods (HFSS)(Reference Kesaite, Chavez-Ugalde and White19), so positive HFSS expectancies are likely prevalent. Greater positive HFSS expectancies have been linked with lower diet quality and more frequent comfort eating in the USA and Australia, countries with similar food supplies to the UK(Reference Cummings, Joyner and Gearhardt20–Reference Wu, Vartanian and Faasse22).
Promotions for food products and their associated brands have also long dominated UK television and online advertising(23,24) . Regulations were implemented in January 2026,(25) but the effectiveness of these rules is not yet known(Reference Harris, Boyland and Muc26,Reference Forde, Boyland and Scarborough27) . Marketing often pairs emotionally powerful themes (e.g. family love and social acceptance) with messages about food enjoyment to generate positive feelings that are subsequently applied to the object (i.e. the branded food)(Reference Harris, Brownell and Bargh28). This may encourage social learning that branded foods increase positive emotions(Reference Cummings, Hoover and Gearhardt16). Although food brand exposures consistently elicit brain responses in areas responsible for emotional processing(Reference Boyland, Maden and Coates29), expectancies for branded foods have not been previously studied.
In a qualitative study, UK adults living with overweight or obesity generated a list of foods they had strong expectancies about and the majority were HFSS such as fast foods, sweets, savoury snacks and non-alcoholic beverages(Reference Roberts, Ince and Neubeck9). To a lesser extent, participants spoke of expectancies for non-HFSS such as traditional and cultural meals, fruit and vegetables. Participants were not asked which branded foods they had expectancies about, though a few were mentioned (e.g. Domino’s pizza). Building upon the qualitative research, the present study was the first quantitative study of food-related emotional expectancies in the UK. The primary aims of the present research were to identify foods UK adults most expected to bring positive emotions and to test influences of HFSS and branding on positive expectancies. Previous work has demonstrated that HFSS and branding can independently elicit positive emotions(Reference Spinelli, Masi and Zoboli30). We therefore hypothesised UK adults would have the strongest positive expectancies for branded HFSS (e.g. Cadbury Twirl chocolate) v. generic non-HFSS (e.g. prawn curry). The secondary aim was to examine associations of positive and negative expectancies for individual foods with diet quality and comfort eating in UK adults. In accordance with expectancy theory and prior research(Reference Cummings, Joyner and Gearhardt20–Reference Wu, Vartanian and Faasse22), we hypothesised greater positive expectancies for individual HFSS would be associated with worse diet quality and more frequent comfort eating. Given mixed findings from previous research(Reference Cummings, Joyner and Gearhardt20–Reference Wu, Vartanian and Faasse22), we had no hypotheses regarding negative expectancies.
Methods
Design
The study was observational based on methods used to identify the top foods implicated in addictive responses(Reference Schulte, Avena and Gearhardt31). There was a within-persons aspect in which participants rated emotional expectancies for multiple foods. The study was not preregistered.
Ethical approval
This study was conducted according to the guidelines laid down in the Declaration of Helsinki, and all procedures involving participants were approved by the University of Liverpool Institution of Population Health Research Ethics Committee in May 2025 (16285). Online written informed consent was obtained from all participants.
Participants
Inclusion criteria were living in the UK, aged 18 years or older, and with fluency in English. The study was named, ‘Food-related emotional expectancies in the UK population’ and advertised via Prolific, an online crowdsourcing platform of over 200 000 active participants for research. This platform requires individuals to provide 50+ quality and identity checks, including bank-grade ID verification, before participating in studies and uses proprietary authenticity checks that detect AI-generated responses with 98·7 % precision(32). Independent research groups have demonstrated superior data quality compared with other online crowdsourcing platforms(Reference Peer, Rothschild and Gordon33,Reference Esch, Mylonopoulos and Theoharakis34) . Prolific advertised the study to individuals located in the UK, representatively distributing advertisements based on census data for sex, age and race/ethnicity. Recruitment began and ended on 6 June 2025, after 1287 individuals followed the study link. Some individuals did not complete the screening questions (n 5), provide consent (n 12), nor complete the study (n 45). Where reCAPTCHA scores were < 0·5 (n 22), we removed responses to improve data integrity(Reference Bonett, Lin and Sexton Topper35). The total sample size for statistical analysis was 1203.
Materials
Food images
We selected food images from the Restrain Food Database, an open-source database including items relevant to the UK population that range in nutrient profiling and branding(Reference Randle, Duarte and Maizey36). The database includes 626 foods with standardised images (i.e. jpeg format, 400 × 400 pixels, foods presented at same angles against a white background or filled the frame). Random subsamples (ns=39–45) of a UK adult sample (n 2150; M age = 42 years; 59 % women; 82 % white) previously rated most images on quality (i.e. ‘How positive do you rate the image?’) and liking of the taste (i.e. ‘How strongly do you like the taste of this food?’) using 100-point visual analogue scales (1 = ‘Very negative’/‘Not at all’, 100 = ‘Very positive’/‘Extremely’)(Reference Randle, Duarte and Maizey36). We sought two images from each food category mentioned by UK adults in the qualitative study of food-related emotional expectancies(Reference Roberts, Ince and Neubeck9): fast food (e.g. burger), sweets (e.g. chocolate), savoury snacks (e.g. crisps), non-alcoholic beverages (e.g. fizzy drink), traditional meals (e.g. roast dinner), cultural meals (e.g. curry), fruit (e.g. apple) and vegetables (e.g. salad). Given that mostly HFSS were mentioned(Reference Roberts, Ince and Neubeck9), we sought another two images from the fast food, sweets, savoury snacks and non-alcoholic beverage categories. We then sought as many branded counterparts as possible (e.g. Burger King Angus XT Burger) that were available in the Restrain Food Database. As this database did not have non-alcoholic beverage images, we selected those images from the Freepik(37) and Coca-Cola(38) websites. Figure 1 shows the selected thirty-six images of foods along with (where available) the previously collected image quality and liking of taste ratings(Reference Randle, Duarte and Maizey36).
Selected images of food and non-alcoholic beverages. Images are from the Restrain Food Database, Freepik website and Coca-Cola website. Images are shown with (where available) the previously collected image quality and taste ratings.

Figure 1. Long description
The table presents a comparison of image and taste ratings for various food and drink items. It includes images of each item along with their respective ratings. The table is organized into multiple rows and columns, with each row representing a different food or drink item. The columns are labeled ‘Item name’, ‘Image rating’, and ‘Taste rating’. Each row lists the item name followed by its image rating and taste rating. The items include water, apple, burger, Burger King Angus XT Burger, cake, Viennetta Vanilla Cake, carrots, cheese, Babybel Cheese, Cheese Puffs, Cheetos Cheese Puffs, chicken curry, chicken wings, KFC Chicken Wings, chocolate, Cadbury Twirl Chocolate, crisps, Walkers Ready Salted Crisps, digestives, McVitie’s Caramels Digestives, fizzy drink, Coca-Cola Fizzy Drink, fruit gums, Haribo Starmix Fruit Gums, ice cream sundae, McDonald’s Ice Cream Sundae, orange juice, pizza, Domino’s Pizza, prawn curry, roast dinner, salad, sausage roll, shepherd’s pie, strawberries, and tea. The ratings are numerical values indicating the perceived quality of the image and the taste of each item.
Anticipated Effects of Food Scale-Brief(Reference Cummings, Treharne and Vainik21)
The Anticipated Effects of Food Scale-Brief is a shortened version of the Anticipated Effects of Food Scale(Reference Cummings, Joyner and Gearhardt20), a self-report questionnaire assessing food-related emotional expectancies. Respondents are typically asked to imagine eating HFSS or fruit and vegetables in general and then rate how much they expect to feel positive and negative emotions while consuming. Items include ‘cheerful,’ ‘comforted,’ ‘excited,’ ‘happy,’ ‘refreshed,’ ‘relaxed,’ ‘relieved,’ ‘anxious,’ ‘bored,’ ‘depressed,’ ‘down,’ ‘frustrated,’ ‘numb’ and ‘tired,’ and are rated on a six-point Likert Scale from 1 (‘Definitely not’) to 6 (‘Definitely’). In the present study, instead of imagining eating HFSS or fruit and vegetables in general, participants were asked to imagine consuming the specific food shown with the food name provided. We scored positive and negative expectancies by averaging ratings of the positive and negative emotion items, respectively, for each food. Internal consistency was very good for positive (Cronbach’s α = 93–·97) and negative (Cronbach’s α = 90–·96) expectancy scores, which indicates that the seven positive and seven negative items measured the same general positive and negative expectancies, respectively.
Short-form Food Frequency Questionnaire(Reference Cleghorn, Harrison and Ransley39)
The Short-form Food Frequency Questionnaire is a twenty-item self-report questionnaire assessing diet quality in UK adults. Respondents select the frequency they have eaten different foods, including HFSS, fruit, vegetables, fibre-rich foods, meat, meat products and fish, during a typical week over the past month. Options range from ‘rarely or never’ to ‘5 or more times a day.’ We entered responses into the publicly available Excel scoring spreadsheet available as Supplemental Materials to the publication describing the measure(Reference Cleghorn, Harrison and Ransley39). The spreadsheet uses macros to automatically calculate diet quality scores based on the estimated amount of fruit, vegetables, oily fish, fat and non-milk extrinsic sugar intake. The spreadsheet estimated these amounts by multiplying the standard portion sizes for fruit, vegetables and oily fish with daily frequency reported and by multiplying the standard food composition of fat and non-milk extrinsic sugar intake for all items with daily frequency reported. In accordance with the development of the Short-form Food Frequency Questionnaire(Reference Cleghorn, Harrison and Ransley39), scores were assigned based on how well the amounts met UK dietary recommendations, starting from 5 and going up to 15 (‘optimum diet quality’). The Short-form Food Frequency Questionnaire has demonstrated convergent validity with a 217-item FFQ(Reference Cleghorn, Harrison and Ransley39).
Comfort eating
To reduce the length of the survey, we chose a single item measure of comfort eating(Reference Cummings, Mason and Puterman40); there have been large correlations between responses to this item and responses on a longer measure, the Emotional Eating subscale of the Dutch Eating Behavior Questionnaire(Reference Van Strien, Frijters and Bergers41), providing evidence of the item’s convergent validity. The item reads, ‘Because of all the demands of work, home, family or friends, we all feel stressed at times. The following questions ask about things you are most likely to do after having what you think is a stressful event or day…how often do you eat more than normal to help make it easier to bear?’ Respondents rated on a five-point Likert scale from 1 (‘Never’) to 5 (‘Very often’).
Socio-demographic background
Respondents reported if they were on a special type of diet or had any dietary restrictions, if they were currently dieting for weight loss, and if they currently had or had history of an eating disorder. They also reported their age, height, weight, gender identity, race/ethnicity and the highest level of qualifications achieved by their parent/guardian(s) by the time they were age 18, and the highest level of qualifications achieved by themselves or spouses currently. We calculated BMI from height and weight using the standard formula (kg/m2).
Procedure
Individuals followed the study link to the online survey platform, Qualtrics, where they answered screening questions and viewed the participant information sheet and consent form. Only if they met the inclusion criteria and provided consent did individuals continue in the survey. Participants rated their hunger on a visual analogue scale from 1 (‘Not hungry at all’) to 100 (‘Extremely hungry’) before viewing a semi-random selection of eighteen of the food images in semi-random order. That is, Qualtrics presented in random order two images from fast food (burger, chicken wings, ice cream sundae and pizza); two from sweets (cake, chocolate, digestives and fruit gums); two from savoury snacks (cheese, cheese puffs, crisps and sausage roll); two from traditional and cultural meals (chicken curry, prawn curry, roast dinner and shepherd’s pie); one from fruit (apple and strawberries); one from vegetables (carrots and salad) and two from non-alcoholic beverages (fizzy drink, orange juice, tea and water). For each food with a branded counterpart, Qualtrics showed the branded and generic versions back-to-back in random order. Each participant viewed twelve generic foods and six branded food images. Overall, this led to some variety of images seen across participants while reducing burden and order effects, and while providing control for testing the influence of both HFSS and branding within each participant.
Participants answered the Anticipated Effects of Food Scale-Brief in reference to the individual food represented by the image, with positive and negative expectancy items presented in random order. After responding to each of the images, participants answered the Short-Form Food Frequency Questionnaire along with questions about comfort eating and sociodemographic background. At the end of the survey, participants viewed a debrief sheet including contact information for national eating behaviour support programmes. Participants were reimbursed for their time at a rate of £6·90 per hour (£1·15 for 10 min). On average, participants completed the study in 17·16 ± 7·80 min.
Statistical analyses and justification of sample size
We calculated means, standard deviations and frequencies for socio-demographic variables, diet quality, comfort eating and positive expectancies for individual foods. To identify the foods UK adults expected to bring positive emotions, we ranked means of the positive expectancies. To classify foods as HFSS, we used the UK 2004 to 2005 Nutrient Profiling Model, a standard scoring algorithm based on nutrient content(42). Based on the nutrient content of 100 g or mL of a food or drink, respectively, points are awarded for ‘A’ (i.e. energy, saturated fat, Na and total sugars) and ‘C’ (i.e. fruit, vegetables and nut [FVN] content, fibre and protein) nutrients. Each nutrient is scored on a scale of 0–10 (for ‘A’ nutrients) or 0–5 (for ‘C’ nutrients) points according to defined thresholds (see Table S1 in Supplementary Material). For ‘C’ nutrients, energy is scored from 0 (≤335 kJ/100 g) to 10 (>3350 kJ/100 g) points, saturated fat from 0 (≤1 g/100 g) to 10 (>10 g/100 g) points, total sugars from 0 (≤4·5 g/100 g) to 10 (>45 g/100 g) points and Na from 0 (≤90 mg/100 g) to 10 (>900 mg/100 g) points. For ‘C’ nutrients, FVN content is scored from 0 (≤40 % FVN) to 5 (>80 % FVN) points, fibre from 0 (≤0·7 g non-starch polysaccharides [NSP] or ≤0·9 g fibre including non-digestible measured by Association of Official Analytical Chemists [AOAC]/100 g) to 5 (>3·5 g NSP or >4·7 g AOAC/100 g) points, and protein from 0 (≤1·6 g/100 g) to 5 (>8·0 g/100 g) points. The total score for ‘C’ is subtracted from the total score for ‘A’ to give the nutrient profile score. If a food scores ≥11 points for ‘A’ nutrients, it cannot score points for protein unless it also achieves the maximum five points for FVN content(42). Foods scoring ≥4 points, and drinks scoring ≥1 point, are classified as HFSS. For generic items, we extracted the nutritional composition for 100 g or mL of the closest matching item available in the nutrient databank(43) from the 2018–2019 National Diet and Nutrition Survey. For branded items, we extracted the composition for 100 g or mL from the official website; where information was missing, we used National Diet and Nutrition Survey information for it or a similar item. Although we chose the HFSS classification system due to its relevance to UK policy, there is public interest in the traffic light labelling system(44) and the NOVA system for assessing processing level(Reference Monteiro, Cannon and Levy45). We thus graded foods based on traffic light labelling (grades A to E, with A superior to E) and coded level of processing based on NOVA (NOVA 1 = unprocessed or minimally processed, NOVA 2 = processed culinary ingredients and NOVA 3 = processed, NOVA 4 = ultra-processed). In applying the NOVA system, we assumed whether items were homemade and without additives. Please see Supplementary Material for all decisions made in applying each system.
To test the influence of HFSS and branding on positive expectancies, we conducted multilevel modelling, an appropriate technique for the analysis of nested data where observations are not independent (here, nesting eighteen positive expectancy ratings within individuals). We conducted model estimations in SAS 9.4 (Cary, NC) using the restricted maximum likelihood estimation approach, which minimises the potential for biased parameter estimates due to missing data. We estimated fixed effects, which are average effects across all individuals, for the main effects of HFSS (dummy coded as 0 = non-HFSS, 1 = HFSS) and branding (dummy coded as 0 = generic, 1 = branded), and for their multiplicative interaction. To correctly specify the model, we compared a model without estimation of random effects (i.e. how effects for a person differ from the average) to models with estimation of random effects for the intercept and for the slopes (i.e. main effects of HFSS and branding and their multiplicative interaction). Model fit was improved (i.e. statistically significantly smaller −2LL [Log Likelihood]) by including a random effects estimate for the main effect of HFSS but not for the main effect of branding nor for the multiplicative interaction. Assumptions of correct functional form, independent and normally distributed residuals at each level, and unrelated residuals between levels were met. In exploratory analysis, we estimated fixed effects of traffic light labelling (coded as 1 = A, 2 = B, 3 = C, 4 = D, 5 = E) and processing (coded as NOVA 1 = 1, NOVA 2 = 2, NOVA 3 = 3, NOVA 4 = 4) and random effects for intercepts and slopes, on positive expectancies in separate models.
To examine associations of food-related emotional expectancies for individual foods with diet quality and comfort eating, we conducted bivariate correlations. For all tests, we considered results statistically significant where p < ·05 and described effect sizes. Given the large number of bivariate correlations, we focused on the patterning of coefficient directions and magnitudes. Based on prior work(Reference Cummings, Treharne and Vainik21), we targeted a sample size of 1200 to provide >95 % power to detect small-to-medium effects for associations of food-related emotional expectancies with eating behaviour. The analysis plan was not preregistered.
Results
Descriptives
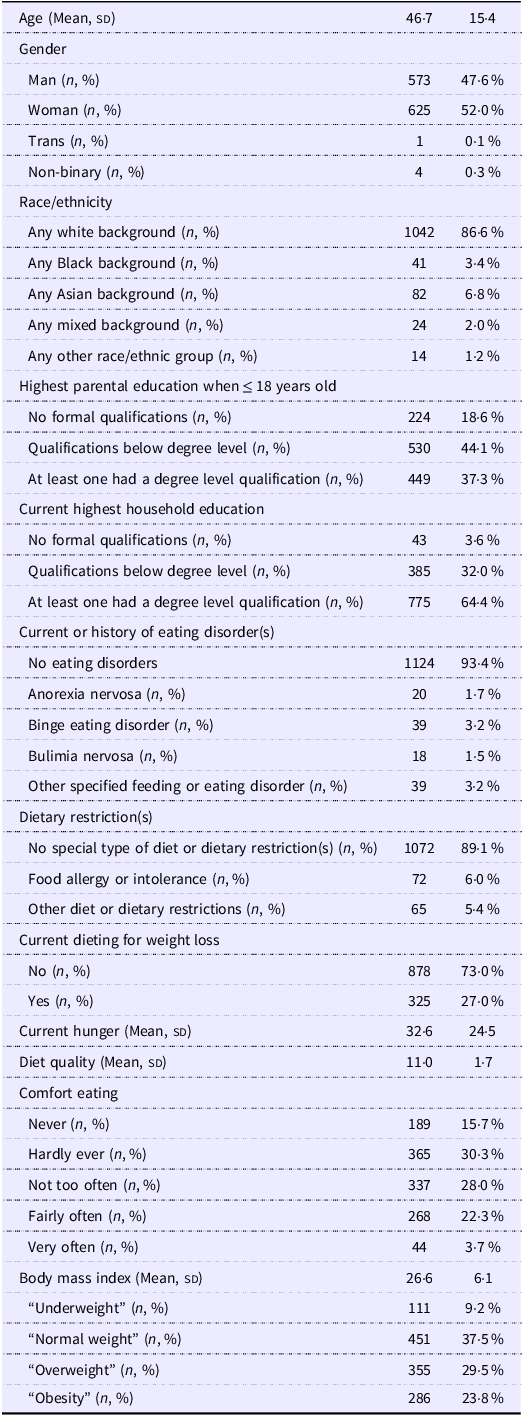
Table 1 describes the socio-demographic background of the participants. There was a wide span of ages represented, ranging from 18 to 83 years, and near equal representation between women and men. Most participants were white (86·6 %) and grew up with parents who had no formal qualifications or qualifications below the degree level (62·7 %). Currently, most had (or their partners had) a degree level qualification (64·4 %), did not have a current eating disorder nor history of this (93·4 %), had no special type of diet nor dietary restrictions (89·1 %) and were not dieting for weight loss (73·0 %). The majority had an inadequate diet quality (58·9 % with a score <12), engaged in comfort eating more frequently than ‘hardly ever’ (54·0 %) and were living with ‘overweight’ (BMI = 25–29·9 kg/m2) or ‘obesity’ (BMI = >30 kg/m2) (53·3 %).
Socio-demographic background of the sample (n 1203)

Table 1. Long description
A table detailing the socio-demographic background of 1203 participants. The table has 20 rows and 10 columns. Column headers include Age, Gender, Race/ethnicity, Highest parental education when ≤ 18 years old, Current highest household education, Current or history of eating disorder(s), Dietary restriction(s), Current dieting for weight loss, Current hunger, and Diet quality. Row labels include categories such as Age (Mean, sd), Gender (Man, Woman, Trans, Non-binary), Race/ethnicity (Any white background, Any Black background, Any Asian background, Any mixed background, Any other race/ethnic group), Highest parental education (No formal qualifications, Qualifications below degree level, At least one had a degree level qualification), Current highest household education (No formal qualifications, Qualifications below degree level, At least one had a degree level qualification), Current or history of eating disorder(s) (No eating disorders, Anorexia nervosa, Binge eating disorder, Bulimia nervosa, Other specified feeding or eating disorder), Dietary restriction(s) (No special type of diet or dietary restriction(s), Food allergy or intolerance, Other diet or dietary restrictions), Current dieting for weight loss (No, Yes), Current hunger (Mean, sd), and Diet quality (Mean, sd). The table lists values for each category, such as the mean age being 46.7 with a standard deviation of 15.4, 573 men (47.6 percent) and 625 women (52.0 percent), 1042 participants with any white background (86.6 percent), and 224 participants with no formal qualifications (18.6 percent).
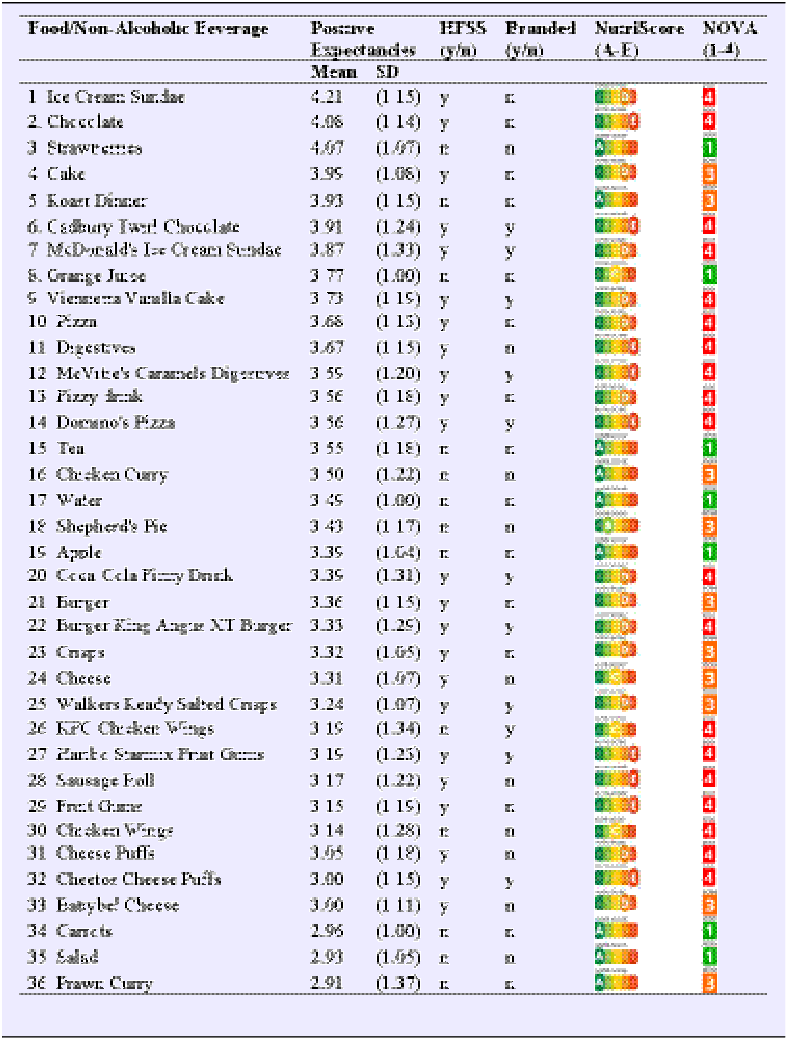
Rankings of positive expectancies for individual foods
Table 2 shows means and sd of positive expectancies for individual foods in ranking from highest to lowest. Across UK adults, the five strongest positive expectancies were for ice cream sundae, chocolate, strawberries, cake and roast dinner. The five weakest positive expectancies were for prawn curry, salad, carrots, Babybel cheese and Cheetos cheese puffs.
Rankings of positive expectancies for individual foods/non-alcoholic beverages

Table 2. Long description
A table ranking positive expectancies for individual foods and non-alcoholic beverages. The table has 36 rows and 6 columns. Column headers are: Food/non-alcoholic beverage, Positive expectancies (Mean and sd), HFSS (y/n), Branded (y/n), NutriScore (A-E), and NOVA (1-4). Row labels list specific foods and beverages. Notable trends include ice cream sundae, chocolate, and strawberries having the highest positive expectancies, while prawn curry, salad, and carrots have the lowest.
HFSS, high fat, salt and/or sugar.
Multilevel modelling indicated an intercept of 3·42 (se = 0·02) for positive expectancies, with 46 % of the variance due to random effects (i.e. between-person variability). There was a small interaction effect between HFSS and branding: branded HFSS (e.g. Cadbury Twirl chocolate) v. generic non-HFSS (e.g. prawn curry) were associated with 0·10 points increase in positive expectancies [se = 0·04, p = ·02, 95 %CI (0·02,0·18)]. There also were small main effects of HFSS and branding: HFSS (e.g. ice cream sundae) v. non-HFSS (e.g. carrots) were associated with 0·12 points increase in positive expectancies [b = 0·12, se = 0·02, p < ·001, 95 %CI (0·08, 0·17)], and branded (e.g. Babybel cheese) v. generic food (e.g. cheese) were associated with a 0·21 points decrease in positive expectancies [ se = 0·04, p < ·001, 95 % CI (–0·29, –0·14)]. The direction, magnitude and statistical significance of these results were consistent when we statistically controlled for the previously rated liking of taste, participant age and participant BMI, and when we excluded participants with history of eating disorders, dieting for weight loss or food allergies or intolerances (see Table S2 in Supplementary Material).
In exploratory analysis, there were very small main effects of traffic light labelling and processing. Each grade increase was associated with 0·03 points increase in positive expectancies [se = 0·03, p < 001, 95 % CI (0·01, 0·04)]. Each NOVA category increase was associated with 0·02 points increase in positive expectancies [ se = 0·01, p = ·03, 95 % CI (<0·01, 0·04)].
Associations of emotional expectancies for individual foods/non-alcoholic beverages with eating behaviour
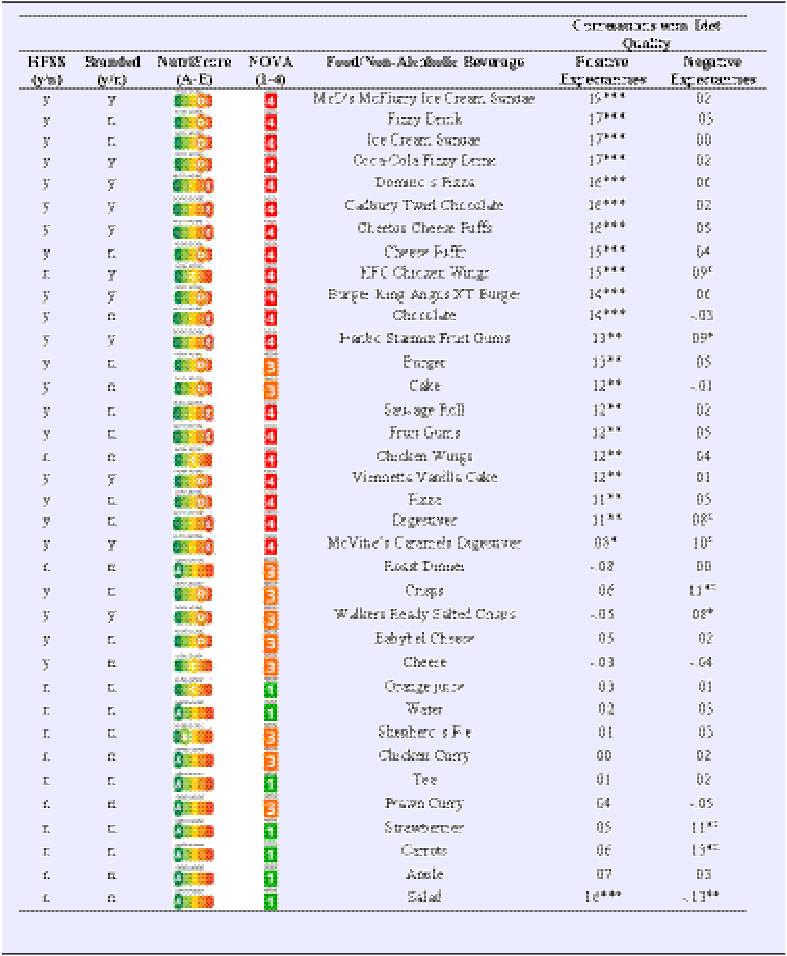
Table 3 shows bivariate correlations of positive and negative expectancies for individual foods with diet quality, in order by the size of the correlation for positive expectancies (largest to smallest). Greater positive expectancies for nearly all the HFSS – whether branded or generic – showed small associations with worse diet quality. This included positive expectancies for branded and generic ice cream sundaes, fizzy drinks, chocolate, pizza, cheese puffs, chicken wings, burgers, cake, sausage roll, fruit gums and digestives. Regarding positive expectancies for non-HFSS, only greater positive expectancies for salad showed small associations with more optimal diet quality. Greater negative expectancies were mostly not statistically significantly associated with diet quality. Exceptions were small associations of greater negative expectancies for strawberries, carrots and salad with worse diet quality, as well as greater negative expectancies for some (mostly branded) HFSS, including KFC chicken wings, Haribo Starmix Fruit Gums, McVitie’s Caramels Digestives, crisps and Walkers Ready Salted Crisps, with more optimal diet quality. The largest associations observed with diet quality were associations of greater positive expectancies for branded and generic ice cream sundaes, fizzy drinks and chocolate with worse diet quality. The direction, magnitude and statistical significance of these results were consistent when we statistically controlled for participant age and BMI (see Table S3 in Supplementary Material). When we excluded participants with history of eating disorders, dieting for weight loss or food allergies or intolerances, there were very small increases in the sizes of correlations between positive expectancies and worse diet quality (see Table S3 in Supplementary Material).
Bivariate correlations of positive and negative expectancies with diet quality

Table 3. Long description
The table presents bivariate correlations of positive and negative expectancies with diet quality for various foods and non-alcoholic beverages. It includes columns for HFSS (High in Fat, Salt, and Sugar) status, branded status, NutriScore, NOVA classification, and the food or beverage name. The correlations are divided into positive expectancies and negative expectancies. The table has 35 rows and 6 columns. Row 1: McD’s McFlurry Ice Cream Sundae, Positive expectancies: -19***, Negative expectancies: -02. Row 2: Fizzy Drink, Positive expectancies: -17***, Negative expectancies: -03. Row 3: Ice Cream Sundae, Positive expectancies: -17***, Negative expectancies: -00. Row 4: Coca-Cola Fizzy Drink, Positive expectancies: -17***, Negative expectancies: -02. Row 5: Domino’s Pizza, Positive expectancies: -16***, Negative expectancies: -06. Row 6: Cadbury Twirl Chocolate, Positive expectancies: -16***, Negative expectancies: -02. Row 7: Cheetos Cheese Puffs, Positive expectancies: -16***, Negative expectancies: -05. Row 8: Cheese Puffs, Positive expectancies: -15***, Negative expectancies: -04. Row 9: KFC Chicken Wings, Positive expectancies: -15***, Negative expectancies: -09*. Row 10: Burger King Angus XT Burger, Positive expectancies: -14***, Negative expectancies: -06. Row 11: Chocolate, Positive expectancies: -14***, Negative expectancies: -03. Row 12: Haribo Starmix Fruit Gums, Positive expectancies: -13**, Negative expectancies: -09*. Row 13: Burger, Positive expectancies: -13**, Negative expectancies: -05. Row 14: Cake, Positive expectancies: -12**, Negative expectancies: -01. Row 15: Sausage Roll, Positive expectancies: -12**, Negative expectancies: -02. Row 16: Fruit Gums, Positive expectancies: -12**, Negative expectancies: -05. Row 17: Chicken Wings, Positive expectancies: -12**, Negative expectancies: -04. Row 18: Viennetta Vanilla Cake, Positive expectancies: -12**, Negative expectancies: -01. Row 19: Pizza, Positive expectancies: -11**, Negative expectancies: -03. Row 20: Digestives, Positive expectancies: -11**, Negative expectancies: -08*. Row 21: McVitie’s Caramels Digestives, Positive expectancies: -08*, Negative expectancies: -10*. Row 22: Roast Dinner, Positive expectancies: -08, Negative expectancies: -00. Row 23: Crisps, Positive expectancies: -06, Negative expectancies: -11**. Row 24: Walkers Ready Salted Crisps, Positive expectancies: -05, Negative expectancies: -08*. Row 25: Babybel Cheese, Positive expectancies: -05, Negative expectancies: -02. Row 26: Cheese, Positive expectancies: -03, Negative expectancies: -04. Row 27: Orange juice, Positive expectancies: -03, Negative expectancies: -01. Row 28: Water, Positive expectancies: -02, Negative expectancies: -03. Row 29: Shepherd’s Pie, Positive expectancies: -01, Negative expectancies: -03. Row 30: Chicken Curry, Positive expectancies: -00, Negative expectancies: -02. Row 31: Tea, Positive expectancies: -01, Negative expectancies: -02. Row 32: Prawn Curry, Positive expectancies: -04, Negative expectancies: -05. Row 33: Strawberries, Positive expectancies: -05, Negative expectancies: -11**. Row 34: Carrots, Positive expectancies: -06, Negative expectancies: -13**. Row 35: Apple, Positive expectancies: -07, Negative expectancies: -03. Row 36: Salad, Positive expectancies: -16***, Negative expectancies: -13**.
HFSS, high fat, salt and/or sugar.
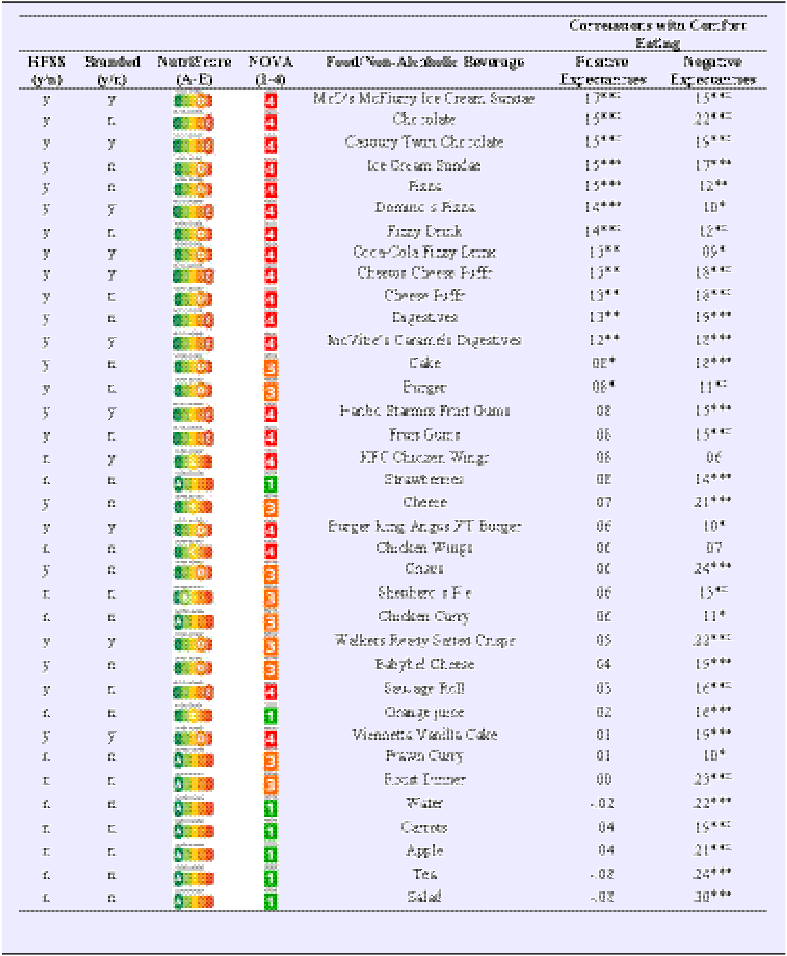
Table 4 shows bivariate correlations of positive and negative expectancies for individual foods with comfort eating, in order by the size of the correlation for positive expectancies (largest to smallest). Greater positive expectancies for the majority of HFSS – whether branded or generic – showed small associations with more frequent comfort eating. This included positive expectancies for branded and generic ice cream sundaes, fizzy drinks, pizza, chocolate, cheese puffs and digestives. In addition, greater negative expectancies for nearly all foods showed small to medium associations with more frequent comfort eating. Associations of more frequent comfort eating with greater negative expectancies were larger than those with greater positive expectancies. There were very small decreases in the sizes of the correlations of positive and negative expectancies with comfort eating when we statistically controlled for participant age and BMI (see Table S4 in Supplementary Material). The direction, magnitude and statistical significance were consistent when we excluded participants with history of eating disorders or food allergies or intolerances; there were very small increases in the sizes of correlations between positive expectancies and more frequent comfort eating when we excluded participants dieting for weight loss (see Table S4 in Supplementary Material).
Bivariate correlations of positive and negative expectancies with comfort eating

Table 4. Long description
The table presents bivariate correlations of positive and negative expectancies for individual foods with comfort eating. It includes columns for HFSS (y/n), Branded (y/n), NutriScore (A-E), NOVA (1-4), Food/non-alcoholic beverage, Positive expectancies, and Negative expectancies. The table lists various foods and their corresponding correlation values. Each row provides specific data points for these categories, showing how different foods correlate with comfort eating. The table is organized to highlight the size of the correlation for positive expectancies from largest to smallest.
HFSS, high fat, salt and/or sugar.
Discussion
In a fully powered, nationally representative sample, UK adults – on average – more strongly expected that eating branded HFSS v. generic non-HFSS would elicit positive emotions. Greater positive expectancies for HFSS (branded and generic) were consistently associated with worse diet quality. In addition to greater positive expectancies for HFSS, greater negative expectancies for HFSS and non-HFSS (branded and generic) were linked with more frequent comfort eating.
This is the first quantitative study to systematically investigate types of food most implicated in food-related emotional expectancies. The finding that adults more strongly expected eating branded HFSS (e.g. Cadbury Twirl chocolate) v. generic non-HFSS (e.g. prawn curry) would bring positive emotions, suggests fat, salt and/or sugar in food combined with branding increases anticipation of positive emotions. However, adults also less strongly expected that eating branded (e.g. Babybel cheese) v. generic food (e.g. cheese) would bring positive emotions whilst more strongly expecting that eating HFSS (e.g. ice cream) v. non-HFSS (e.g. carrots) would. This suggests any increase in positive expectancies from branding depend on HFSS effects and, in some cases, branding may reduce positive expectancies. This may reflect the widespread impact of existing food marketing, given most exposures are for branded HFSS, with fruit and vegetables rarely branded(46). Consistent with this, experimental evidence indicates participants better recognise HFSS brands, view their product advertising for longer and share it more often with peers compared to healthier brands and their product advertising(Reference Murphy, Corcoran and Tatlow-Golden47). Although UK adults may have socially learnt positive emotional benefits of branded foods via marketing, personal learning with generic foods could have occurred more frequently and had a greater influence on expectancy formation. The present study branding effects should be interpreted in context of our study design, which was limited in its selection of branded non-HFSS v. branded HFSS, and had branded food images in which packaging covered the view of the food. Since this is the first study to consider brands in food-related emotional expectancies, further research should seek to replicate these effects and examine how branding independently and interactively affects anticipation of positive emotions using different stimuli. For example, participants could rate their expectancies prior to a ‘bogus’ taste test involving two identical foods, one with a brand logo behind it and one without(Reference Robinson, Haynes and Hardman48).
Adults more strongly expected eating HFSS (branded and generic) v. non-HFSS would bring positive emotions, but there were exceptions. UK adults expected strawberries, roast dinner and orange juice to bring positive emotions nearly as much or more than ice cream sundaes, chocolate, and cake. They also expected chicken curry, shepherd’s pie, tea, water and apple to bring slightly more positive emotions than burgers and crisps. However, only greater positive expectancies for HFSS (branded and generic) showed small associations with worse diet quality and more frequent comfort eating. If exclusively positive expectancies for HFSS – rather than positive expectancies for all foods – have health consequences in the UK population, efforts to modify food-related emotional expectancies and change behaviour have a precise target. Future research should investigate the health consequences of positive HFSS v. non-HFSS expectancies in longitudinal studies, and the mechanisms by which more nutrient-dense foods could be expected to bring positive emotions. Higher positive expectancies for fruit (e.g. strawberries), traditional and cultural meals (e.g. roast dinner) and low-calorie beverages (e.g. tea) suggest food attributes of sweetness and liquidity, and psychosocial factors such as tradition and cultural value, to be influential too. Also, while there were standard food attributes that increased positive expectancies, random effects accounted for nearly half of the variance. This suggests that – while there are commonalities in the food types implicated in food-related emotional expectancies in the UK population – there are substantial variations between individuals.
Evidence that positive HFSS expectancies were linked with worse diet quality and more frequent comfort eating in the UK population are consistent with findings from observational studies in the USA and Australia(Reference Cummings, Joyner and Gearhardt20–Reference Wu, Vartanian and Faasse22). Observational studies in Turkish adults and Korean students also found that positive HFSS expectancies were associated with more frequent comfort eating, providing evidence from non-Western countries(Reference Yang and Kwon49,Reference Özgür, Duman and Meriç50) and supporting the global relevance of expectancy theory. International studies of food-related emotional expectancies would provide direct evidence concerning the role of positive HFSS expectancies in reinforcing eating behaviour universally and could test effect modification by country-level differences.
More frequent comfort eating was also associated with greater negative expectancies for all foods in UK adults. This is comparable to mixed findings from observational studies in the USA, wherein negative expectancies were consistently linked with more frequent comfort eating but not with diet quality(Reference Cummings, Treharne and Vainik21). A limitation of expectancy theory is its incomplete consideration of how negative expectancies affect behaviour; yet in application to substance use, researchers hypothesized effects of negative substance expectancies differ as a function of substance use disorder severity(Reference Mann, Chassin and Sher51,Reference McMahon, Jones and O’donnell52) . Indeed, those with substance use disorder typically have stronger positive and negative substance expectancies whereas those with sub-clinical levels of substance use only have stronger positive ones(Reference Mann, Chassin and Sher51). Similarly, it could be that, while positive HFSS expectancies are relevant to improving diet quality in the whole UK population, negative expectancies are relevant to those who eat in response to their negative emotions. This is a clinically meaningful distinction because comfort eating is notably high in UK adults seeking NHS treatment for diet-related disease(Reference Marwood, Radley and Evans3).
Results from this study should be interpreted considering limitations. Food classifications were made based on available National Diet and Nutrition Survey or online information and, in some cases like when applying the NOVA system, assumptions were made, like coding based on whether items were homemade and without additives. In designing the study, we recognised branded non-HFSS images were not prevalent in the Restrain Food Database(Reference Randle, Duarte and Maizey36) because there are more HFSS than non-HFSS packaged using brand logos(Reference Monteiro, Cannon and Levy45). As a result, there were few branded non-HFSS in our image set compared to the number of branded HFSS, so the interaction test between branding and HFSS is limited. Static images of foods and foods covered in packaging may also not elicit as strong positive expectancies as food exposures in person would, yet visual exposures are still powerful(Reference Boswell and Kober53). Although each participant saw a mix of images for fast foods, sweets, savoury snacks, traditional and cultural meals, fruit, vegetables and non-alcoholic beverages, which were identified from qualitative research on food-related emotional expectancies(Reference Roberts, Ince and Neubeck9), it is possible foods that elicit strong positive expectancies for different individuals were not shown here. Images were previously rated for liking of taste of the food(Reference Randle, Duarte and Maizey36), but we did not measure liking in the present study sample. Future research should consider simultaneously measuring food liking and expectancies to evaluate the extent of their overlap.
Food-related emotional expectancies were assessed by self-report, so there could have been bias in responding including social desirability bias. The same questions were repeated several times for different food images. We randomised the order, and each participant only viewed a selection of eighteen out of the thirty-six total image set, but participants may still have been burdened by this procedure. In substance expectancies research, time to respond to expectancy questions has been considered a metric of expectancies(Reference Reich, Below and Goldman54), so that could be timed and considered as a behavioural measure in future studies of food-related emotional expectancies. Diet quality and comfort eating were also measured via self-report, and no efforts to address potential sources of bias in the assessment of diet quality were made given the online nature of the study without direct participant contact. Although the single-item measure of comfort eating has shown good convergent validity with the Emotional Eating subscale of the Dutch Eating Behavior Questionnaire(Reference Cummings, Mason and Puterman40), it may have limited reliability.
The study was observational and cross-sectional; therefore, causal conclusions cannot be drawn from this study alone. Although prolific representatively distributed study advertisements based on UK census data for sex, age and race/ethnicity, prevalence estimates of overweight or obesity were lower in the study sample compared with estimates by the National Health Service(55). Thus, there may have been underrepresentation of UK adults with overweight or obesity in the study sample, or bias in reporting heights and weights. While data on dietary restrictions, dieting and eating disorders were collected, full medical history was not. Having a condition affected by dietary intake (e.g. Crohn’s disease, irritable bowel syndrome) could influence food-related emotional expectancies, which we could not examine here.
In conclusion, UK adults most strongly anticipated positive emotions from eating HFSS and those positive HFSS expectancies were associated with inadequate diet quality. The present study results suggest that reducing positive HFSS expectancies, particularly for branded and generic ice cream sundaes, fizzy drinks and chocolate, may be beneficial for health at the UK population level. Positive HFSS expectancies could be targeted through food environment policy change including regulations on HFSS cues in pubs and restaurants(Reference Cummings, Hoover and Turner13,Reference Wall, McKee and Hinson15) and HFSS advertising exposures(Reference Cummings, Hoover and Gearhardt16). Expectancy challenge interventions could also be tailored to this context and delivered in group settings(Reference Gesualdo and Pinquart17,Reference Coates, Gullo and Feeney18) . For example, like what has been effective in challenging positive alcohol expectancies, individuals could track their positive emotions after eating HFSS v. other foods to collect evidence that counteracts their positive HFSS expectancies. Given there were substantial variations between individuals, professionals working individually with patients should consider assessing specifically which expectancies are highest and most predictive of problematic behaviour for each patient, as has been done in alcohol use disorder treatment(Reference Coates, Gullo and Feeney18). This is especially relevant for adults who comfort eat, as they may benefit from challenging negative expectancies for eating multiple food types. Future experiments should test the beneficial effects of personalised targeting of food-related emotional expectancies v. reducing all positive HFSS expectancies to guide intervention design.
Supplementary material
For supplementary material/s referred to in this article, please visit https://doi.org/10.1017/S0007114526109313
Data availability statement
Anonymised data that support the findings are publicly available on the Open Science Framework: https://osf.io/6xfpd/overview.
Acknowledgements
N/A
Author contributions
All authors contributed to conceptualisation and acquired the funding. JRC collected the data and conducted the analysis. ZC applied nutrition coding. JRC wrote the original draft, and all authors reviewed and edited the manuscript.
Financial support
This research was supported by the University of Liverpool Institute of Population Health Research Support Fund.
Competing interests
The authors declare none.



 Open access

