

1. Introduction
The ribosome is a central mediator of gene expression, translating the genetic code in messenger RNAs (mRNAs) to proteins. Recent results have underscored the importance of translational control in regulation of gene expression, augmenting the traditional role of transcription. Mis-regulation of translation is a leading cause of many diseases. Viruses use a variety of mechanisms to co-opt the translational machinery to facilitate their replication, including manipulation of translation initiation factors, and specific RNA structures to guide translation within their genomes. Translational control has been implicated in human cancer, with changes in protein synthesis caused by up-regulation or changed functions of initiation factors. Finally, many genetic diseases disrupt translation through premature termination codons. To delineate the basis of translational control and harness the potential of targeting translation therapeutically, clear structural and dynamic mechanisms are required. This review focuses on progress towards this vision.
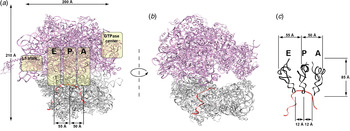
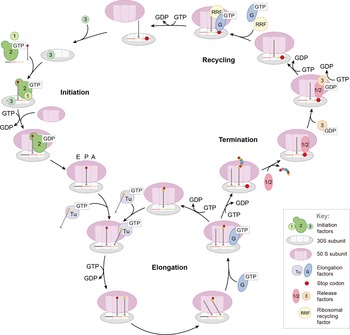
Translation occurs through four phases: initiation, elongation, termination, and recycling. Each of the four phases entails a number of interactions that prevent synthesis of the wrong proteins at the wrong time. To initiate translation, ribosomes must assemble from isolated subunits (small 30S subunit and large 50S subunit for prokaryotes and 40S and 60S subunits for eukaryotes) and an initiator transfer RNA (tRNA) on an mRNA at a specific start codon to establish reading frame. Initiation is guided by multiple protein factors. Elongation occurs through selection by the ribosome of cognate aminoacyl tRNAs (aa-tRNA), as specified by the mRNA sequence, which binds to the ribosomal A site (aa-tRNA site). Subsequent positioning of the A-site tRNA allows for peptide bond formation with the peptidyl-tRNA site (P-site tRNA) at the peptidyl transferase center (PTC), transferring the nascent peptide from the P-site tRNA to the A-site aa-tRNA, increasing the length of the nascent peptide by one amino acid. Immediately adjacent to the PTC lies the peptide exit tunnel, through which the newly synthesized nascent peptide chain is extruded out of the ribosome into the cytoplasm. Subsequently, a guanosine triphosphate (GTP)ase elongation factor catalyzes the movements of the tRNAs and mRNA by one codon (translocation), placing the A- and P-site tRNAs into the P and E (exit) sites, respectively, from which the E-site tRNA is ejected. This process is iterative until termination at a stop codon, where the polypeptide is released, and the ribosomal subunits are disassembled and recycled (Figs 1 and 2). Thus, the reading of the genetic code and translocation is coupled to the energy of GTP hydrolysis and peptidyl transfer, helping the ribosome to achieve in vivo rates of 10–20 amino acids incorporated per second in Escherichia coli (Young & Bremer, Reference Young and Bremer1976) and 5–10 amino acids per second in yeast (Bonven & Gullov, Reference Bonven and Gullov1979) with an accuracy of one misincorporation per 1000–10 000 codons (Edelmann & Gallant, Reference Edelmann and Gallant1977; Precup et al. Reference Precup, Ulrich, Roopnarine and Parker1989; Zaher & Green, Reference Zaher and Green2009). The ribosome guides a complex and well-coordinated translation process that synthesizes the correct proteins at the right time with speed and accuracy (Johansson et al. Reference Johansson, Zhang and Ehrenberg2012).
An architectural view of the prokaryotic ribosome. (a) The large subunit (50S) is shown in purple and the small subunit (30S) is shown in gray; the mRNA is shown in red. The positions of the tRNA-binding sites (A, aminoacyl; P, peptidyl; E, exit), the GTPase center, and the L1 stalks are indicated with yellow overlays. tRNAs bind to the ribosome at the A site, passes through the P site, and exits via the E site. The ribosome has a dimension of roughly 200 Å, making it suitable for single-molecule methods. (b) E-site lateral view of the 70S ribosome, showing the tunnel occupied by mRNA and tRNA. (c) Relative positions of the A-, P-, and E-site tRNAs, in the classical configuration, on the ribosome. The tRNAs are roughly 12–55 Å apart. Figure modified with permission from (Aitken & Puglisi, Reference Aitken and Puglisi2010).

The prokaryotic translation cycle. Shown is a simplified model of the prokaryotic translation cycle. Initiation, mediated by initiation factors 1, 2, and 3, culminates in the joining of 30S and 50S subunits on the mRNA message primed with initiator tRNA in the P site. This complex, aided by the elongation factors Tu and G, subsequently undergoes multiple rounds of elongation. Termination, under the control of release factors 1, 2, and 3, frees the newly synthesized polypeptide upon recognition of the stop codon. Ribosomal recycling factor and elongation factor G then prepare the translational machinery for subsequent initiation events. Each of these steps are potential points of regulation and translational control. Figure modified with permission from (Marshall et al. Reference Marshall, Dorywalska and Puglisi2008).

The past decade has seen a revolution in the understanding of translation, with numerous biochemical studies and three-dimensional (3D) crystallography structures of prokaryotic and eukaryotic ribosomes at atomic resolution (Fernandez et al. Reference Fernandez, Bai, Murshudov, Scheres and Ramakrishnan2014; Fischer et al. Reference Fischer, Neumann, Konevega, Bock, Ficner, Rodnina and Stark2015). Cryogenic electron microscopy (cryo-EM) has revealed how factors, tRNA, and ligands interact with the ribosome in many transient translational intermediates, with resolutions recently approaching that of crystallography (Selmer et al. Reference Selmer, Dunham, Murphy, Weixlbaumer, Petry, Kelley, Weir and Ramakrishnan2006; Tourigny et al. Reference Tourigny, Fernandez, Kelley and Ramakrishnan2013; Yusupov et al. Reference Yusupov, Yusupova, Baucom, Lieberman, Earnest, Cate and Noller2001; Wimberly et al. Reference Wimberly, Brodersen, Clemons, Morgan-Warren, Carter, Vonrhein, Hartsch and Ramakrishnan2000). Transient intermediates have been captured through the clever use of antibiotics or biochemical perturbations to lock the ribosome into states along the reaction trajectory. Structural snapshots and prior biochemical studies are suggestive of dynamics during translation, but it is risky to order snapshots temporally to create a structural mechanism for translation, since structures do not come ordered as a nice photo collection with time stamps. Recent developments in time-resolved cryoEM and conformational sorting algorithms may empower such studies (Fischer et al. Reference Fischer, Neumann, Konevega, Bock, Ficner, Rodnina and Stark2015).
Translation is thus a dynamic process, and these structural ‘snapshots’ only capture a limited number of conformational and compositional states that can be trapped and populated. Translation may not be simply a linear process, with a single mechanistic pathway, but likely involves multiple pathways and branchpoints. The conformational and compositional flexibility of the ribosome and the stochastic nature of biological processes might allow different pathways to occur during translation, with many of the steps kinetically controlled. These multiple pathways and branchpoints are a potential regulatory nexus, allowing gene expression to be tuned at the translational level. The dynamic modulation of translation by elements and factors acting in cis or in trans add a further layer of richness to translational regulation, and understanding this molecular choreography of ribosomal conformation and factor composition is essential to understanding translational control.
1.1 Pathways and kinetic control
Bulk biochemical and genetic studies provide the foundation of our understanding of translation. The richness of these data (Rodnina, Reference Rodnina2012; Rodnina & Wintermeyer, Reference Rodnina and Wintermeyer2001a, Reference Rodnina and Wintermeyerb; Zavialov & Ehrenberg, Reference Zavialov and Ehrenberg2003), highlighting the role of different components and determining rate and equilibrium constants, has created a framework to study translation. The success of this approach derives from isolating individual processes (tRNA selection, translocation, peptide bond formation, etc.) from each other. There is a tendency to view the process biased by equilibrium measurements, stepwise kinetics and indirect observation from genetic experiments. Translation from this perspective becomes the simple evolution of a series of static states that correspond to complexes for which data are available. This leads to an underestimation of the conformational and compositional dynamism inherent in translation, and presents the process as a linear pathway passing through a series of (meta)stable intermediates. Although many of the complexes, especially during initiation, exhibit high equilibrium affinities (Acker et al. Reference Acker, Shin, Nanda, Saini, Dever and Lorsch2009; Milon & Rodnina, Reference Milon and Rodnina2012), the rate constants for forward and reverse reactions in the equilibria are such that the system may not equilibrate on the timescale of reaction. Under these conditions, the K d is not necessarily an accurate metric for composition; kinetic studies are needed to determine what factors are bound at each stage of the reaction pathway. The important point to consider is that while equilibrium bulk studies are useful for identifying interactions, kinetic and especially single-molecule studies are required to establish how those interactions are harnessed to promote initiation. As the field moves forward, it will be important to determine whether the view of initiation should be recast as a kinetically controlled process occurring on a relatively flat potential energy landscape where parallel processes can happen with comparable probability, and where ensembles of components progressing through a particular reaction coordinate can be diverted readily into alternative pathways with minimal energy cost. Some progress has been made in this regard, particularly with the application of systems biology to in vivo translation efficiency (Firczuk et al. Reference Firczuk, Kannambath, Pahle, Claydon, Beynon, Duncan, Westerhoff, Mendes and Mccarthy2013; Shah et al. Reference Shah, Ding, Niemczyk, Kudla and Plotkin2013).
1.2 Partitioning and commitment
Of central importance to understanding translation dynamics are the simple concepts of kinetic partitioning and forward commitment. These terms describe the relative rates of competing reactions available to intermediates along a reaction pathway. For typical enzymes that catalyze the chemical reactions of small-molecule substrates, the number of possible reactions for a particular intermediate are quite limited, encompassing covalent bond formation or cleavage, isomerization, etc. While the ribosome catalyzes or promotes several chemical reactions (peptide bond formation, GTP hydrolysis by factors), its function is grounded in conformational manipulation of tRNAs, mRNAs, and factors. For such conformationally driven reactions, there are many conformational degrees of freedom and accessible pathways from a given intermediate. By accessible, we mean here reactions that have a kinetic barrier low enough to be surmounted with significant probability under ambient temperature and concentrations. For each intermediate in initiation, elongation, termination and recycling, there may be many potential accessible pathways with comparable kinetic barriers. The fate of a given intermediate will therefore be highly dependent on which of the potential outcomes happens first, and in particular need not reflect which pathway leads to the most energetically stable outcome. Where competing pathways may occur with similar probabilities, a given intermediate may partition between them to form two or more subsequent intermediates, each of which may have different properties and experience different outcomes during later steps. The directionality of many of these reactions is ensured by essentially irreversible chemical reactions such as GTP hydrolysis or peptide bond formation. This situation is a major contributor to the parallelism inherent in translation and can be clearly seen in translational phenomena such as frameshifting (Chen et al. Reference Chen, Petrov, Johansson, Tsai, O'Leary and Puglisi2014; Tinoco et al. Reference Tinoco, Kim and Yan2013).
Commitment to a given pathway can be defined by the relative likelihood of an intermediate to move to a later intermediate along the pathway versus reverting to an earlier one. This forward commitment is often referred to in terms of a ‘commitment factor’, which is a ratio of the rate constants for the forward and reverse steps. For simple enzymes catalyzing chemical reactions, these quantities can be readily measured for the catalytic steps. However, the situation is far more complex for the ribosome during translation, where many conformational states may exist for a single intermediate. As such, ribosomes and their associated factors should not be considered as participants in a rigid, linear kinetic pathway, but rather as navigating a maze of accessible kinetic pathways in a manner that can be modulated dynamically by elements acting in cis or in trans. Structural techniques that provide the most definitive visualization of ribosomal intermediates may be biased to thermodynamically stable states of the system. Advances in time-resolved cryo-EM and rapid trapping of a conformational ensemble allows sorting of conformational states. The absence of kinetic information also makes it challenging to evaluate properly whether particular steps in translation are kinetically or thermodynamically controlled.
1.3 Regulation
The potential pathways arising out of the existence of a multitude of sub-complexes of the translation machinery are further expanded by regulatory mechanisms. The role of mRNA sequence and structure, and its potentially differential engagement with modified factors and the ribosome is central. For example, interaction of mRNA with initiation factors and the ribosome control the efficiency and rate of initiation, especially in the case of eukaryotic initiation. This is critically important since initiation is the final checkpoint before the ribosome undergoes the energy-expensive elongation phase. During elongation, special mRNA sequences and secondary structures engage the ribosome, altering the elongation dynamics of the ribosome and controlling the speed of translation. The pausing or stalling of translation allows co-translational protein folding or allows the ribosome to be shunted into alternative pathways of translation. Furthermore, nascent peptides sequences can also interact with the ribosomal exit tunnel to stall translation. The combination of these interactions allows unusual recoding events to occur during translation, where the ribosome may change the reading frame or bypass a certain length of the mRNA, such as in frameshifting. These examples only exemplify the myriad of regulatory mechanisms the ribosome utilizes to control translational gene expression, underscoring the conformational and compositional flexibility of the ribosome to access non-canonical states. Furthermore, the existence of a variety of chemically modified forms of the ribosome, protein factors, and mRNAs in addition to uncharacterized translational factors, must be considered, along with the potential for these differing forms to contribute to differing modes of translation. An understanding of regulation will deepen and complement our view of ‘canonical’ translation.
1.4 Single-molecule approaches to study dynamics and regulation
Like all biological processes, translation and its regulation are intrinsically dynamic. During translation, the ribosome and factors undergo large conformational rearrangements (domain movements, etc.; timescales of 10–6–102 s) that are often functionally cooperative. Conformational dynamics involve complex spatial trajectories, whereby the system waits to surpass some barrier in the energy landscape; the timescales of rearrangements reflect the heights of those barriers, with longer timescales (waiting times) for higher barrier heights. Compositional dynamics are determined by bimolecular association and dissociation rate constants: bimolecular arrival rates for ligands are governed by intermolecular collision frequencies, electrostatic interactions, and proper spatial orientations for productive binding events, whereas dissociation rates are governed by energy barriers for dissociation of non-covalent intermolecular interactions.
Dynamics have been traditionally measured using bulk biochemical and biophysical methods. Intrinsic or extrinsic fluorescence has been measured to monitor conformational dynamics in bulk, as fluorophores are very sensitive to local environment; Förster resonant energy transfer between two dye labels monitors dynamics directly (see below). Kinetics of conformational processes are measured using stopped-flow instrumentation with time resolution of milliseconds. These methods have been widely and successfully applied to probe the kinetics of translation (Caliskan et al. Reference Caliskan, Peske and Rodnina2015; Johansson et al. Reference Johansson, Bouakaz, Lovmar and Ehrenberg2008; Rodnina, Reference Rodnina2013), outlining the overall kinetic scheme and measuring the rates of individual steps for several translation processes. However, biochemical experiments involving translation require carefully synchronizing all ribosomes so that the experiment measures specifically the kinetics of a process in a homogeneous system. Detecting the heterogeneity and the multiple pathways and subpopulations inherent to translation is difficult to impossible with bulk methods.
Single-molecule experiments allow direct measurement of dynamics without the need for synchronization. Fluorophores (usually Cy2, Cy3, Cy3·5, Cy5, or Cy5·5 that range across the visible spectra) can be specifically conjugated to tRNAs, translation factors, or the ribosome through a variety of methods (Blanchard et al. Reference Blanchard, Kim, Gonzalez, Puglisi and Chu2004b; Dorywalska et al. Reference Dorywalska, Blanchard, Gonzalez, Kim, Chu and Puglisi2005; Fei et al. Reference Fei, Kosuri, Macdougall and Gonzalez2008; Sternberg et al. Reference Sternberg, Fei, Prywes, Mcgrath and Gonzalez2009). Excitation of the fluorophores with the laser of the specific wavelength results in emission of photons of a particular wavelength. The biomolecule of interest, in this case possibly the ribosome, is typically immobilized through biotin–streptavidin interactions to bind mRNAs or ribosomes to an optically transparent surface. Fluorescently labeled components can be permanently immobilized to a surface, in which case there is no background fluorescence from fluorophores in solution. All photons detected are from an immobilized biomolecule. However, if a ligand of translation (for example, a tRNA or factor) is labeled, one needs to distinguish fluorescence from the ligand free in solution from that when it binds to a surface-immobilized biomolecular complex.
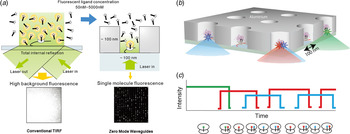
To distinguish weak single-fluorophore fluorescence from background illumination and noise, various techniques such as total internal reflection fluorescence microscopy (TIRF) (Roy et al. Reference Roy, Hohng and Ha2008) and zero-mode waveguides (ZMWs) are utilized to limit the volume of solution excited by a laser (excitation volume) (Chen et al. Reference Chen, Dalal, Petrov, Tsai, O'LEARY, Chapin, Cheng, Ewan, Hsiung, Lundquist, Turner, Hsu and Puglisi2013b; Levene et al. Reference Levene, Korlach, Turner, Foquet, Craighead and Webb2003; Uemura et al. Reference Uemura, Aitken, Korlach, Flusberg, Turner and Puglisi2010) (Fig. 3). The rapid diffusion of fluorophores in solution limits observation of the free molecules, since on the timescale of data acquisition (usually 10–100 ms) a labeled molecule leaves the illumination volume before emitting enough photons to be observed. For example, in a single-molecule fluorescence experiment, the freely diffusing labeled tRNA only weakly observed, as single-fluorephores diffuse into an excitation and observation volume. Binding of the tRNA to an immobilized ribosome leads to a burst of observed fluorescence, as the fluorophore, emitting a large number of photons, is now localized within a small observation volume, as opposed to freely diffusing in solution. Binding of multiple tRNAs is manifested at the single-molecule level as a series of fluorescence bursts and inter-burst delays. The distributions of single-event lifetimes and delay times are often fit by simple exponential functions, yielding time constants that are reciprocal to the rate constants for dissociation and association, respectively. Labeling different tRNAs with distinct fluorophores allows the tracking of the sequential binding of the different tRNAs as specified by the mRNA sequence. Therefore, the order of binding events, kinetics of the subsequent binding and dissociation events, and average overlap time of occupancy by multiple ligands can be measured without interference from unlabeled components in a complex system. As such correlations between dynamic events in multistep, heterogeneous systems can be observed directly with a single-molecule approach (Petrov et al. Reference Petrov, Chen, O'Leary, Tsai and Puglisi2012).
Visualization of direct tracking of single-molecules in ZMWs. (a) Comparison between conventional TIRF microscopy and use of zero-mode waveguides (ZMWs). At concentrations of fluorescently labeled ligands higher than 50 nM, spots are not distinguishable because of high background fluorescence (left). ZMWs overcome this limitation (right) by decreasing illumination volume by three to four orders of magnitude compared to TIRF. This allows fluorescence detection in the mM range. (b) Schematic illustration of ZMW construction. Each ZMW chip contains thousands of ZMW wells, allowing for the simultaneous monitoring of thousands of single ribosomes. Ribosomal complexes are specifically immobilized in the bottom of derivatized ZMWs using biotinylated mRNAs. (c) Arrival and departure of fluorescently labeled ligands to the immobilized ribosome are manifested through the appearance and disappearance of fluorescent pulses.

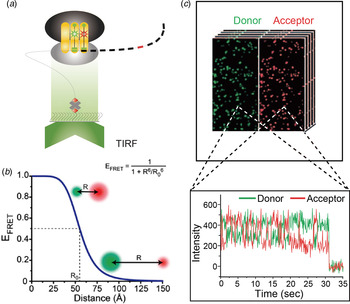
Conformational dynamics are also readily investigated using single-molecule fluorescence by taking advantage of FRET, which involves energy transfer between a donor and acceptor dye through coupling of transition dipoles. The efficiency of energy transfer depends on the inter-dye distance between the donor and acceptor dye (usually Cy3 and Cy5). The FRET efficiency varies from 1 (all emissive energy from Cy3 is transferred to Cy5) at distances below about 20 Å, to 0 at distances above 80 Å. Thus FRET is highly sensitive to distance changes in the region of 30–60 Å, well suited for investigation of the ribosome (250 Å in diameter) (Fig. 4). Other more recent techniques include replacing the Cy5 acceptor dye to a non-fluorescent quencher (BHQ-2), allowing the correlation of conformation with the arrival and departure of ligands (Chen et al. Reference Chen, Petrov, Tsai, O'Leary and Puglisi2013c, Reference Chen, Tsai, Petrov and Puglisi2012b). The use of non-fluorescent quencher frees up a spectral channel for cross-correlation experiments; furthermore, the use of non-fluorescent quencher eliminates the poor behavior of the acceptor fluorophore, extending the FRET observation time and decreasing the background noise (see Figs 12B and 12C below).
Conformational dynamics using TIRF for smFRET. (a) A laser excitation source is totally internally reflected, resulting in an evanescent field that selectively exciting FRET donor fluorophores on ribosomal complexes that are localized within ~300 nm of the glass slide. Ribosomal complexes are specifically immobilized in the bottom of derivatized glass slide using biotinylated mRNAs. (b) A plot of the FRET efficiency (E FRET) as a function of the distance (R) between a donor fluorophore (green sphere) and an acceptor fluorophore (red sphere). When R < R 0, E FRET > 0·50 (high FRET, high-energy transfer); when R = R 0, E FRET = 0·50; and when R > R 0, E FRET < 0·50 (low FRET, low-energy transfer). Thus, FRET is suitable for monitoring interactions and distances within 100 Å. Modified with permission from (Roy et al. Reference Roy, Hohng and Ha2008). (c) The separated donor and acceptor fluorescence intensities emerging from single, optically resolved ribosomal complexes can be quantified and plotted as a function of time. The anti-correlated intensities of the donor Cy3 (green) dye and the acceptor Cy5 (red) dye is characteristic of FRET. Modified with permission from (Perez & Gonzalez, Reference Perez and Gonzalez2011).

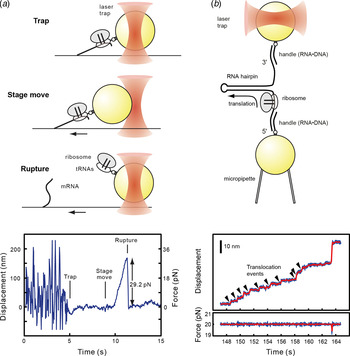
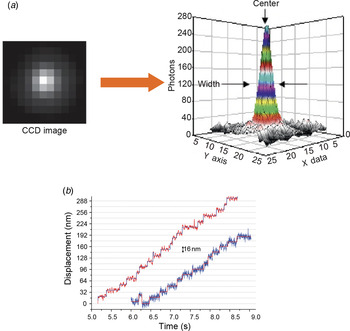
Single-molecule methods can directly measure forces and mechanical stability of molecular complexes by using optical or magnetic trapping. Optical traps can apply constantly increasing force to the point of complex rupture to test mechanical stability of the complexes, thus directly reporting on the tensile strength of the intermolecular interactions, such as those between mRNA and the ribosome (Uemura et al. Reference Uemura, Dorywalska, Lee, Kim, Puglisi and Chu2007). Alternatively, the trap can be employed as a molecular ruler to track relative movement of the two components in the complex, for example the traveling of the ribosome along mRNA (Wen et al. Reference Wen, Lancaster, Hodges, Zeri, Yoshimura, Noller, Bustamante and Tinoco2008) (Fig. 5).
Single-molecule force methods and translation. (a) Surface immobilization and optical trapping of ribosome complexes allows direct measurement of the forces holding the ribosome on the mRNA and other interactions. Surface-immobilized ribosome complexes are manipulated by trapping an attached polystyrene bead with a focused infrared laser beam. Displacement of the bead from the center of the optical trap applies a constantly increasing force to the ribosome complex, which eventually ruptures, allowing the bead to return to the trap center. The position of the bead at the rupture event allows calculation of the stability of the ribosome:mRNA interaction. (b) Precise measurement of mRNA length reports on the ribosome's position on the mRNA. An mRNA hairpin is stretched between two polystyrene beads, one of which is held at constant force by an optical trap. Translation by the ribosome forces hairpin melting, allowing extension of the mRNA. mRNA extension, and thus ribosome position, can be followed in real-time at subnanometer precision, revealing individual translocation events. Figure modified with permission from (Uemura et al. Reference Uemura, Dorywalska, Lee, Kim, Puglisi and Chu2007) and (Wen et al. Reference Wen, Lancaster, Hodges, Zeri, Yoshimura, Noller, Bustamante and Tinoco2008).

Single-molecule approaches come with experimental and practical caveats. Labeling of biomolecules is often technically difficult, and can perturb conformation or function. Therefore, rigorous biochemical and biophysical testing of labeled components is required. Conformation and function of labeled components must be confirmed; labeled biomolecules often have non-specific affinity to surfaces or other biomolecules, which can be mistaken as binding events in single-molecule experiments (so called ‘stickiness’). Surface effects caused by immobilization of biological systems must be considered and controlled. Fluorescence signals from single dyes are often noisy, and time resolution of detection of a signal is often 5–50 ms, obscuring rapid conformational or compositional dynamics. Continued technical and computational improvements will enhance single-molecule approaches in the years ahead.
An exciting technique development in ribosomal biophysics is ribosome profiling, which probes ribosomal positions on mRNAs using next-generation sequencing methods (Ingolia et al. Reference Ingolia, Ghaemmaghami, Newman and Weissman2009, Reference Ingolia, Lareau and Weissman2011). Translating ribosomes from cells are trapped on mRNAs using antibiotics, essentially freezing them in position, and then the mRNA is digested with nucleases yielding protected RNA fragments where the ribosome is positioned, which are subsequently sequenced. Ribosome profiling has been used to map where ribosomes initiate, identified potential sites of stalling and pausing in elongation, and potential sites of stop-codon readthrough. Although ribosome profiling has been used to posit dynamic aspects of translation, direct temporal measurements are required as discussed below. Yet the power of obtaining ribosomal positions on all mRNAs in a cell, with subcellular resolution, is remarkable and undeniably transformative. Through the combined uses of single-molecule, ribosome profiling, and structural methods such as cryo-EM, more regulatory insights intro translation can now be obtained.
2. Overview of prokaryotic translation
Decades of biochemical and structural studies have mapped out a comprehensive mechanism for prokaryotic translation. The structural and kinetic mechanisms of prokaryotic translation have been well reviewed (Agirrezabala & Frank, Reference Agirrezabala and Frank2009; Chen et al. Reference Chen, Tsai, O'LEARY, Petrov and Puglisi2012a; Dunkle & Cate, Reference Dunkle and Cate2010; Frank & Gonzalez, Reference Frank and Gonzalez2010; Milon & Rodnina, Reference Milon and Rodnina2012; Rodnina & Wintermeyer, Reference Rodnina and Wintermeyer2001a), so we will not go into too much detail, especially the structural aspects. Instead, we will highlight a few recent single-molecule and dynamic studies that underscores the heterogeneous nature of translation.
Briefly, the prokaryotic translation cycle is separated into four phases: initiation, elongation, termination, and recycling; it is much simpler than its eukaryotic counterpart. During initiation, three initiation factors IF1, IF2, and IF3 help guide the recruitment of the 30S subunit and initiator fMet-tRNAfMet to the right start AUG start codon, as defined by an upstream Shine-Dalgarno (SD sequence), positioning the fMet-tRNAfMet and AUG codon to the P site. The proper and stable joining of 50S subunit marks the transition to the elongation phase. The tRNA cognate to the next mRNA codon in the A site arrives, in complex with elongation factor Tu (EF-Tu) and GTP. After selection and proofreading, the tRNA accommodates in the A site, followed rapidly by peptide bond formation with the P-site tRNA, transferring the nascent peptide from the P-site tRNA to the A-site tRNA. The ribosome is now in the pre-translocation state (PRE), when the ribosome is in an ‘unlocked’ state with the global conformation in the rotated state, with the A- and P-site tRNAs fluctuating between a classical (A/A, P/P) and hybrid (A/P, P/E) conformation and multiple spontaneous conformational rearrangements of the ribosome (most notably the L1 stalk and portions of the 30S subunit). These represent possible intermediates in translocation. Subsequently, elongation factor G (EF-G) binds to the A site and catalyzes the translocation of the two tRNAs and mRNA by one codon, returning the ribosome to the ‘locked’ post-translocation state (POST), where fluctuations in the ribosome are limited. This cycle continues until the ribosome reaches a stop codon defined by UAA, UAG, or UGA. These stop codons are recognized by release factor 1 and 2 (RF1 and RF2), which catalyzes the release of the nascent peptide. Release factor 3 (RF3) promotes the release of RF1/2, after which the subunits and the remaining P-site tRNA are dissociated through the combined action of recycling factor (RRF) and EF-G, and the subunits can be recycled for another round of translation.
Many details of this textbook process are still unknown, in particular the roles of IF1 and IF3, mechanism of translocation, and steps during recycling and re-initiation. As discussed above, this simple and linear pathway is likely an oversimplification; a better representation for translation would be a complex energy landscape with multiple and alternative pathways.
2.1 Controlling initiation efficiency through initiation factors and mRNA
The goal of translation initiation is to select an mRNA, recognize the correct start codon, and assemble an elongation-competent 70S ribosome with an initiator tRNA in the P site. Translational control during initiation is especially important, since misregulation would result in the cell wasting energy on synthesizing aberrant proteins. In prokaryotes, initiation is guided by three initiation factors IF1, GTPase IF2 and IF3. In prokaryotes, mRNA is directly recruited to 30S subunits via interactions between the SD sequence (typically GGAGG) in the 5′-untranslated region (5′ UTR) of the mRNA and complimentary sequence in 3′ end of 16S rRNA. The SD sequence is positioned 5–9 nucleotides upstream of the AUG start codon. This positions the AUG codon either directly or near the P site, where it is recognized by initiator tRNA fMet–tRNAfMet. The strength of the SD interaction correlates modestly with the efficiency of initiation. The difference between the optimal (+7) distance between AUG and SD further defines the efficiency of initiation. The process is guided by IF1 and IF3, further discriminating against weak SD sequences and allowing translation of mRNAs with sub-optimally positioned SD. This creates a flat energy landscape for initiation that could be tilted by factor concentration, allowing the regulated expression of the selected mRNAs. Thus, the SD sequence is an important, although not essential, regulatory element defining the translation of the mRNA in bacteria. Other features, such as secondary structures near the initiation site that block access of the 30S subunit, also play a role in initiation efficiency.
In the first stage of initiation, initiation factors, fMet-tRNAfMet, and mRNA are recruited to the 30S subunit to form a 30S pre-initiation complex (30S PIC). IF1 stabilizes the binding of IF2 and IF3 to the 30S subunit and modulates the selection of mRNA and fMet-tRNAfMet by controlling the conformational dynamics of the 30S subunit. IF2 is a GTPase that binds fMet-tRNAfMet with micromolar affinity, playing a key role in the recruitment of fMet-tRNAfMet to the 30S PIC and in regulating the formation of the 70S complex. IF3 has several functions: it interferes with ribosomal subunit joining to ensure proper 70S formation and ensures the fidelity of translation initiation (Milon & Rodnina, Reference Milon and Rodnina2012). A recent single-molecule study that introduced donor and acceptor fluorophores in the N-terminal domain and C-terminal domain, allowing for FRET between the two domains, showed that IF3 fluctuated between three conformations: a compact state, intermediate state, and an extended state (Elvekrog & Gonzalez, Reference Elvekrog and Gonzalez2013). For incorrect initiation complexes (for example, without a tRNA or with an incorrect tRNA), IF3 is strongly shifted towards the extended or intermediate conformation, which is not conducive to rapid 50S joining. For correctly assembled 30S IC, IF3 predominately occupies the compact conformation, which is conducive to rapid 50S subunit joining. However, this is also modulated by the presence of IF2 and IF1. Thus, IF3 provides a strong kinetic selection for the correct initiator tRNA, demonstrating a kinetic partitioning mechanism for initiation. Structural data on the pre-initiation complex with the initiation factors are still currently lacking, and the exact role of IF1 and IF3 still remains to be determined. However, it is clear that the efficiency of initiation is regulated through the actions of all three initiation factors.
2.2 Heterogeneous pathways during initiation
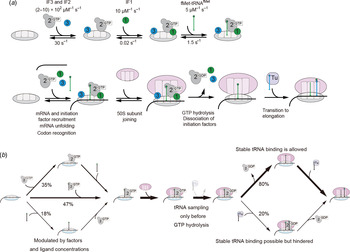
The timing of key initiation events is a factor in translational control Initiation factors can bind to the 30S subunit independently, so this suggests a heterogeneous pathway towards 30S PIC assembly. Yet recent kinetic data showed different arrival rates for the initiation factors, suggesting a preferred route in the non-linear assembly landscape, with IF3 and IF2 the first to bind to the 30S subunit, followed by IF1 and finally by fMet-tRNAfMet (Milon et al. Reference Milon, Maracci, Filonava, Gualerzi and Rodnina2012). The 30S–IF3–IF2 complex is short lived, but it is stabilized by the recruitment of IF1. The arrival of the mRNA, the initiation factors, and fMet-tRNAfMet all represent checkpoints for initiation. However, the exact timing for the arrival of each factor still needs to be examined.
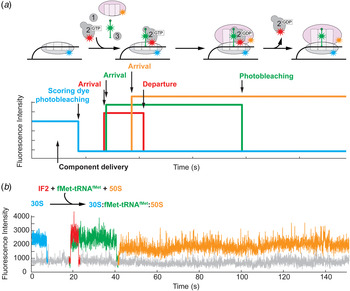
Single-molecule fluorescence with ZMWs can parse compositional dynamics. The order of IF2 and fMet-tRNAfMet arrival to the 30S subunit has been directly observed (Tsai et al. Reference Tsai, Petrov, Marshall, Korlach, Uemura and Puglisi2012) (Fig. 6). Various modes of fMet-tRNAfMet and IF2 arrival are possible, one of the ligands may arrive first, recruiting or permitting binding of the second one; both ligands may arrive simultaneously; or the order of arrival may be stochastic. By delivering the mixture of fluorescently labeled fMet-tRNAfMet, IF2 and 50S to immobilized 30S–mRNA complex, the relative timing of IF2 and fMet-tRNAfMet arrival was directly observed as a sequence of differentially colored fluorescent pulses. The order of the fMet-tRNAfMet and IF2 arrival was found to be stochastic, with all possible sequences of the arrival events being permitted. The percentage of the simultaneous IF2 and fMet-tRNAfMet arrival events increased at higher ligand concentration reflecting increased formation of the ternary complex at nearly physiological concentrations of IF2 and tRNA. IF1 and IF3 were found to regulate the process, disfavoring the pathway where fMet-tRNAfMet was the first ligand to arrive, in agreement with bulk biochemical studies that demonstrated these factors destabilize fMet-tRNAfMet in the 30S PIC and increase the affinity of IF2 to the 30S ribosomal subunit. Thus, the order of IF2 and initiator tRNA arrival does not strictly follow a defined sequence, and is controlled by IF2 and tRNA concentrations and the presence of other initiation factors (see Fig. 7). Although at low concentrations the order of arrival is stochastic, in the presence of IF1 and IF3 and at high ligand concentrations simultaneous arrival is most prevalent mechanism. However, this study is blind to the arrival and departure of IF1 and IF3, and more studies are required to elucidate the exact mechanisms of IF1 and IF3 and the interplay among the three factors.
Compositional dynamics during initiation using ZMWs. (a) Schematic of multi-color tracking of fluorescently-labeled ligands binding and departing from surface-immobilized ribosomes on ZMWs. The presence of single immobilized ribosome complexes can be identified by the scoring dye, which subsequently photobleaches. Arrival of fluorescentlylabeled ligands to the ribosome is manifested through the appearance of fluorescent pulses of the corresponding color. Disappearance of the pulse indicates either departure of the fluorescent ligand or photobleaching, which can be statistically distinguished by the lifetime of the dye. (b) Example trace of timing of IF2 and initiator tRNA binding. 30S mRNA initiation complexes were immobilized in zero-mode waveguide (ZMW) wells. The presence of single 30S complexes was identified by Alexa488 fluorescence of labeled small ribosomal subunits (blue), which photobleaches rapidly on start of observation due to the short photobleaching lifetime of the Alexa488 dye. Cy5-labeled IF2 (red), Cy3-labeled fMet-tRNAfMet (green), and Cy3·5 50S subunits (yellow) allow direct observation of molecular events during initiation. In this example trace, IF2 and tRNA arrive simultaneously and then IF2 and tRNA signals disappear due to photobleaching as both ligands are required for subsequent stable 70S complex formation. The initiation is finalized by stable arrival of 50S. Modified with permission from (Tsai et al. Reference Tsai, Petrov, Marshall, Korlach, Uemura and Puglisi2012).

Heterogeneous pathways during initiation. (a) Kinetically favored recruitment pathway for initiation factors and fMet-tRNAfMet. IF3 and IF2 are the first to bind to the 30S subunit, followed by IF1 and fMet-tRNAfMet (Milon et al. Reference Milon, Maracci, Filonava, Gualerzi and Rodnina2012). The arrival of the mRNA and initiation factors is followed by 50S subunit joining, transitioning to the 70S initiation complex. GTP hydrolysis and dissociation of initiation factors transition the initiation complex to elongation. (b) Multiple pathways are possible to reach the important stages of initiation as the ribosome converges to an elongation-competent 70S initiation complex. Concentrations of initiation factors, tRNAs and ribosomal subunits all modulate the flux through the possible pathways that lead to successful initiation. After the 30S subunit binds to the mRNA, IF2 has a central role in channeling the ribosome towards elongation. At physiological concentrations of initiation factors and tRNAs, the majority of 30S PICs may be formed by IF2 bringing in the initiator tRNA to the 30S. IF2 also guides rapid and stable 50S subunit joining, while GTP hydrolysis by IF2 and its departure from the ribosome gates the stable binding of the first elongator tRNA (Tsai et al. Reference Tsai, Petrov, Marshall, Korlach, Uemura and Puglisi2012). Thus, instead of a linear view as presented in part A, initiation should be viewed as heterogeneous pathways that diverge and converge on key intermediates.

IF2 promotes 50S subunit recruitment, which triggers GTP hydrolysis by IF2. IF2–GDP has low affinity for the 70S ribosome and rapidly dissociates resulting in a 70S particle competent to bind the first elongator tRNA to begin first round of elongation. Upon 50S subunit binding, the 70S ribosome is in a global rotated state as observed by X-ray crystallography (Zhang et al. Reference Zhang, Dunkle and Cate2009). GTP hydrolysis triggers an intersubunit movement similar to the conformational movement that governs the elongation cycle, during which the body domain of the 30S subunit rotates by ~6° with respect to the 50S, resulting in a non-rotated conformation for the ribosome, ready to decode the first elongation codon. The movement was directly observed using intersubunit single-molecule FRET (Marshall et al. Reference Marshall, Aitken and Puglisi2009). This signals the transition from initiation to elongation. Throughout the initiation pathway, the mRNA is progressively stabilized on the ribosome, with the addition of initiator tRNA, IF2, and 50S subunit, as determined by single-molecule optical tweezer experiments (Masuda et al. Reference Masuda, Petrov, Iizuka, Funatsu, Puglisi and Uemura2012). The SD sequence interactions contribute significantly to the stability of the ribosomal complex on the mRNA. After the formation of the first peptide bond during elongation, the SD interaction is destabilized (Uemura et al. Reference Uemura, Dorywalska, Lee, Kim, Puglisi and Chu2007), resulting in the weakening of the force with which the ribosome grips an mRNA. This might be an important requirement to facilitate elongation and the movement of the ribosome along mRNA during the first translocation step.
2.3 Non-canonical initiation by non-SD-led and leaderless mRNAs
The 5′ UTR of a mRNA greatly affects prokaryotic initiation efficiency, as determined by the SD sequence and secondary structures (Milon & Rodnina, Reference Milon and Rodnina2012). However, ~40% of E. coli mRNAs, and many archaea mRNAs, lack the SD sequence. This implies that other mechanisms should be at play in these organisms that govern mRNA selection and start codon selection. Little is known regarding the initiation of these non-SD-containing mRNAs, except that they form stable complexes with the 30S subunit and that the start codon AUG may be an important recognition element. One example of a non-SD-led mRNA in E. coli is rpsA, which codes for protein S1. Furthermore, another class of mRNAs is leaderless mRNAs (Moll et al. Reference Moll, Grill, Gualerzi and Blasi2002), where the start codon is positioned directly at 5′ end or few nucleotides downstream of the 5′ end and binds directly to 70S ribosomes. In E. coli leaderless mRNAs are generated as part of stress response mechanism leading to the activation of MazF endonuclease (Vesper et al. Reference Vesper, Amitai, Belitsky, Byrgazov, Kaberdina, Engelberg-Kulka and Moll2011). MazF specifically cleaves at ACA sequence in non-structured regions, which degrades mRNA and cleaves 16S rRNA between codons 1499 and 1500, resulting in 30S ribosomes lacking an anti-SD sequence. The YfiD mRNA is cleaved by MazF resulting in transcripts that have AG dinucleotide 5′ UTR. This mRNA is efficiently translated by the ribosomes lacking anti-SD sequences via an unknown mechanism. Notably, these modified ribosomes preferentially translate leaderless mRNAs, thus it was suggested that 5′-UTR may be inhibitory for initiation in the absence of SD interactions. These non-canonical initiation pathways expand the repertoire of ribosomal regulation mechanisms during initiation, and demonstrate how covalent modification of ribosomes, in this case cleavage of rRNA, can shift the selection of distinct pathways.
2.4 Selection and kinetic proofreading in tRNA accommodation
The first step during elongation requires the ribosome to select the correct aa-tRNA in ternary complex with EF-Tu–GTP (elongation factor-Tu) corresponding to the mRNA codon being decoded. For the maintenance of fidelity in the decoding of the aa-tRNA, the cognate codon of the mRNA has to be recognized correctly by the anticodon of the tRNA, leading to the selection of the tRNA and incorporation of the correct amino acid into the growing peptide chain, while rejecting the incorrect tRNAs (Agirrezabala & Frank, Reference Agirrezabala and Frank2009). The ribosome must maintain high accuracy (error rate of 5 × 10⁻³) in balance with elongation speed (Johansson et al. Reference Johansson, Zhang and Ehrenberg2012); a reduction in either can lead to cell death. Decoding through only Watson–Crick base-pairing of the mRNA codon and tRNA anticodon is not sufficiently specific allowing only discrimination of cognate and non-cognate aa-tRNAs due to the large difference in free energy of binding (ΔG), but not cognate and near-cognate tRNAs (ΔG < 3 kcal mol−1) (Rodnina & Wintermeyer, Reference Rodnina and Wintermeyer2001a). For the ribosome to achieve high accuracy in decoding (5 × 10⁻³) (Parker, Reference Parker1989), a kinetically driven mechanism is involved in tRNA selection (Blanchard et al. Reference Blanchard, Gonzalez, Kim, Chu and Puglisi2004a; Gromadski & Rodnina, Reference Gromadski and Rodnina2004; Hopfield, Reference Hopfield1974; Ninio, Reference Ninio1975; Rodnina & Wintermeyer, Reference Rodnina and Wintermeyer2001a). In this model, tRNA selection is achieved through two steps: an initial selection and a proofreading step separated by GTP hydrolysis; this allows the ribosome and tRNA to sample the free energy landscape twice for higher accuracy, and uses ribosomal contacts to enhance decoding specificity.
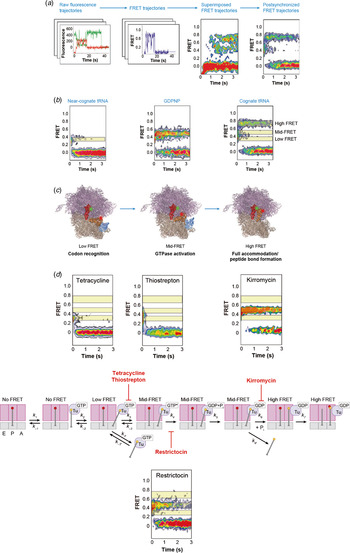
At the beginning of an elongation cycle, the ribosome has a P-site tRNA stably bound to the ribosome and an empty A site, awaiting the arrival of the next tRNA. In a single-molecule FRET study between initiator fMet-tRNAfMet in the P site and elongator Phe–tRNAPhe–EF-Tu–GTP arriving to the A site (Blanchard et al. Reference Blanchard, Gonzalez, Kim, Chu and Puglisi2004a) (Fig. 8), tRNA selection and accommodation to the empty A site is monitored. During the first stage of initial binding, when the tRNA ternary complex arrives, it is initially guided by the protein–protein interaction of the L7/L12 proteins on the 50S subunit with EF-Tu (lifetime ~40 ms) (Pape et al. Reference Pape, Wintermeyer and Rodnina1998). In the subsequent codon recognition stage, both cognate and near-cognate anticodon loop on the tRNA comes into contact with the codon on the mRNA in the 30S subunit A site. Here, the tRNA is in the so-called ‘A/T’ state and initial selection occurs where the codon–anticodon interaction is checked to determine if the tRNA is cognate to the codon. tRNAs that are not cognate to the next codon on the mRNA only very briefly sample this state (lifetime <40 ms) and then dissociate from the A site.
Single-molecule tRNA FRET dynamics. (a) Donor (green) and acceptor (red) fluorescence intensity traces were collected from hundreds of individual ribosome complexes containing Cy3-labeled fMet-tRNAfMet in the P site and delivered Cy5-labeled Phe-tRNAPhe to the A site. Calculated fluorescence resonance energy transfer (FRET, blue) traces were subsequently superimposed to visualize ensemble behavior. Post-synchronization to the initial appearance of FRET revealed the chronological trajectory of FRET changes as a density heat map. (b) Post-synchronized color overlays under various conditions identified three distinct FRET states. Near-cognate tRNA results in a low FRET state (codon recognition). GDPNP (a non-hydrolyzable analog of GTP) results in a medium FRET state (GTP activation and hydrolysis). Cognate tRNA quickly transitions to the high FRET state. (c) Interpretation of FRET trajectories in the context of high-resolution structural data provides a dynamic model for tRNA selection. (d) Inhibitors of tRNA selection. Both tetracycline and thiostrepton were shown to inhibit initial tRNA selection. Tetracycline inhibits progression to the GTPase-activated state. Thiostrepton may bind at the GTPase activation center, in competition with the ternary complex. Restrictocin, an enzyme shown to cleave the sarcin-ricin loop, slows GTP hydrolysis. Kirromycin interferes with tRNA accommodation, likely by inhibiting conformational changes in EF-Tu. Modified with permission from (Blanchard et al. Reference Blanchard, Gonzalez, Kim, Chu and Puglisi2004a) and (Marshall et al. Reference Marshall, Dorywalska and Puglisi2008).

For cognate tRNA, the correct codon–anticodon interactions induce a local conformational change in the A site of the small subunit, destacking two adenines (A1492 and A1493) in the decoding site within helix 44 (h44) of the 16S rRNA so that the bases are in an orientation to interact with the codon-anticodon helix formed by tRNA–mRNA in the A site (Ogle et al. Reference Ogle, Brodersen, Clemons, Tarry, Carter and Ramakrishnan2001; Schmeing et al. Reference Schmeing, Voorhees, Kelley, Gao, Murphy, Weir and Ramakrishnan2009; Zeng et al. Reference Zeng, Chugh, Casiano-Negroni, Al-Hashimi and Brooks2014). These interactions stabilize the tRNA in the A site to position the ternary complex and allow time for appropriate contact between EF-Tu and the GTPase activation center on the large subunit. Upon GTPase activation, tRNA is further inserted into the A site; this is the selection step at which the ratio of cognate to near-cognate tRNA that advance is up to 10:1 (Rodnina & Wintermeyer, Reference Rodnina and Wintermeyer2001a).
Subsequent GTP hydrolysis by EF-Tu changes the conformation of EF-Tu, decreasing the affinity of the factor both aa-tRNA and the ribosome. After phosphate and EF-Tu release, the 3′ end of aa-tRNA accommodates at the PTC, with the tRNA fully in the A site of both subunits. This involves the formation of specific interactions of C75 and A76 of tRNA with residues in the A loop of 23S rRNA, and probably conformational rearrangements in the active site of 23S rRNA for efficient catalysis of peptidyl transfer. This stage is the second proofreading step in tRNA selection, offering a final chance to reject the tRNA if it is incorrect where cognate aa-tRNA is preferentially incorporated at the PTC over near-cognate aa-tRNA by a ratio of roughly 100:1. This completes a tRNA selection and accommodation cycle, which occurs within 100 ms after initial binding of a cognate tRNA. This two-stage selection mechanism before tRNA accommodation (initial selection gated by EF-Tu GTPase activation and secondary selection by proofreading) improves selection accuracy by amplifying the increase in tRNA stability from correct codon–anticodon interactions compared with incorrect codon–anticodon pairs to ensure faithful expression of the genetic information. In other words, the rates for GTPase activation during initial selection and accommodation during proofreading are much higher for cognate tRNA than near-cognate tRNA (Rodnina & Wintermeyer, Reference Rodnina and Wintermeyer2001a).
2.5 Spontaneous conformational dynamics during the ‘unlocked’ PRE state
The chemistry of peptide bond formation represents the next irreversible step in protein synthesis. Immediately after tRNA accommodation, both the P-site and the A-site tRNA are completely bound in their respective ribosomal sites in the classical conformation state (denoted as A/A–P/P), with very little tRNA conformational fluctuations. Peptide bond formation takes place rapidly, transferring the polypeptide chain from P-site to A-site tRNA, bringing the ribosome to the PRE state. The catalytic mechanism for peptide bond formation involves positioning of the substrates, decreasing the entropy of activation, and creating an appropriate electrostatic and solvent environment for chemistry. The active site of the PTC is constructed entirely of RNA.
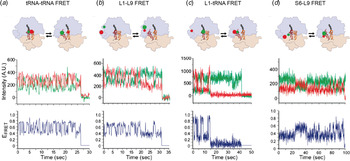
After peptidyl transfer, the tRNAs can adopt hybrid conformations where their anticodon loop is still in its original site in the small subunit but the other parts of the tRNA have moved into the next site in the large subunit (denoted as A/P–P/E) (Agirrezabala et al. Reference Agirrezabala, Lei, Brunelle, Ortiz-Meoz, Green and Frank2008; Dunkle et al. Reference Dunkle, Wang, Feldman, Pulk, Chen, Kapral, Noeske, Richardson, Blanchard and Cate2011). Single-molecule FRET studies have shown that the tRNAs fluctuate spontaneously between the classical state and hybrid states (2–5 s−1) (Fig. 9) (Blanchard et al. Reference Blanchard, Gonzalez, Kim, Chu and Puglisi2004a, Reference Blanchard, Kim, Gonzalez, Puglisi and Chub; Kim et al. Reference Kim, Puglisi and Chu2007), and identified at least two distinct hybrid states in subsequent single-molecule tRNA–tRNA FRET studies (H1 and H2) (Munro et al. Reference Munro, Altman, O'CONNOR and Blanchard2007). This second identified hybrid state may represent tRNA conformations where only the P-site tRNA has partially fluctuated into the next site (A/A–P/E).
Conformational dynamics within pre-translocation complexes. (a) Above: Cartoon representation of PRE complexes labeled at different positions. The approximate positions of the donor and acceptor fluorophores corresponding to each donor–acceptor labeling scheme are shown as green and red spheres, respectively. Below: donor (green)/acceptor (red) intensity traces and FRET (blue) traces versus time trajectories derived from PRE complexes undergoing thermally activated fluctuations. tRNA dynamics using FRET between P-site tRNA and A-site tRNA shows spontaneous fluctuations between 0·74 FRET (classical state) and 0·45 FRET (hybrid state). (b) L1 stalk dynamics using between Cy3-labeled L1 stalk and Cy5-labeled ribosomal protein L9 shows fluctuations between 0·56 FRET (open L1 stalk conformation) and 0·34 FRET (closed L1 stalk conformation). (c) Fluctuating contacts between the Cy5-labeled L1 stalk and Cy3-labeled P-site tRNA. The L1-tRNA signal fluctuates between 0·21 (open L1 stalk not interacting with P/P-configured tRNA) and 0·84 (closed L1 stalk interacting with P/E-configured tRNA). (d) Local inter-subunit rotation using ribosomal proteins S6 and L between 0·56 FRET (non-rotated) and 0·40 FRET (rotated). Excerpted with permission from (MacDougall & Gonzalez, Reference MacDougall and Gonzalez2011).

The next major step during elongation after the ribosome incorporates the correct aa-tRNA is translocation, the process of moving the tRNAs from the A and P sites to the P and E sites, respectively, and the mRNA exactly by one codon (~30 Å); the process is catalyzed by a GTPase EF-G. The dynamic nature of the tRNAs when the ribosome is in the pre-translocation state plays an important role in finding the right conformation for the tRNAs to adopt before translocation. Since translocation involves shifting the P- and A- site tRNAs into the next site, having the tRNAs in the A/P–P/E hybrid state, where the tRNA has already partially moved into the next site, presents a lower energy barrier. All three PRE states are substrates for EF-G; EF-G can enter the sequence of pre-translocation states (classical, H2, and H1) at any stage in order to move the tRNA–mRNA complex to the POST state, although EF-G–GTP prefers to interact with the tRNAs in hybrid positions (Chen et al. Reference Chen, Stevens, Kaur, Cabral, Liu, Wang, Zhang, Rosenblum, Smilansky, Goldman and Cooperman2011a; Munro et al. Reference Munro, Altman, Tung, Sanbonmatsu and Blanchard2010a). Therefore, the ability for tRNAs in the ribosome to fluctuate and freely explore the various states may have a direct impact on how efficiently translocation occurs (Dorner et al. Reference Dorner, Brunelle, Sharma and Green2006).
Multiple local ribosomal conformational fluctuations also occur. A key conformational change is L1 stalk fluctuation of the large subunit (located near the E-site and composed of helices 76–78 of the 23S rRNA and ribosomal protein L1) (Agirrezabala et al. Reference Agirrezabala, Lei, Brunelle, Ortiz-Meoz, Green and Frank2008). The stalk swings by approximately 30° around a pivot point at the base of helix 76 and likely contacts the tRNA in the P/E configuration, and such interaction could be central in guiding the movement of tRNA when the ribosome translocates. A single-molecule FRET study (Fei et al. Reference Fei, Kosuri, Macdougall and Gonzalez2008) reported that the L1 stalk and the P-site tRNA in the PRE state are dynamic and fluctuate between the open and closed states at rates of 2–4 s–1 (Fei et al. Reference Fei, Bronson, Hofman, Srinivas, Wiggins and Gonzalez2009, Reference Fei, Richard, Bronson and Gonzalez2011) (Fig. 9). EF-G binding to the ribosome prevents the fluctuations and shifts the tRNAs into the hybrid conformation and the L1 stalk to the closed state, allowing the L1 stalk to maintain contact to the P-site tRNA for translocation. After translocation, the L1 stalk is relatively static, adopting an intermediate conformation (Cornish et al. Reference Cornish, Ermolenko, Staple, Hoang, Hickerson, Noller and Ha2009); presumably, this allows the E-site tRNA to dissociate freely from the ribosome after translocation has occurred. Thus, the L1 stalk is proposed to function as a gate for the deacylated E-site tRNA, blocking release of the tRNA when it is in the closed position, but enabling dissociation when it is in the open position. However, the L1 stalk is not an essential protein (Sander, Reference Sander1983), and deletion of the L1 stalk gene has no effect on EF-G-dependent translocation.
Global and local rotations of the 30S subunit with respect to the 50S subunit, have been shown to be critical for translocation (Agirrezabala et al. Reference Agirrezabala, Lei, Brunelle, Ortiz-Meoz, Green and Frank2008; Fischer et al. Reference Fischer, Konevega, Wintermeyer, Rodnina and Stark2010; Horan & Noller, Reference Horan and Noller2007; Ratje et al. Reference Ratje, Loerke, Mikolajka, Brunner, Hildebrand, Starosta, Donhofer, Connell, Fucini, Mielke, Whitford, Onuchic, Yu, Sanbonmatsu, Hartmann, Penczek, Wilson and Spahn2010; Zhang et al. Reference Zhang, Dunkle and Cate2009). Previous cryo-EM methods and structural studies showed that the ribosome adopts two intersubunit conformations – the rotated and non-rotated state – that are related by a 6° ratchet-like rotation of the two subunits (Agirrezabala et al. Reference Agirrezabala, Lei, Brunelle, Ortiz-Meoz, Green and Frank2008; Frank & Agrawal, Reference Frank and Agrawal2000; Valle et al. Reference Valle, Zavialov, Sengupta, Rawat, Ehrenberg and Frank2003). In addition to the intersubunit rotation, there is a nearly orthogonal rotation and swivel of the head domain of the 30S subunit that seems to play a role in controlling the position of tRNAs within the ribosome (Ratje et al. Reference Ratje, Loerke, Mikolajka, Brunner, Hildebrand, Starosta, Donhofer, Connell, Fucini, Mielke, Whitford, Onuchic, Yu, Sanbonmatsu, Hartmann, Penczek, Wilson and Spahn2010). The concentration of stronger rRNA–rRNA intersubunit bridges in the center, versus weak, plastic bridges in the periphery favors a rotational motion of the two subunits (Frank et al. Reference Frank, Gao, Sengupta, Gao and Taylor2007; Wang et al. Reference Wang, Rader, Bahar and Jernigan2004). Translocation does not occur if ribosomal proteins belonging to the two subunits and facing each other across the intersubunit space are cross-linked (Horan & Noller, Reference Horan and Noller2007). A smFRET study between ribosomal proteins S6 and L9 probed the rotational state of the 30S head domain and showed a dynamic equilibrium between the two rotational states of the pre-translocated (PRE) ribosome, driven by thermal energy (Cornish et al. Reference Cornish, Ermolenko, Noller and Ha2008; Ermolenko et al. Reference Ermolenko, Majumdar, Hickerson, Spiegel, Clegg and Noller2007), echoing the spontaneous fluctuations of tRNA and L1 stalk as described above (Blanchard et al. Reference Blanchard, Kim, Gonzalez, Puglisi and Chu2004b; Fei et al. Reference Fei, Kosuri, Macdougall and Gonzalez2008) (Fig. 9). Analogous to above, EF-G binding to the ribosome stabilizes the head rotated state. Translocation by EF-G-GTP brings the ribosome back to the POST state and to the head non-rotated state (Cornish et al. Reference Cornish, Ermolenko, Noller and Ha2008; Ermolenko & Noller, Reference Ermolenko and Noller2011). There is a general misconception that the L1 stalk fluctuations, 30S rotation, and tRNA fluctuations are coupled; however, since the rates of fluctuations are different, they are probably only loosely coupled at best.
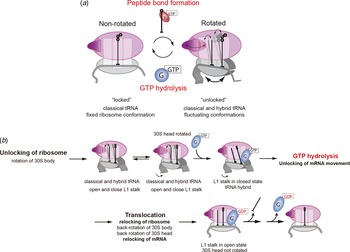
The spontaneous fluctuations of tRNA, L1 stalk, and 30S rotations before peptide bond formation are consistent with the model proposed by Spirin more than four decades ago (Spirin, Reference Spirin1969). In the model, ribosome translocation is controlled by a series of ‘locking’ and ‘unlocking’ events that separate two global conformational states correspondingly termed ‘unlocked’ and ‘locked’. In this original model, the ribosomal subunits are tightly associated before peptide bond formation to facilitate manipulation of the tRNA and preserve reading frame on the mRNA. After peptide bond formation, the ribosome unlocks. In this unlocked state, the ribosomal subunits and tRNA can move more freely, facilitating translocation of the tRNA and stepping to the next codon of the mRNA (Blanchard et al. Reference Blanchard, Kim, Gonzalez, Puglisi and Chu2004b; Cornish et al. Reference Cornish, Ermolenko, Noller and Ha2008). Full translocation returns the ribosome to the locked state, once again restricting the motion of the ribosomal subunits and tRNA. This has been confirmed by cryo-EM (Valle et al. Reference Valle, Zavialov, Sengupta, Rawat, Ehrenberg and Frank2003; Zavialov & Ehrenberg, Reference Zavialov and Ehrenberg2003) and smFRET studies (Aitken & Puglisi, Reference Aitken and Puglisi2010; Dorywalska et al. Reference Dorywalska, Blanchard, Gonzalez, Kim, Chu and Puglisi2005; Marshall et al. Reference Marshall, Dorywalska and Puglisi2008), where peptide bond formation leads to a counterclockwise rotation of the small subunit body domain with respect to the large subunit, from the locked to the unlocked state. In the unlocked state (Chen et al. Reference Chen, Tsai, O'LEARY, Petrov and Puglisi2012a), the 30S body remains rotated, but spontaneous conformational and tRNA fluctuations occur. Then eventual EF-G GTP hydrolysis and translocation leads to the clockwise locking of the ribosome (Marshall et al. Reference Marshall, Dorywalska and Puglisi2008). EF-G arrives more quickly to and dissociates more slowly from the unlocked (rotated) ribosome state than to the locked state; this conformational selection for elongation factors helps to explain the conundrum of why EF-Tu ternary complexes and EF-G do not competitively inhibit each other during translation (Chen et al. Reference Chen, Petrov, Tsai, O'Leary and Puglisi2013c; Richman & Bodley, Reference Richman and Bodley1972). These results seem to be in conflict with what was reported by Cornish et al. where the intersubunit rotations are shown to occur spontaneously driven by thermal energy (Cornish et al. Reference Cornish, Ermolenko, Noller and Ha2008); however, the two studies should be monitoring different conformational rearrangements of the ratcheting trajectory based on the different fluorophore positions (Chen et al. Reference Chen, Tsai, O'LEARY, Petrov and Puglisi2012a). This is consistent with structural studies showing the trajectory begins with a rotation of the 30S subunit body continued with motions of the 30S platform and head domains (Zhang et al. Reference Zhang, Dunkle and Cate2009), underscoring the conformational flexibilities of the ribosome. Since smFRET studies only probe one dimension in a 3D space, more FRET labeling positions are needed to understand fully the conformational landscape of translocation.
The various spontaneous movements of the ribosome in the pre-translocation state underscore the meta-stable energy landscape and the multiple conformational pathways the ribosome can access (Chen et al. Reference Chen, Tsai, O'LEARY, Petrov and Puglisi2012a; Fischer et al. Reference Fischer, Konevega, Wintermeyer, Rodnina and Stark2010; Munro et al. Reference Munro, Sanbonmatsu, Spahn and Blanchard2009), which are important for non-canonical events (see below). However, the two most important events during elongation – peptidyl transfer and translocation – impose a sufficient energy barrier such that the transition is irreversible and that the free energies of peptidyl transfer (~−8 kcal mol−1) and GTP hydrolysis (~−10 kcal mol−1) are used for the global rearrangement of the two subunits. The various conformational rearrangements after peptidyl transfer leading to translocation have been observed structurally, beginning with a rotation of the 30S subunit body, continuing with motions of the 30S platform and head domains, and finishing with the remodeling of the central inter-subunit bridges (Zhang et al. Reference Zhang, Dunkle and Cate2009). A challenge for the future is delineating the chemical mechanism by which bond energies are used to reorganize ribosomal conformations.
2.6 Model for translocation
The various single-molecule and structural studies, especially the recent crystal structures of the ribosome with EF-G in the pre-translocation state, have shed light on the model of translocation. However, the exact mechanism is still unknown. The unlocking of the ribosome rotates the body of the 30S subunit by 6° with respect to the 50S (resulting from peptidyl transfer and a deacylated P-site tRNA) (Marshall et al. Reference Marshall, Dorywalska and Puglisi2008; Valle et al. Reference Valle, Zavialov, Sengupta, Rawat, Ehrenberg and Frank2003), releases the ribosome's conformational flexibility, including the fluctuations of the tRNA between the classical and hybrid states (Blanchard et al. Reference Blanchard, Kim, Gonzalez, Puglisi and Chu2004b), fluctuations of the L1 stalk (Fei et al. Reference Fei, Kosuri, Macdougall and Gonzalez2008), and rotations of various domains of the ribosome (head swiveling and rotations) (Cornish et al. Reference Cornish, Ermolenko, Noller and Ha2008). This allows the ribosome to sample the conformational states along the translocation pathway (Zhang et al. Reference Zhang, Dunkle and Cate2009).
Efficient translocation requires EF-G and GTP hydrolysis. However, spontaneous translocation may proceed, although very slowly, in the absence of EF-G and GTP; with EF-G but no GTP hydrolysis, translocation is promoted, albeit at ~50-fold lower rates than in the presence of GTP hydrolysis (Chen et al. Reference Chen, Petrov, Tsai, O'Leary and Puglisi2013c; Munro et al. Reference Munro, Wasserman, Altman, Wang and Blanchard2010b; Rodnina et al. Reference Rodnina, Savelsbergh, Katunin and Wintermeyer1997). This indicates that translocation is an inherent property of the ribosome; the dynamic nature and labile architecture of the ribosome allows it to sample multiple conformational states. EF-G remodels the energy landscape of the ribosome in such a way that energy barriers are lowered and translocation can occur rapidly.
EF-G can bind to the ribosome in any of the pre-translocation states to promote translocation: with the tRNAs in the classical state, or the hybrid H2 or H1 states (Chen et al. Reference Chen, Stevens, Kaur, Cabral, Liu, Wang, Zhang, Rosenblum, Smilansky, Goldman and Cooperman2011a). Yet the hybrid state, rotated, ribosomal complex is probably the preferred substrate for EF-G. Binding of EF-G stabilizes the swiveled position of the small subunit head (rotation of the head by about 18 Å toward the E site) and the transition to the hybrid tRNA configuration and closed L1 stalk. The initial binding of EF-G in its GTP form causes domain IV of EF-G to contact h44 and the head of the small subunit. This is accompanied by a bending movement of the tip of h44 toward the P site by 8 Å and the stabilization of the swiveled position of the small subunit head and the transition to the hybrid tRNA configuration, as well as the closed form of the L1 stalk. The head moves about the neck of the 30S subunit in the direction of the E site, opening up the ‘gate’ formed by nucleotides G1338 and U1341 and nucleotide A790 between the P and E sites and the head and shoulder of the small subunit (Taylor et al. Reference Taylor, Nilsson, Merrill, Andersen, Nissen and Frank2007). This increases the distance between A790 in the body and A1339 in the head of the 30S subunit from ~18 to 26 Å, creating the space required for translocation. This is likely the ‘unlocking’ step proposed by many kinetic experiments (Savelsbergh et al. Reference Savelsbergh, Katunin, Mohr, Peske, Rodnina and Wintermeyer2003; Stark et al. Reference Stark, Rodnina, Wieden, van Heel and Wintermeyer2000).
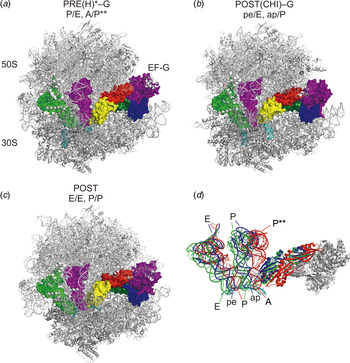
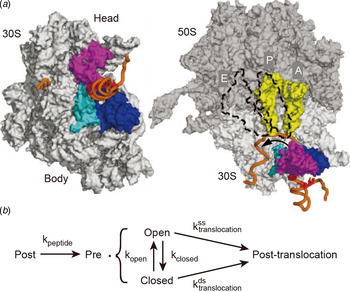
Initial binding of EF-G–GTP to the A site results in a conformational change in not only the ribosome, but also the EF-G, which involves a hinge-like movement of the C-terminal domains (III, IV, and V) with respect to the N-terminal domains (I, II, and G’). This moves the tip of domain IV by ~40 Å. Loop I from the tip of domain IV inserts into the minor groove of the codon–anticodon helix of the A site, and loop II inserts into the minor groove of h34 of 16S rRNA in the head of the 30S subunit. The resulting swiveling of the head domain shifts the P-site tRNA anticodon domain into a chimeric position between the P and E sites on the 30S subunit, called the pe/E chimeric state (and another pe*/E state), and similarly the ap/P state for the A-site tRNA (Ratje et al. Reference Ratje, Loerke, Mikolajka, Brunner, Hildebrand, Starosta, Donhofer, Connell, Fucini, Mielke, Whitford, Onuchic, Yu, Sanbonmatsu, Hartmann, Penczek, Wilson and Spahn2010). This translocation intermediate was recently crystallized by stabilizing EF-G with non-hydrolyzable GTP analogs (Pulk & Cate, Reference Pulk and Cate2013; Tourigny et al. Reference Tourigny, Fernandez, Kelley and Ramakrishnan2013; Zhou et al. Reference Zhou, Lancaster, Donohue and Noller2013). The closure of the L1 stalk comes in contact with the P/E (or pe/E) state tRNA to guide the eventual translocation (Bock et al. Reference Bock, Blau, Schroder, Davydov, Fischer, Stark, Rodnina, Vaiana and Grubmuller2013). GTP hydrolysis (and Pi release) of EF-G results in further rearrangements of which the tip of domain IV moves by another ~6·6 Å. This may cause back-swivel and back-rotation of the 30S head and body domains (either simultaneously or sequentially), which finally translocates the tRNA–mRNA complex by the remaining distance that separates the ribosomal-binding sites (Ermolenko & Noller, Reference Ermolenko and Noller2011; Guo & Noller, Reference Guo and Noller2012). The exact mechanism of this step remains a mystery, but the role of EF-G should be a combination of an active push of the A-site tRNA, conformational back-ratcheting of the ribosome, or a ‘door stop’ that restricts the backward movement of the tRNA. The release of EF-G-GDP returns the ribosome to the POST state, with the opening of the L1 stalk and the dissociation of the E-site tRNA (see Figs 10 and 11).
Conformational selection and mechanism of ribosomal elongation. (a) The two global conformations of the ribosome (rotated and nonrotated) are regulated by peptide bond formation and EF-G–GTP hydrolysis and allow the ribosome to selectively bind tRNA–EF-Tu– GTP or EF-G–GTP. (b) The ribosome is separated into two global conformations: the unlocked state and the locked state. Upon peptide bond formation, the ribosome is unlocked (by the rotation of the 30S body), triggering fluctuations of the L1 stalk between open and closed states and of tRNAs between the classical and hybrid states as well as spontaneous rotations in the 30S head domain. EF-G–GTP binding then stabilizes the L1 stalk in the closed state and tRNA in the hybrid state and causes the head of the 30S subunit to rotate. GTP hydrolysis by EF-G unlocks mRNA movement, which is followed by translocation of tRNAs to the P and E sites (driven by back-rotation of the 30S body and head domains) and relocking of the ribosome and mRNA movement to preserve the reading frame. The E-site tRNA and EF-G–GDP depart rapidly, returning the ribosome to the original state.

Structures of ribosome during pre-translocation and post-translocation intermediates. (a) Structure of tRNAs and EF-G in PRE, early POST, and late POST states. Arrangement of EF-G and tRNAs in PRE. Peptidyl-tRNA is present in an intermediate A/P state, deacylated tRNA in the P/E hybrid state. (b) Structure of EF-G and tRNAs in chimeric ap/P and pe/E states in an early POST state stabilized by fusidic acid. (c) Structure of a POST complex stabilized by fusidic acid. (d) Overlay of tRNAs and EF-G from the structures displayed in panels (a)–(c). Excerpted with permission from (Holtkamp et al. Reference Holtkamp, Wintermeyer and Rodnina2014).

EF-G uses GTP hydrolysis to traverse the energy barrier of translocation, which may occur through a power stroke mechanism (directional force that drives tRNA–mRNA forward) or a Brownian ratchet mechanism (biasing the intrinsic Brownian motion of the ribosome). There remain contradictory reports regarding which mechanism is used (Liu et al. Reference Liu, Kaplan, Alexander, Yan, Wen, Lancaster, Wickersham, Fredrik, Noller, Tinoco and Bustamante2014a; Yao et al. Reference Yao, Li, Tsai, Xu and Wang2013). One report found that the ribosome together with EF-G and GTP can generate significant mechanical force during translocation (at almost 90 pN) (Yao et al. Reference Yao, Li, Tsai, Xu and Wang2013). In another single-molecule optical tweezer study, it was found that the mechanical force generated is only 13 pN, supporting the Brownian ratchet mechanism (Liu et al. Reference Liu, Kaplan, Alexander, Yan, Wen, Lancaster, Wickersham, Fredrik, Noller, Tinoco and Bustamante2014a). It is likely that the translocation process is probably a mixture of the two mechanisms, as apparent from the conformational changes of EF-G and the ribosome upon GTP hydrolysis in support of power stroke and the rectification by domain IV of EF-G into the A site and intercalation of two conserved bases of 16S rRNA of the mRNA. Thus, EF-G combines different energy sources to change the energy landscape of ribosomal complexes during translocation.
2.7 Direct tracking of ribosome elongation dynamics: from one round to multiple rounds
Translational regulation is often controlled by special mRNA sequences and structures, funneling the ribosome down specific pathways as the ribosome navigates the conformational landscape. The study of translational regulation requires the ability to track ribosomes translating over multiple codons and preferably of the translation of sequences encoding real proteins. As discussed above, this is best done observing single translating ribosomes.
Uemura et al. employed new ZMW technology to monitor timing of arrival and departure of tRNAs in real time on the ribosome (Uemura et al. Reference Uemura, Aitken, Korlach, Flusberg, Turner and Puglisi2010). Using fluorescently labeled tRNAs, the appearance of the particular fluorescent pulse signifies the underlying codon being decoded by the ribosome; the identity and order of arrival of elongator tRNAs illustrated directly the sequence-dependent behavior of translation. This allows direct tracking of translation rates at each codon at near-physiological concentrations of factors. However, the limitation of the number of fluorescent dyes with distinct spectral colors as well as the limited number of tRNAs that can be fluorescently labeled makes this method difficult for tracking translation of any mRNA sequence at a codon level (Fig. 12A).
Tracking translation over multiple codons. (a) Tracking translation in ZMWs by tRNA transit. Cy5-labeled Phe-tRNAPhe (red) and Cy2-labeled LystRNALys (blue) ternary complexes are delivered to Cy3-labeled fMet-tRNAfMet initiation complexes (green) translating a mRNA sequence encoding alternating Phe-Lys codons. The pulse sequence decodes the underlying mRNA sequence. Excerpted with permission from (Uemura et al. Reference Uemura, Aitken, Korlach, Flusberg, Turner and Puglisi2010). (b) Cy5-labeled 50S subunits, ternary complexes and EF-G are delivered to surface-immobilized Cy3labeled 30S PICs, permitting the observation of ribosome conformation during multiple rounds of elongation via the intersubunit FRET signal. The arrival of FRET corresponds to 50S subunit joining during initiation and is followed by multiple cycles of high–low–high FRET, each reporting on ribosome unlocking and locking during one round of elongation. The Cy5-50S can be replaced with a nonfluorescent quencher, BHQ-2. The same Cy3 (green) intensity fluctuations can be observed. Excerpted with permission from (Aitken & Puglisi, Reference Aitken and Puglisi2010; Chen et al. Reference Chen, Tsai, Petrov and Puglisi2012b). (c) Substituting the traditional FRET acceptor, Cy5, with BHQ-2 allowed the use of Cy5 to label other translation components for correlation studies. The Cy3 (green) intensity reports on the conformational state of the ribosome, whereas Cy5 pulses (red) indicate arrival, occupancy and departure of ribosomal ligands (for example, EF-G).

Cooperman and co-workers (Rosenblum et al. Reference Rosenblum, Chen, Kaur, Cui, Zhang, Asahara, Chong, Smilansky, Goldman and Cooperman2013), used smFRET between fluorescently labeled tRNAs and ribosomal protein L11 to monitor aa-tRNA binding to the A site. In combination with an appropriately modified cell-free translation system, the authors were able to monitor the global translation of the green fluorescent protein variant Emerald GFP (EmGFP). There are in total 14 Phe residues in the sequence, which can act as ‘landmarks’, allowing them to obtain translation times of different segments of the mRNA in between the Phe residues. The authors found that translation proceeds along the sequence of full-length EmGFP with a variable rhythm, strongly influenced by cognate isoacceptor tRNA abundance. The translation of the full-length protein can be visualized by GFP fluorescence (Uemura et al. Reference Uemura, Iizuka, Ueno, Shimizu, Taguchi, Ueda, Puglisi and Funatsu2008). However, the use of smFRET, instead of direct excitation as in the work by Uemura using ZMWs (Uemura et al. Reference Uemura, Aitken, Korlach, Flusberg, Turner and Puglisi2010), limits the number of components to be monitored to only one; thus, single-codon dynamics cannot be obtained.
Wen et al. (Reference Wen, Lancaster, Hodges, Zeri, Yoshimura, Noller, Bustamante and Tinoco2008) used a suspended dumbbell assay where the ends of an mRNA with a hairpin in the center of its sequence are attached to polystyrene beads (hence called ‘dumbbell’) held by dual beam optical tweezers. The optical tweezers allow application of a stretching force sufficient to hold the mRNA in its linear form, permitting accurate measurement of RNA length, as a distance between two trap centers. The translating ribosome unwinds the RNA hairpin and the resulting increase in mRNA length reports on the ribosome position. This was the first direct dynamic observation of the ribosome movement along mRNA at the single-molecule level. However, this method requires the careful design of the mRNA construct with an artificially long secondary structure and is not applicable to any sequence.
Aitken & Puglisi (Reference Aitken and Puglisi2010) employed an intersubunit FRET signal to monitor the rotational movements of the 30S body with respect to the 50S (unlocking and locking motions), taking advantage of the fact that each round of unlocking (by peptidyl transfer) and locking (by EF-G catalyzed translocation) defines the translation of a single codon to track translation. This repeating cycle of high-low-high FRET transitions was observed over multiple rounds of elongation (Figs 12B and 12C). The advantage of this method is that there are no requirements in the mRNA sequence, so the translation of any mRNA can be followed with codon resolution; in addition, the rates of each substep (peptidyl transfer and translocation) at each codon can be obtained. This method provides a powerful tool to monitor global translational rates at single-codon resolution, for which can be taken advantage of to study many regulatory phenomena. However, this assumes that each conformational cycle corresponds to a codon, which is true in most cases but may not be true in all cases. Furthermore, low signal to noise may result in errors during codon counting.
2.8 Translational regulation by mRNA sequences, secondary structures, and modifications
Protein synthesis by ribosomes takes place at sequence-dependent rates. Despite initial beliefs, tRNA abundance is not the only determinant of elongation rates. mRNAs form secondary structures and have specific sequences (internal SD sequences) that slow down and regulate translation. Recent biophysical and mechanistic studies, using the techniques described above, have uncovered multiple mechanisms controlling the rate of translational elongation.
mRNA secondary structures (either hairpins or pseudoknots) represent a kinetic barrier that lowers the ribosome translation rate, as the ribosome must disrupt structures it encounters in the mRNA at its entry site to allow for translocation to the next codon. Hairpins are common local RNA structural motifs that occur when an RNA chain folds back on itself to pair; pseudoknots are structural elements that are formed when a single-stranded region in the loop of a hairpin base pairs with a stretch of complementary nucleotides elsewhere in the mRNA. Cells take advantage of these secondary structures to regulate translational rates that in turn regulate protein expression levels and co-translational protein folding (Yang et al. Reference Yang, Chen and Zhang2014). As mentioned above, structural elements in the 5′ untranslated region of the mRNA regulate translational initiation by blocking translation until the mRNA unfolds (Marzi et al. Reference Marzi, Myasnikov, Serganov, Ehresmann, Romby, Yusupov and Klaholz2007). In eukaryotic initiation, hairpins, junctions, and pseudoknots play important roles in internal ribosome entry sites (IRES) elements.
Because the diameter of the ribosomal mRNA tunnel (~15 Å) is too small to accommodate double-stranded RNA (~21 Å), any secondary structure in the translating mRNA must be disrupted either before entering the ribosome or at the entry to the tunnel (Yusupova et al. Reference Yusupova, Yusupov, Cate and Noller2001). The ribosome is highly efficient at unwinding helical structure in mRNA, with helicase activity intrinsic to the ribosome (Takyar et al. Reference Takyar, Hickerson and Noller2005). Using optical tweezers, Qu et al. investigated the mechanism of the ribosomal helicase (Qu et al. Reference Qu, Wen, Lancaster, Noller, Bustamante and Tinoco2011). The results indicate that the ribosome utilizes two modes of unwinding, taking advantage of the thermal breathing of the mRNA hairpin between the open-state junction and the closed state. In the first mode, the ribosome binds and interacts preferentially with the open-state of the junction, favoring this state in the thermal fluctuations and allowing the ribosome to translocate through unhindered. Second, it mechanically unwinds the duplex by applying force to the closed state of the junction, using the energy from GTP hydrolysis and translocation to apply force and open the junction. The biochemical characterization of the ribosomal helicase activity suggests that proteins S3, S4, and possibly S5 form the helicase center of the ribosome and compose a tight ring around incoming mRNA (Takyar et al. Reference Takyar, Hickerson and Noller2005). These observations suggest that these proteins may stabilize the open state of the mRNA duplexes, thus participating in the active mechanism (Fig. 13).
Secondary structure unwinding mechanism by the ribosome. (a) Structure of the 30S subunit emphasizing the ring-shaped mRNA entry site formed by the three ribosomal proteins. (b) Proposed ribosome unwinding mechanisms. The ribosome biases junction thermal fluctuations towards opening. When encountering an open junction, translocation rectifies the junction opening events. On encountering a closed junction, the pulling force on the mRNA breaks open the mRNA junction at the entry site. Excerpted with permission from (Qu et al. Reference Qu, Wen, Lancaster, Noller, Bustamante and Tinoco2011).

Interaction of ribosomes with mRNA secondary structures also regulates the conformational dynamics of the ribosome. A recent smFRET paper by Cornish and co-workers (Qin et al. Reference Qin, Yu, Zuo and Cornish2014) showed through intersubunit FRET, that upon encountering a mRNA hairpin, the ribosome is induced into a hyper-rotated state, with reduced frequency of spontaneous head rotations compared with previous study (Cornish et al. Reference Cornish, Ermolenko, Noller and Ha2008). The L1 stalk in this complex, although still dynamic, exists primarily in the open state. The biological significance of this unusual conformation requires further studies, but this state may play a role in regulatory events such as frameshifting and underscores the conformational flexibility of the ribosome.
In another recent single-molecule study, Cooperman and co-workers used a combination of FRET pairs to measure rates of tRNA arrival to the A site, translocation of tRNAs in the 50S subunit, and dissociation of E-site tRNA when the ribosome encounters a variety of hairpins and pseudoknots (Chen et al. Reference Chen, Zhang, Broitman, Reiche, Farrell, Cooperman and Goldman2013a). The authors found that for certain hairpins, both 50S tRNA translocation and E-site tRNA dissociation are slowed, while for other hairpins and pseudoknots slowed only E-site tRNA dissociation. Arrival of the tRNA to the A site is not affected. These results suggest that the ribosome might unwind different secondary structures with slightly different mechanisms and that there is an allosteric interaction of the mRNA-entry channel with the E site that might play certain regulatory roles.
Chen et al. employed a smFRET signal (Chen et al. Reference Chen, Petrov, Johansson, Tsai, O'Leary and Puglisi2014) to monitor the global intersubunit rotation of the 30S body as it rotates upon peptidyl transfer and rotates back upon translocation to track translation. There is a 2- to 3-fold increase in rotated state (pre-translocation) lifetime exactly 3 codons downstream from the P site to the base of the hairpin (when the ribosome first encounters the hairpin). After the first initial encounter, translation rates return to normal. This echoes the optical tweezer work by Qu et al. (Reference Qu, Wen, Lancaster, Noller, Bustamante and Tinoco2011): when the ribosome encounters an open-state junction, translation proceeds at a constant rate; however, when a closed-state junction is encountered, the ribosome actively unwinds the secondary structure, resulting in a slight waiting time for translocation, after which the hairpin is biased by the ribosome into an open-state and translation occurs normally.
In addition to forming secondary structures, certain mRNA sequences also regulate translational rates (Li et al. Reference Li, Oh and Weissman2012). In particular, internal SD sequences base pair with the 3′ end of the ribosomal 16S rRNA (Fluman et al. Reference Fluman, Navon, Bibi and Pilpel2014; Li et al. Reference Li, Oh and Weissman2012) to regulate translation. The work by Chen et al. also showed a 3–4-fold increase in the rotated state (pre-translocation) lifetimes over 3–5 codons downstream of the SD-like sequence, whereas the non-rotated state lifetime remains unaffected. The internal SD-like sequences may base pair with the 3′ end of the 16S rRNA and increase the energy barrier to translocation (Chen et al. Reference Chen, Petrov, Johansson, Tsai, O'Leary and Puglisi2014). As opposed to inhibition by secondary structures, the effects of SD sequences manifest over several codons, probably due to the flexible nature of 16S rRNA–mRNA interactions.
Post-transcriptional modifications of mRNA pose another degree of freedom in encoding genetic information in structure of mRNA. While hundreds of biological RNA modifications exist, only a handful of modifications have been detected in mRNAs. N6-methyladenosine (m6A) is such modification that occurs within the coding region of mRNA for both eukaryotes and prokaryotes (Deng et al. Reference Deng, Chen, Luo, Weng, Ji, Zhou and He2015; Dominissini et al. Reference Dominissini, Moshitch-Moshkovitz, Schwartz, Salmon-Divon, Ungar, Osenberg, Cesarkas, Jacob-Hirsch, Amariglio, Kupiec, Sorek and Rechavi2012; Meyer et al. Reference Meyer, Saletore, Zumbo, Elemento, Mason and Jaffrey2012). The presence of methyltransferase and demethylase, enriched motif, unique topology of the transcriptome for m6A modification, and multiple known cellular functions all points to the importance of m6A modification in regulation of protein synthesis (Dominissini et al. Reference Dominissini, Moshitch-Moshkovitz, Schwartz, Salmon-Divon, Ungar, Osenberg, Cesarkas, Jacob-Hirsch, Amariglio, Kupiec, Sorek and Rechavi2012; Nilsen, Reference Nilsen2014; Niu et al. Reference Niu, Zhao, Wu, Li, Wang and Yang2013). Nuclear magnetic resonance (NMR) study on RNA duplex containing m6A modification revealed that, while m6A and U can form a canonical Watson–Crick base-pairing, it is thermodynamically less stable than base-pairing between A and U (Roost et al. Reference Roost, Lynch, Batista, Qu, Chang and Kool2015). Further, it has been shown that decoding of single base m6A-modified codon with cognate codon is slower than decoding of unmodified codon, where the magnitude of the kinetic slowdown is affected by the modified codon context, such as the position of m6A within in the codon and other bases in that codon (Choi et al. Reference Choi, Ieong, Demirci, Chen, Petrov, Prabhakar, O'Leary, Dominissini, Rechavi, Soltis, Ehrenberg and Puglisi2016). One possible biological mechanism behind m6A modification is through a direct control on rate of translation, which can further modulate dynamics of co-translational processes such as protein folding and nascent chain interaction.
Antibiotics act on translation by perturbing many of the subtle conformational and compositional pathways of translation. Single-molecule dynamics experiments have mapped how disparate drugs stabilize conformational states blocking translocation (spectinomycin and viomycin) (Chen et al. Reference Chen, Petrov, Tsai, O'Leary and Puglisi2013c), inhibit factor binding (thiostrepton), perturb tRNA selection and recycling (tetracyclines, aminoglycosides) (Blanchard et al. Reference Blanchard, Gonzalez, Kim, Chu and Puglisi2004a), alter tRNA dynamics (aminoglycosides) (Tsai et al. Reference Tsai, Uemura, Johansson, Puglisi, Marshall, Aitken, Korlach, Ehrenberg and Puglisi2013), inhibit the PTC (chloramphenicols and others) and perturb the peptide exit tunnel (macrolides). These results, magnified through multiple rounds of protein synthesis on different mRNAs, highlight how small perturbations to individual kinetic steps in translation can have overwhelming effects on the cell.
2.9 Dynamic pathways of translational frameshifting and bypassing
Although the ribosome decodes mRNA accurately, errors still occur with frequency 10−3 to 10−4 per codon. The ribosome may skip forward or backwards on an mRNA, a phenomenon called frameshifting; depending on the direction of the shift, the ribosome may +1 frameshift or −1 frameshift. This causes the ribosome to translate an entirely different amino acid sequence, which could be deleterious of the cell. However, frameshifting allows the cell to encode multiple proteins in one mRNA message, by a process called programmed frameshifting, compacting the genetic code. This allows the cell to tightly control the in-frame and out-of-frame protein product ratios.
Programmed frameshifting is induced and controlled by mRNA sequences and secondary structures. With the correctly spaced combination of a secondary structure (hairpin or pseudoknot), a slippery sequence the motif X XXY YYZ, and (in some prokaryotic cases) an internal SD sequence, there is an increased probability that the ribosome −1 frameshifts, wherein the ribosome shifts one nucleotide backwards into an overlapping reading frame and continues translating a new sequence of amino acids (Tinoco et al. Reference Tinoco, Kim and Yan2013). In bacteria, the dnaX gene in E. coli that codes for two subunits of DNA polymerase consists of a SD sequence, an –A AAA AAG– slippery sequence, and a downstream hairpin. In eukaryotes, the HIV-1 and many viruses also use a programmed −1 frameshift, which usually consists of the slippery sequence and a downstream pseudoknot. For example, frameshifting at the overlap of the gag and pol open reading frames (ORFs) permits expression of the viral Gag–Pol polyprotein and sets a defined cytoplasmic Gag/Gag-Pol ratio optimized for virion assembly and packaging of reverse transcriptase (Jacks et al. Reference Jacks, Madhani, Masiarz and Varmus1988a, Reference Jacks, Power, Masiarz, Luciw, Barr and Varmusb). The prfB gene in E. coli that encodes RF2 is regulated by a +1 frameshift signal (Marquez et al. Reference Marquez, Wilson, Tate, Triana-Alonso and Nierhaus2004), which is controlled by an upstream SD sequence only, with the distance from the SD sequence to the slippery site much shorter than the distance employed in initiation and −1 frameshifting in dnaX.
Despite a decade of biochemical and genetic studies, the mechanism of frameshifting is still poorly understood. Due to the dynamic and transient nature of frameshifting, different groups study the process from a variety of angles and techniques, resulting in several seemingly conflicting observations. There are a variety of models proposed for the mechanism of −1 frameshift and +1 frameshift that are reviewed elsewhere (Tinoco et al. Reference Tinoco, Kim and Yan2013). To summarize, a model has been proposed for several points during the elongation cycle: (1) during accommodation of the A-site tRNA; (2) subsequent to accommodation, but before peptidyl transfer; (3) during EF-G catalyzed translocation; or (4) after translocation but before the next round of elongation. Furthermore, frameshifting has been shown to occur at 1–80% efficiency depending on the system studied; thus, how one particular ribosome will frameshift or not and the pathways taken by the ribosome during the process remains elusive.
In a recent single-molecule study, Chen et al. used smFRET combined with zero-mode waveguide technology to track translation on a mRNA from the dnaX gene (Chen et al. Reference Chen, Petrov, Johansson, Tsai, O'Leary and Puglisi2014) (Fig. 14). Ribosomes that do not frameshift translate through the frameshift site unperturbed; ribosomes that frameshift exhibit a long pause in the body rotated (unlocked) state, with the A site of the ribosome upstream of the slippery sequence A AAA AAG (A site underlined). This places the ribosome exactly where the interactions with the hairpin and SD sequence are most pronounced. This represents the first decision branchpoint in frameshifting. This branchpoint is probably due to the thermal breathing of the mRNA secondary structure and the engagement of the SD sequence, as proposed by Qu et al. (Reference Qu, Wen, Lancaster, Noller, Bustamante and Tinoco2011). When the hairpin is closed and the ribosome requires active unwinding to translocate, the ribosome pauses.
Pathways during ribosomal frameshifting. (a) Schematic of the mRNA from the dnaX gene. The combination of the internal SD sequence, slippery sequence, and downstream hairpin pauses the ribosome over the slippery sequence, inducing a fraction of the ribosomes to slip backwards by one nucleotide (−1) and translate an overlapping reading frame. Below, sample traces of Cy3B (green) fluorescent intensity for frameshifted and non-frameshifted ribosomes. Frameshifted ribosomes exhibit a long pause in the rotated state, whereas non-frameshifted ribosomes translate through unaffected. (b)The first branchpoint during frameshifting is probably due to the stochastic interaction of the ribosome with the hairpin in an open or closed state, and/or formation of the SD and anti-SD pairing, that represent the shunt to either pausing or normal translation. Translocation of the paused ribosomes under the slippery sequence with the tension caused by the hairpin and SD leads to +3 translocation, but uncoupled from reverse ribosomal rotation, creating a non-canonical intermediate in translation (denoted Rotated*). The uncoupled translocation exposes the A site, to which tRNALys and EF-G sample. tRNALys sampling and accommodation to the AAG codon and EF-G action stimulates the ribosome to slip into the −1 frame. Finally, EF-G catalyses the final reverse-rotation, after which the ribosome resumes normal translation. Depending on the system and condition, other pathways probably exist.

During the pause, translocation occurs, but the translocation is now uncoupled with reverse-rotation (usually reverse-rotation is coupled to translocation) (Chen et al. Reference Chen, Petrov, Tsai, O'Leary and Puglisi2013c), probably due to the inhibition by the SD interaction and the hairpin; this forms an intermediate where the ribosome remains in the rotated, unlocked state, but the A site is empty. At this point, the ribosome is positioned with the P and A sites over the slippery sequence (A AAA AAG). During this non-canonical state, tRNA–mRNA interactions and mRNA–ribosome interactions are probably broken and may involve hyper-rotation as recently proposed (Qin et al. Reference Qin, Yu, Zuo and Cornish2014), facilitating the frameshift; the rotated unlocked state is significant since the state has been shown to have weakened ribosome–tRNA–mRNA interactions (Liu et al. Reference Liu, Qureshi and Lee2011; Uemura et al. Reference Uemura, Dorywalska, Lee, Kim, Puglisi and Chu2007; Valle et al. Reference Valle, Zavialov, Sengupta, Rawat, Ehrenberg and Frank2003). Since the A site is open, tRNALys ternary complex and EF-G samples the A site (AAG codon). However, unlike unproductive samplings with very short lifetimes (<100 ms), these events have lifetimes of the order of seconds. Since the anticodon of tRNALys (UUU) binds more stably with AAA than AAG, the simultaneous slippage of the two anticodon–codon interactions in the −1 direction is favored. The repeated sampling of tRNAs to this state during the long pause allows the binding energy of the codon–anticodon pairing to be used to allow slippage while both P- and A-site tRNAs are on the ribosome and redefine the translational frame. During the sampling, the tRNA hybrid state is destabilized to promote the −1 shift (Kim et al. Reference Kim, Liu, Fei, Bustamante, Gonzalez and Tinoco2014), and the P-site tRNA is probably in a ‘distorted’ state (Namy et al. Reference Namy, Moran, Stuart, Gilbert and Brierley2006). The long EF-G events allow the ribosome to return to the non-rotated state after the reading frame is redefined, allowing translation to resume as normal in the −1 frame. Another study using fast kinetics on the −1 frameshift signal with the pseudoknot that came out shortly afterwards by Rodnina and co-workers confirmed the results (Caliskan et al. Reference Caliskan, Katunin, Belardinelli, Peske and Rodnina2014), though with minor differences due to the mechanism of the pseudoknot interactions as opposed to hairpin interactions (Chen et al. Reference Chen, Zhang, Broitman, Reiche, Farrell, Cooperman and Goldman2013a) in addition to studying an eukaryotic frameshift signal on a E. coli system. The rotated state pause also plays a role in +1 frameshift in the prfB gene encoding RF2 (unpublished data), and may be a central feature for translational control. Thus, the non-canonical pause may be a central feature for translational regulation and off-pathway events. Frameshifting is a prime example in which mRNA sequences and structure result in non-canonical events during translation controlling multiple pathways that regulate the production of the final protein products.
As a more extreme example of translational recoding, the gene 60 in T4 phage that encodes a topoisomerase subunit consists of a 50-nucleotide untranslated region where the ribosome bypasses (Herr et al. Reference Herr, Atkins and Gesteland2000a; Huang et al. Reference Huang, Ao, Casjens, Orlandi, Zeikus, Weiss, Winge and Fang1988; Weiss et al. Reference Weiss, Huang and Dunn1990). Programmed frameshifting involves codon–anticodon dissociation and re-pairing in a new frame, and the newly engaged codon overlaps the original reading frame. In bypassing, peptidyl-tRNA anticodon re-pairing is not to an overlapping codon; the ribosome must ‘hop’ a certain number of nucleotides. In gene 60, the 50 nucleotides separate codons 46 and 47, which are in two different ORFs. The ribosome takes off at a GGA (glycine) site at codon 46, and lands at a matching GGA codon 50 nucleotides downstream, while landing to GGG (glycine) codon in the nine nucleotides downstream of take-off site is not observed (Wills et al. Reference Wills, O'CONNOR, Nelson, Rettberg, Huang, Gesteland and Atkins2008). Biochemical, genetic, and mutational analysis have identified the importance of several mRNA signals; the potential hairpins in 5′ and 3′ of the take-off site, the nascent polypeptide signal, and SD-like sequence near the landing site (Herr et al. Reference Herr, Gesteland and Atkins2000b, Reference Herr, Wills, Nelson, Gesteland and Atkins2004; Samatova et al. Reference Samatova, Konevega, Wills, Atkins and Rodnina2014; Todd & Walter, Reference Todd and Walter2013; Weiss et al. Reference Weiss, Huang and Dunn1990). Recent investigation using smFRET have revealed that the mechanism of bypassing involves concerted interactions among nascent polypeptide chain, ribosomal exit tunnel, formation of multiple mRNA secondary structures, and uncoupled translocations in hyper-rotated state resulting in directed scanning of mRNA in search for correct landing site for the P-site tRNA (Chen et al. Reference Chen, Coakley, O'CONNOR, Petrov, O'Leary, Atkins and Puglisi2015). Bypassing may be more common than assumed. For example, the prevalence of ribosome bypassing was demonstrated in mitochondria of the yeast Magnusiomyces capitatus (Lang et al. Reference Lang, Jakubkova, Hegedusova, Daoud, Forget, Brejova, Vinar, Kosa, Fricova, Nebohacova, Griac, Tomaska, Burger and Nosek2014; Nosek et al. Reference Nosek, Tomaska, Burger and Lang2015).
2.10 Role of E-site tRNA and correcting errors by back-translocation
After a round of elongation, the P-site tRNA is moved into the E site, where the tRNA eventually dissociates from the E site to begin the next round of elongation. The E site has been hypothesized to be important in regulation and reading-frame maintenance (Jenner et al. Reference Jenner, Demeshkina, Yusupova and Yusupov2010; Marquez et al. Reference Marquez, Wilson, Tate, Triana-Alonso and Nierhaus2004). The +1 frameshift for RF2 has been shown to involve a premature release of E-site tRNA.
There have been two proposed mechanisms of how tRNA dissociates from the ribosome: either allosterically with the arrival of the next tRNA to the A site while potentially regulating tRNA arrival and selection, or spontaneously as soon as it reaches the E site. Single-molecule experiments by Uemura et al. showed definitively that tRNA departs the E site stochastically and rapidly upon translocation when using model mRNAs. However, different tRNAs and mRNA sequences have different E-site tRNA release dynamics, which may play a regulatory role (Chen et al. Reference Chen, Stevens, Kaur, Smilansky, Cooperman and Goldman2011b; Nierhaus, Reference Nierhaus1990; Petropoulos & Green, Reference Petropoulos and Green2012; Uemura et al. Reference Uemura, Aitken, Korlach, Flusberg, Turner and Puglisi2010).
A delayed E site release may be important for correcting errors due to mistranslocation, especially at high intracellular magnesium concentrations. A GTPase known as EF4 (encoded by gene lepA), which is structurally related to EF-G, recognizes stalled ribosomes, probably from the formation of aberrant elongating ribosome states from the high Mg2+ concentrations, that have a deacylated tRNA in the E site and a peptidyl-tRNA in the P site and catalyzes a back-translocation reaction (Pech et al. Reference Pech, Karim, Yamamoto, Kitakawa, Qin and Nierhaus2011). This allows the ribosome a second chance to translocate properly. A recent crystal structure of EF4-GDP bound to the ribosome with a P-site tRNA showed that the C-terminal domain of EF4 reaches into the PTC and interacts with the acceptor stem of the P-site tRNA (as opposed to EF-G, where domain IV makes contacts with the anticodon loop of the A-site tRNA) (Gagnon et al. Reference Gagnon, Lin, Bulkley and Steitz2014). Most interestingly, the ribosome is in an unusual state of ratcheting where the 30S subunit is rotated clockwise, rather than the usual counter-clockwise rotation, with respect to the 50S subunit. This probably results in a remodeled PTC that allows for back-translocation. The study underscores the conformational reversibility and malleability of the ribosome and shows how it is able to navigate through the multiple pathways of elongation. Although the exact role of the E site and the mechanism of EF4 back-translocation are still unclear, these results show that the ribosome is more flexible than previously thought.
2.11 Nascent protein interactions with the ribosome exit tunnel
Not only do mRNA sequences regulate translation, the nascent polypeptide chain itself can modulate elongation rates, indicating a dynamic interplay between the nascent chain and the ribosome. Rather than being a passive conduit, the exit tunnel plays a functional role in protein synthesis. Stall sequences within nascent chains dramatically alter elongation, leading to a prolonged arrest of translation and controlling expression of co-transcribed genes (Ito & Chiba, Reference Ito and Chiba2013; Seidelt et al. Reference Seidelt, Innis, Wilson, Gartmann, Armache, Villa, Trabuco, Becker, Mielke, Schulten, Steitz and Beckmann2009). One such example is the SecM stall sequence (Tsai et al. Reference Tsai, Kornberg, Johansson, Chen and Puglisi2014). In secretion-deficient conditions, SecM-induced stalling up-regulates SecA expression. When the cell is secretion-competent, SecM-stalled ribosomes are docked to the translocon at the membrane and the nascent chain is pulled to relieve the stall. The 17 amino-acid sequence FSTPVWISQAQGIRAGP near the C-terminus of SecM is the minimal stall sequence; translation of the sequence stalls the ribosome via nascent chain–ribosome interactions, and no additional molecules are required. Other peptide-induced stalling requires additional cofactors, for example, tryptophan in the case of TnaC (Trabuco et al. Reference Trabuco, Harrison, Schreiner and Schulten2010) and erythromycin in the case of ErmCL (Johansson et al. Reference Johansson, Chen, Tsai, Kornberg and Puglisi2014; Vazquez-Laslop et al. Reference Vazquez-Laslop, Thum and Mankin2008).
A traditional view of SecM-induced translational stalling had been a uniform and abrupt stall containing Gly17 in the P site. In a single-molecule smFRET study to track translation on a mRNA containing the minimal SecM stall sequence (Tsai et al. Reference Tsai, Kornberg, Johansson, Chen and Puglisi2014), the authors showed that, instead of an abrupt and uniform stop, the ribosome stalls over a distribution of codons, even beyond the terminal Pro18 codon. Furthermore, they showed that the through precisely positioned interactions of the nascent peptide with the ribosome exit tunnel, SecM severely reduces elongation rates, in both rotated and non-rotated states, resulting in ribosomes that stall in a heterogeneous population of mRNA positions. Protein folding is thought to provide a directional force on the nascent chain that relieves SecM stalling. A recent combined biochemical, computational, structural and single-molecule dynamics study showed that folding of a small zinc-dependent domain near the solvent end of the exit tunnel indeed releases SecM-induced elongation stalling (Tsai et al. Reference Tsai, Kornberg, Johansson, Chen and Puglisi2014).
Traditional models of macrolide antibiotic induced translational stalling have been challenged by recent structures from X-ray crystallography, single-molecule studies, and ribosomal profiling. Macrolide antibiotics were believed to block completely the exit tunnel, thus stopping translation prematurely. However, high-resolution crystal structure of ribosome–macrolide complex showed that there is no complete blockage of exit tunnel by macrolides (Bulkley et al. Reference Bulkley, Innis, Blaha and Steitz2010; Dunkle et al. Reference Dunkle, Xiong, Mankin and Cate2010; Tu et al. Reference Tu, Blaha, Moore and Steitz2005). Biochemical and single-molecule methods separately showed that macrolide-bound ribosomes stall on ErmCL, a leader sequence with an ORF upstream of the antibiotic resistance gene (ErmC), encoding a ribosomal methyl transferase (Johansson et al. Reference Johansson, Chen, Tsai, Kornberg and Puglisi2014; Vazquez-Laslop et al. Reference Vazquez-Laslop, Thum and Mankin2008). A mechanism for antibiotic resistance has been constructed where the ORF of ErmC is sequestered within secondary structure, and is melted only when a translational stall is produced on ErmCL by macrolide-bound ribosomes. This allows a second ribosome to initiate and translate the ErmC sequence. Recent ribosome profiling study charted stall sequences specific for macrolide and observed several stalling motifs (Kannan et al. Reference Kannan, Kanabar, Schryer, Florin, Oh, Bahroos, Tenson, Weissman and Mankin2014). However, experiments to uncover the macrolide mode of action that could account for these motifs are still pending.
The nascent peptide not only interacts with the exit tunnel, but the co-translational folding of the nascent protein outside and within the ribosome also may affect translational dynamics. One such example is the signal-recognition particle (SRP) binding to the signal sequence of the nascent protein, directing the ribosome–nascent chain complex to the protein translocation channels in the plasma membrane of prokaryotes and endoplasmic reticulum of eukaryotes. Recent single-molecule studies have demonstrated the binding mechanisms to the ribosome–nascent chain complex (Noriega et al. Reference Noriega, Chen, Walter and Puglisi2014a, Reference Noriega, Tsai, Elvekrog, Petrov, Neher, Chen, Bradshaw, Puglisi and Walterb; Shen et al. Reference Shen, Arslan, Akopian, Ha and Shan2012), demonstrating the conformational rearrangements of the SRP as it switches from scanning mode to targeting mode on ribosomes exhibiting an exposed nascent peptide signal sequence. This conformational change results in high-affinity binding of SRP to the ribosome–nascent chain complex. Direct real-time observation of translation coupled with SRP targeting showed rapid and stable binding of SRP only upon exposure of a signal sequence outside the exit tunnel of the ribosome; there was little observed change in elongation rates upon SRP occupancy (Noriega et al. Reference Noriega, Tsai, Elvekrog, Petrov, Neher, Chen, Bradshaw, Puglisi and Walter2014b). These results underscore the power of single-molecule experiments to track co-translational phenomena such as protein targeting, processing, or folding.
2.12 trans-Translation: tmRNA – exhibiting properties of both a mRNA and tRNA
trans-Translation is an extreme version of recoding in which the translating ribosome is diverted onto a specialized RNA, called tmRNA, which exhibit properties of both a tRNA and an mRNA (Keiler et al. Reference Keiler, Waller and Sauer1996; Moore & Sauer, Reference Moore and Sauer2007). tmRNA forms a complex with a small protein called SmpB that mimics ala-tRNA, and the 3′ end of the tmRNA can be charged with alanine. trans-Translation functions as an ‘emergency’ system that rescues the ribosome stalled at a defective or truncated mRNA at the 3′ end that lacks a stop codon. The tmRNA–SmpB complex binds EF-Tu and enters the ribosomal A site; the nascent peptide on the P-site tRNA is transferred to the tmRNA (in a mechanism similar to peptidyl transfer). Subsequently, EF-G translocates the tmRNA–SmpB complex to the P site; the mRNA portion of the tmRNA then displaces the mRNA on the ribosome and translation resumes using tmRNA as a message. There is a stop codon within tmRNA that releases the ribosome, resulting in a protein that contains the tmRNA-encoded peptide tag at its C terminus, and this tag is recognized and targeted for degradation. Until now, essentially nothing is known on the exact mechanism and dynamics of trans-translation (Ramrath et al. Reference Ramrath, Yamamoto, Rother, Wittek, Pech, Mielke, Loerke, Scheerer, Ivanov, Teraoka, Shpanchenko, Nierhaus and Spahn2012). The targeting of some translation reactions for trans-translation suggests that this pathway can be used for regulation and quality control.
2.13 Ribosome–ribosome interactions and polysomes
A single mRNA is normally translated by multiple ribosomes, which successively load on the mRNA at an interval of 2–4 s to form polysomes (Mitarai et al. Reference Mitarai, Sneppen and Pedersen2008). The polysome complex has long been observed in vivo. Polysome complexes have been observed in both a reconstructed in vitro bacterial system, and in intact human cell using cryo-electron tomography (cryo-ET), which identified ribosomes within polysome by fitting known ribosome structure to low-resolution image obtained by electron tomography (Brandt et al. Reference Brandt, Etchells, Ortiz, Elcock, Hartl and Baumeister2009, Reference Brandt, Carlson, Hartl, Baumeister and Grunewald2010). A recent study by Klaholz and co-workers used state-of-the-art cryo-ET technique to resolve 100 MDa eukaryotic polysome complex, and observed supra-molecular helix consists of four ribosomes per turn (Myasnikov et al. Reference Myasnikov, Afonina, Menetret, Shirokov, Spirin and Klaholz2014) (Fig. 15). In this study, numerous physical contact points have been revealed, and it has been suggested to play a regulatory role in polysome translation. Moreover, this study reports a formation of continuous mRNA channel within the polysome where a downstream ribosome feeds mRNA directly into an mRNA entry channel of an upstream ribosome. Direct feeding of mRNA between ribosomes is relevant in translation for two reasons: first, protection of mRNA from degradation, and second, to prevent mRNA from forming secondary structure, removing a need for helicase activity. The first agrees with an existing idea that stalled polysomes can regulate rapid activation of protein synthesis upon a signal (Graber et al. Reference Graber, Hebert-Seropian, Khoutorsky, David, Yewdell, Lacaille and Sossin2013). The second represents a new possibility in translation. From prior study of translation recoding mechanisms such as frameshifting and bypassing, the role of mRNA secondary structure in translational dynamic has been clearly demonstrated. However, the polysome architecture presented here would not allow secondary structure formation within it. How polysome complexes respond to secondary structure would be crucial to connect in vitro knowledge on recoding and in vivo translation.
Molecular structure of the left-handed supra-molecular helix formed by eukaryotic polyribosomes, adapted from (Myasnikov et al. Reference Myasnikov, Afonina, Menetret, Shirokov, Spirin and Klaholz2014). Cryo-ET imaging of eukaryotic polysome reveals a left-handed supra-molecular organization. Color code: 60S subunit, blue; 40S head, red; 40S body, yellow; P-stalk, pink; expansion segment ES27L and nascent peptide, green. The central part of elongating ribosomes forms a tightly packed helical array, as seen also from the 3′-end view on the helical axis of the polysome (right panel).

The examples we have presented in this review are far from comprehensive. However, we hope to instill the richness of the regulatory mechanisms and the dynamic pathways during elongation.
2.14 The end: prokaryotic termination and recycling
Ribosome translation ends when a stop codon (UAA, UAG, or UGA) approaches the A site. Release factors (RFs) then bind to the ribosome during translation termination to release the synthesized protein and prime the ribosome for recycling. After peptide release, the translational components are disassembled during recycling to make available for next iteration of translation. Previous work in termination and recycling have unearthed the complexity of such processes. To understand the mechanism of termination and recycling a combination of structural, biochemical and single-molecule experiments are required to capture this complexity during the entire process. The following is a survey of past research and future perspectives.
The presence of a stop codon in the A site signals class I RFs (RF1 and RF2) to bind to the stop codon. RF1 recognizes UAG, RF2 recognizes UGA, and both class I RFs recognize UAA. Upon stop-codon recognition, the class I RF releases the complete peptide from the P-site tRNA through ester bond hydrolysis at the peptide transferase center (PTC). Sequence studies have identified two highly-conserved motifs on the class I RFs called the tripeptide anticodon (PA) and the GGQ motifs (Ito et al. Reference Ito, Ebihara, Uno and Nakamura1996). The PA motif mimics the role of the trinucleotide anticodon sequences found in tRNAs to specifically recognize the stop codon sequence on the mRNA. High-resolution crystal structures of ribosome-bound class I RFs have illustrated the specific non-covalent contacts the amino acids of the PA motifs make with the stop codon nucleotides to discriminate specifically the three different stop codons from any other codon sequence (Korostelev et al. Reference Korostelev, Asahara, Lancaster, Laurberg, Hirschi, Zhu, Trakhanov, Scott and Noller2008; Laurberg et al. Reference Laurberg, Asahara, Korostelev, Zhu, Trakhanov and Noller2008). The GGQ motif interacts with the PTC to aid in the hydrolysis of the ester bond linking the P-site tRNA to the synthesized peptide. The crystal structures also showed the molecular detail of the interactions between the GGQ motif and the PTC and helped develop a mechanistic model describing how the GGQ motif allows a water molecule into the catalytic core to be used for hydrolysis (Weixlbaumer et al. Reference Weixlbaumer, Jin, Neubauer, Voorhees, Petry, Kelley and Ramakrishnan2008). Comparing the global structure of ribosome-bound class I RF to that of the free proteins, Laurberg et al. have proposed an ‘induced fit’ mechanism that explains how the signal is transduced structurally from stop codon recognition at the decoding center to peptidyl hydrolysis at the PTC through specific contacts RF1 and RF2 make with the ribosome. These high-resolution structures of the ribosome termination complexes provided a full picture of early translation termination by RF1 and RF2 (Fig. 16).
Structural features of class I release factors and their interactions with the ribosome. (a) RF1 recognizes the stop codon in the decoding center (DC) with its tripeptide anticodon (PA) loop and the conserved GGQ motif interacts with the PTC of the ribosome for peptide hydrolysis. (b) Both RF1 and RF2 have the same shown structural fold and makes an ‘induced fit’ conformational change through the dynamics of the switch loop. Figure adapted from Laurberg et al. (Reference Laurberg, Asahara, Korostelev, Zhu, Trakhanov and Noller2008).

After release of the protein from the ribosome, the class II RF (RF3) acts to facilitate the dissociation of class I RFs from the ribosome. Although early bulk kinetics studies have identified this general role of RF3 in termination (Freistroffer et al. Reference Freistroffer, Pavlov, Macdougall, Buckingham and Ehrenberg1997), later studies have yet to clarify the mechanism by which RF3 dissociates RF1/2. There are currently many different models explaining the function of the GTPase activity of RF3 in termination. One (Zavialov et al. Reference Zavialov, Buckingham and Ehrenberg2001) describes RF3 to be primarily GDP-bound; after binding to the ribosome, a GDP-to-GTP nucleotide exchange triggers RF1/2 to dissociate and then the GTP is hydrolyzed to dissociate RF3. More recent studies contradicted the model by stating that RF3 binds to the ribosome in GTP-bound form (Koutmou et al. Reference Koutmou, Mcdonald, Brunelle and Green2014) and that RF3 accelerates the dissociation of RF1/2 through GTP hydrolysis (Peske et al. Reference Peske, Kuhlenkoetter, Rodnina and Wintermeyer2014). The methods used in these RF3 studies detect affinities and single-step kinetics to deduce the pathways involved in late termination, yet these states in the proposed mechanism have never been directly tracked during termination. Tracking these intermediates will clarify the correct mechanistic model of late termination.
Further in vitro studies by Zavialov et al. brought to attention the potential role that ribosome global conformational changes can play in the mechanism of termination (Zavialov et al. Reference Zavialov, Mora, Buckingham and Ehrenberg2002). They proposed that the hydrolysis of the peptide from the P-site tRNA triggers a conformational change in the ribosome that activates the RF3 to exchange nucleotide for dissociation of RF1/2. Cryo-EM work done by Gao et al. showed differences in global ribosome conformations when bound to different RFs, particularly ribosome rotational conformation (Gao et al. Reference Gao, Zhou, Rawat, Huang, Bouakaz, Wang, Cheng, Liu, Zavialov, Gursky, Sanyal, Ehrenberg, Frank and Song2007). When bound to RF1 or RF2, the ribosome exhibited a classical non-rotated state conformation, whereas the RF3-bound ribosome showed the rotated state conformation (Fig. 17). These structural observations suggest that these global conformational changes are critical to the regulation of translation termination, similar to their role in initiation (Marshall et al. Reference Marshall, Aitken and Puglisi2009) and elongation (Aitken & Puglisi, Reference Aitken and Puglisi2010). Tracking these global conformational states of the ribosome during termination would provide much mechanistic insight. Single-molecule methods tracking the rotational dynamics and correlating it with RF occupancy would likely reveal such mechanistic details, as demonstrated in previous work studying elongation (Chen et al. Reference Chen, Petrov, Tsai, O'Leary and Puglisi2013c).
Inside view of the 30S ribosomal subunit from Cyro-EM structures of 70S ribosomal complexes (RC) bound to different release factors. The RF3-bound RC shows a ‘rotated’ global conformational state of the ribosome, compared to (a) free RC, (b) RF1-bound RC, and (c) RF2-bound. RC, which all show the ‘non-rotated’ state. Figure adapted from Gao et al. (Reference Gao, Zhou, Rawat, Huang, Bouakaz, Wang, Cheng, Liu, Zavialov, Gursky, Sanyal, Ehrenberg, Frank and Song2007).

After RFs dissociate, the 70S ribosome is left with a deacylated tRNA and mRNA and needs to be disassembled for the next reiteration of the translation cycle. Prokaryotes achieve this using ribosome recycling factor (RRF), elongation factor EF-G and initiation factor IF3. Early biochemical studies explained that after RRF and EF-G binds to the post-termination complex, a GTP is hydrolyzed by EF-G, triggering a conformational change in RRF and ribosome that promotes dissociation of the 50S subunit from the complex (Karimi et al. Reference Karimi, Pavlov, Buckingham and Ehrenberg1999). IF3 binds to the dissociated 30S ternary complex to prevent 50S rebinding to the 30S (Peske et al. Reference Peske, Rodnina and Wintermeyer2005). One model of subunit disassembly (Hirokawa et al. Reference Hirokawa, Nijman, Raj, Kaji, Igarashi and Kaji2005) describes EF-G ‘translocating’ the RRF through the ribosome to eject the P-site tRNA before the 50S subunit transiently dissociates. Another model (Karimi et al. Reference Karimi, Pavlov, Buckingham and Ehrenberg1999) states that RRF and EF-G only catalyze 50S dissociation and that IF3 plays a more active role in removing the P-site tRNA afterwards. The specific mechanism of IF3 in recycling is thus still not clear, but may be similar to its function during translation initiation, which is also elusive, as discussed in Section 2 above. After the tRNA is removed, the 30S ribosome dissociates from the mRNA and finds the next mRNA to initiate the next round of translation. Many aspects of recycling and reinitiation still remain a mystery, particularly the timings of factor departures and conformational dynamics of the factors and the ribosome.
The past few decades have revealed detailed molecular understanding of the individual steps in termination and recycling, underscoring the complexity of the process (Fig. 18). Bulk biochemical methods have revealed the kinetics of many of the steps involved in termination and recycling. Both low- and high-resolution structures of different termination complexes have illustrated the different structural states of the ribosome as well as key molecular contacts that are crucial at different steps of translation termination. But to understand how these steps are regulated, they must be observed real-time during translation. Recent developments in the field of single-molecule biophysics have aided in achieving this goal (Petrov et al. Reference Petrov, Chen, O'Leary, Tsai and Puglisi2012), but there is much to be done in the realm of translation termination and recycling using single-molecule techniques.
A full multi-step pathway of translation termination, ribosome recycling, and reinitiation in relation to the rest of the translational cycle.

3. Overview of eukaryotic translation
Much of our understanding of mechanism in translation has come from studies on the prokaryotic ribosome. While there are broad mechanistic similarities between prokaryotic and eukaryotic translation, there are notable differences in each of the elongation, termination and recycling phases (Dever & Green, Reference Dever and Green2012; Jackson et al. Reference Jackson, Hellen and Pestova2012), and the initiation processes differ substantially (Aitken & Lorsch, Reference Aitken and Lorsch2012; Jackson et al. Reference Jackson, Hellen and Pestova2010; McCarthy, Reference Mccarthy1998). Central to this difference in initiation is the lack of a SD sequence in eukaryotic mRNAs. This necessitates a complex apparatus of protein initiation factors to guide association of the small ribosomal subunit with the mRNA, location of the start codon, and subunit joining. Furthermore, there are additional specific differences between lower and higher eukaryotes that must be considered when describing their respective translation mechanisms. This is in no way intended to be a comprehensive review of mechanistic studies on eukaryotic translation; excellent reviews exist (Hinnebusch, Reference Hinnebusch2011; Marintchev & Wagner, Reference Marintchev and Wagner2004; Merrick, Reference Merrick2015; Valásek, Reference Valásek2012). Rather, we will focus on progress around key aspects of translation specific to eukaryotes where biophysical methods have been applied or are likely to be particularly useful if applied. We will focus on initiation, specifically recognition of the mRNA 5′ cap by eIF4F, mRNA circularization, scanning, and start codon recognition in the 48S pre-initiation complex (Fig. 19). We will also briefly discuss termination and recycling, which is another major point of difference between prokaryotic and eukaryotic systems and on which much work has been done (Dever & Green, Reference Dever and Green2012; Jackson et al. Reference Jackson, Hellen and Pestova2012; Skabkin et al. Reference Skabkin, Skabkina, Hellen and Pestova2013).
Schematic overview of eukaryotic translation initiation. Numbered factors refer to the respective eIFs. The mRNA is bound at the 5′ end by the eIF4F complex, which flags the mRNA for association with the 40S subunit in the 43S multifactor complex. During scanning the 43S PIC rearranges to move the start codon into its P site, with mRNA structures removed in an ATP-dependent manner catalyzed by eIF4A. Upon recognition of the start codon by eIF2-bound Met-tRNAi, eIF1 is rapidly released, gating irreversible release of P i from eIF2; this arrests the scanning process. In the final stages, GTP hydrolysis by eIF5B follows stable association of the 60S subunit to form the 80S initiation complex, concomitant with initiation factor release.

Translation initiation in eukaryotes can be divided into several phases – mRNA and 40S subunit preparation, mRNA recruitment to the 40S subunit, scanning to find the start codon, start codon recognition, subunit joining, and factor dissociation. Each of these phases has a specific set of associated initiation factors that both guide the basal process and modulate it in regulatory events.
In contrast to prokaryotes, cellularly transcribed eukaryotic mRNAs are capped at their 5′ ends with a m7G(5′)ppp(5′)N structure, where N is any nucleotide. This ‘flags’ the mRNA for interaction with the heterotrimeric eIF4F cap-binding complex, composed of a cap-binding protein (eIF4E), a >100 kDa, multi-domain ‘scaffold’ protein (eIF4G), and a DEAD-box RNA helicase (eIF4A). In parallel, a free 40S ribosomal subunit is bound by eukaryotic initiation factors eIF-1, -1A, -3, -5, and eIF2•GTP• Met-tRNAi Met ternary complex. With the exception of eIF1A, these proteins have been proposed to form a ‘multi-factor complex’ that assembles separately from the ribosome, though the significance of this for translation in vivo remains unclear (reviewed in (Aitken & Lorsch, Reference Aitken and Lorsch2012)). The 40S subunit in this 43S complex is held in an ‘open’ conformation that is receptive to binding of the mRNA near its 5′ end, which is mediated by a series of interactions between the mRNA- and 40S subunit-bound factors, presumably differing between higher and lower eukaryotes, but prominently featuring eIF4F and eIF3. The resulting pre-initiation complex is compositionally and conformationally dynamic, and searches for the mRNA start codon using a poorly defined mechanism termed ‘scanning’, thought to be a linear inspection of the mRNA sequence in a 5′–3′ direction that results in arrival of the 5′-proximal start codon into the 40S subunit's P site (Kozak, Reference Kozak2002). During this process, eIF2-bound Met-tRNAi is not fully accommodated in the P site due to interactions that involve at a minimum eIF1 and the C-terminal tail of eIF1A; this is referred to as the tRNAi P OUT state (Saini et al. Reference Saini, Nanda, Lorsch and Hinnebusch2010). eIF2-bound GTP is hydrolyzed in the 43S complex, stimulated by eIF5. Recognition of the start codon is closely monitored by a complex network of interactions involving eIF1, eIF1A, eIF3, and eIF5; arrival of the start codon in the P site triggers release of eIF1 from the PIC, which induces irreversible phosphate release from eIF2 and a series of conformational rearrangements that establish a ‘closed’ conformation for the 40S subunit; this conformation is thought to be incapable of further scanning, ensuring that the start codon remains properly located in the P site. At this point, there is stable accommodation of Met-tRNAi in its P IN conformation; eIF2•GDP and eIF5 are released. The 60S subunit is then recruited in a process facilitated by the GTPase eIF5B, the eukaryotic counterpart of bacterial IF2. Finally, GTP hydrolysis by eIF5B subsequent to subunit joining promotes its dissociation from the 80S initiation complex, along with that of eIF1A. It is not yet clear when, or even whether, eIF3 is obliged to depart the ribosome after it has carried out its functions in initiation.
The parallelism inherent in prokaryotic initiation pathways (Tsai et al. Reference Tsai, Petrov, Marshall, Korlach, Uemura and Puglisi2012) is likely exaggerated for eukaryotes. At a minimum, this is a consequence of the vastly increased numbers of eukaryotic initiation factors. Additionally, scanning through a 5′ leader with many potential secondary and tertiary structural elements offers the potential for existence of alternative pathways leading to 60S recruitment, exemplified by studies on viral, and more recently cellular, IRES elements (Jackson, Reference Jackson2013; Sarnow et al. Reference Sarnow, Cevallos and Jan2005). Finally, ribosomes in eukaryotic cells can have distinct compositions, creating sub-populations of ‘specialized’ ribosomal particles with modified, missing or extra protein and RNA components, and as discussed above, mRNAs may have epigenetic modifications. This adds complexity to delineating translational pathways and mechanisms (Bauer et al. Reference Bauer, Brandl, Haubenreisser, Wimmer, Weber, Karl, Klausegger, Breitenbach, Hintner, Von Der Haar, Tuite and Breitenbach-Koller2013; Lee et al. Reference Lee, Burdeinick-Kerr and Whelan2013; Xue & Barna, Reference Xue and Barna2012).
Many elements of the eukaryotic initiation system have no mechanistic counterparts in prokaryotes, in particular the existence of the mRNA 5′ cap, scanning and their associated factors. The identities of most or all eukaryotic initiation factors appear to be known, a general network of their interactions is available, and for a number of the factors kinetic information from bulk studies has defined the timings of their arrival and departure to and from the 40S subunit, and of their respective conformational rearrangements relative to start-codon selection and subunit joining. Structural studies highlighting key features of the eukaryotic ribosome that are distinct from the prokaryotic one have emerged, using both X-ray crystallography and electron microscopy. These have provided important information on key intermediates in initiation. Nevertheless, an integrated mechanistic model derived from direct observation of the full initiation process on natural mRNAs is still lacking.
3.1 mRNA preparation: eIF4F
The unique m7G(5′)ppp(5′)N cap structure, where N is any nucleotide, at the 5′ end of eukaryotic mRNAs is central to both the mechanism of translation initiation and also its regulation (Adams & Cory, Reference Adams and Cory1975; Furuichi & Miura, Reference Furuichi and Miura1975; Furuichi et al. Reference Furuichi, Morgan, Muthukrishnan and Shatkin1975; Shatkin, Reference Shatkin1976; Topisirovic et al. Reference Topisirovic, Svitkin, Sonenberg and Shatkin2011). This moiety is recognized by the eIF4F complex, a heterotrimer consisting of the cap-binding protein eIF4E, the scaffold protein eIF4G, which binds to both eIF4E and the mRNA and also mediates interactions with 40S subunit-associated initiation factors to promote mRNA recruitment, and the DEAD-box RNA helicase eIF4A that binds eIF4G and is thought to remove mRNA secondary structure near the cap to facilitate binding of the 40S subunit (Merrick, Reference Merrick2015). The mechanisms of eIF4F–mRNA interaction have been examined by numerous genetic, biochemical, and biophysical experiments; the data have provided evidence that mRNA recognition and preparation events in early initiation rely heavily on conformational and compositional dynamics, and in a number of cases may be kinetically controlled. In the earliest stage of initiation, this control is exerted by several components of the eIF4F complex.
3.1.1 eIF4E
The cornerstone of early initiation is arguably recognition of the mRNA cap by eIF4E. This is a ~24 kDa protein that was initially identified through crosslinking to the cap (Sonenberg et al. Reference Sonenberg, Morgan, Merrick and Shatkin1978). The yeast protein was purified later (Altmann et al. Reference Altmann, Edery, Sonenberg and Trachsel1985) and found to have similar activity to its mammalian counterpart; indeed the mouse protein can substitute for yeast eIF4E in vivo (Altmann et al. Reference Altmann, Müller, Pelletier, Sonenberg and Trachsel1989). Across eukaryotes eIF4E uses a common mechanism for cap binding, where the positively charged m7 G moiety is stacked between two tryptophan residues; additional contacts are made between amino acid side chains in the cap-binding site and the cap structure methyl group and triphosphate (Niedzwiecka et al. Reference Niedzwiecka, Marcotrigiano, Stepinski, Jankowska-Anyszka, Wyslouch-Cieszynska, Dadlez, Gingras, Mak, Darzynkiewicz, Sonenberg, Burley and Stolarski2002; Topisirovic et al. Reference Topisirovic, Svitkin, Sonenberg and Shatkin2011). Cap-binding activity is required for translation of the vast majority of cellular mRNAs, it is heavily regulated, and eIF4E is essential for cellular viability (Altmann et al. Reference Altmann, Handschin and Trachsel1987).
The interaction of eIF4E with the mRNA cap has been investigated with both equilibrium and kinetic measurements. Fluorescence studies on the human and murine eIF4E•cap complexes indicated equilibrium dissociation constants in the wide range of 0·01–10 µM (Carberry et al. Reference Carberry, Rhoads and Goss1989; Niedzwiecka et al. Reference Niedzwiecka, Marcotrigiano, Stepinski, Jankowska-Anyszka, Wyslouch-Cieszynska, Dadlez, Gingras, Mak, Darzynkiewicz, Sonenberg, Burley and Stolarski2002); values obtained for the yeast protein were in the ~1 µM range (Ptushkina et al. Reference Ptushkina, von der Haar, Vasilescu, Frank, Birkenhager and Mccarthy1998). Kinetic approaches have shown that the interaction is highly dynamic – both formation and dissociation of the eIF4E–cap interaction can be rapid on the timescale of initiation. This was first measured for the yeast protein by surface plasmon resonance (von Der Haar et al. Reference von der Haar, Ball and Mccarthy2000), revealing a rate a binding rate of ~1 µM–1 s–1 for formation of the eIF4E–cap complex, and a rate of dissociation of ~1 s–1 from surface-immobilized, capped RNA oligonucleotides. Faster association (~60 µM–1 s–1) and similar dissociation (~2 s–1) rates were also seen in a recent single-molecule FRET study with yeast eIF4E and surface-immobilized, capped RNA oligonucleotides (O'Leary et al. Reference O'Leary, Petrov, Chen and Puglisi2013). Moreover, stopped-flow fluorescence studies with the human protein revealed even faster rates of cap–eIF4E association (~200 µM–1 s–1, decreased by eIF4E phosphorylation on Ser209) and dissociation (~100 s–1) (Slepenkov et al. Reference Slepenkov, Darzynkiewicz and Rhoads2006). For the slower range of these rates, on the timescale of initiation, which in some cases can be only a few seconds (Shah et al. Reference Shah, Ding, Niemczyk, Kudla and Plotkin2013; Siwiak & Zielenkiewicz, Reference Siwiak and Zielenkiewicz2010), the eIF4E•mRNA interaction need not have equilibrated prior to the occurrence of, or during downstream events. In this sense, data from perturbation experiments that show an effect of some extraneous component on the eIF4E–cap equilibrium interaction must be interpreted cautiously and validated in the context of an assay for real initiation. This mantra is also true for each of the other pairwise interactions in initiation; it is important to bear in mind that while equilibrium measurements have been made for a great number of the complexes, kinetic measurements are generally far fewer.
Elucidation of the molecular mechanism underlying cap binding has been aided by structures that defined contacts between protein and cap, and have highlighted how conformational dynamics are central to cap recognition by eIF4E. The NMR structures of yeast eIF4E bound to m7GDP and m7GpppA (Matsuo et al. Reference Matsuo, Li, Mcguire, Fletcher, Gingras, Sonenberg and Wagner1997), X-ray crystal structures of murine eIF4E bound to m7GDP (Marcotrigiano et al. Reference Marcotrigiano, Gingras, Sonenberg and Burley1997), and human eIF4E bound to a range of cap structure analogs (Tomoo et al. Reference Tomoo, Shen, Okabe, Nozoe, Fukuhara, Morino, Ishida, Taniguchi, Hasegawa, Terashima, Sasaki, Katsuya, Kitamura, Miyoshi, Ishikawa and Miura2002) defined an overall fold resembling a cupped hand with a narrow cap-binding site, including the two conserved tryptophan residues on its concave surface. The convex, dorsal surface was found to have a conserved hydrophobic/acidic portion, implicated in binding to additional factors. Later, a cap-free structure of human eIF4E was solved by NMR (Volpon et al. Reference Volpon, Osborne, Topisirovic, Siddiqui and Borden2006) that showed an opening of the hand structure and dispersion of the cap-binding residues in the absence of the cap.
Cap binding alone does not account for the central role of eIF4E in initiation, rather its site of interaction with the scaffold protein eIF4G links it to the eIF4F complex, and dynamics are also central here. The Wagner group (Gross et al. Reference Gross, Moerke, von der Haar, Lugovskoy, Sachs, Mccarthy and Wagner2003) used NMR to determine the structural basis for the interaction of yeast eIF4E with the eIF4G 4E-binding domain and the resulting conformational coupling that stabilizes the complex (Hershey et al. Reference Hershey, Mcwhirter, Gross, Wagner, Alber and Sachs1999). These elegant NMR studies showed that the yeast eIF4G eIF4E-binding domain wraps around the eIF4E N-terminus, forming a ‘molecular bracelet’ that both stabilizes the complex and results in coupled conformational changes in both proteins (Gross et al. Reference Gross, Moerke, von der Haar, Lugovskoy, Sachs, Mccarthy and Wagner2003). Further combined NMR and SPR studies defined the structural basis for cooperative assembly of the yeast eIF4E•eIF4G•cap ternary complex (von der Haar et al. Reference von der Haar, Oku, Ptushkina, Moerke, Wagner, Gross and Mccarthy2006), showing that coupled folding transitions induced by the respective eIF4E–cap and eIF4E–eIF4G encounters modulate the kinetics of complex assembly, again highlighting the interplay of composition and conformation in early initiation. In contrast, the equivalent N-terminal region of murine eIF4E is dispensable for translation initiation, suggesting that eIF4G stimulates eIF4E cap binding by a different mechanism (Marcotrigiano et al. Reference Marcotrigiano, Gingras, Sonenberg and Burley1997). These mechanistic differences between yeast and higher eukaryotes have also been apparent from biophysical studies. Transient-state kinetic analysis of the assembly of the human eIF4E•eIF4G (557–646)•m7GpppG ternary complex, which contains the eIF4G eIF4E-binding domain (Slepenkov et al. Reference Slepenkov, Korneeva and Rhoads2008) showed that its assembly follows a random-sequential mechanism – the kinetics of cap and eIF4G binding are independent. The kinetics of ternary complex assembly in the presence of larger fragments of human eIF4G were not tested. Subsequent chemical crosslinking studies in the human system showed that the RNA-binding activity of eIF4G is needed for stimulation of cap binding (Yanagiya et al. Reference Yanagiya, Svitkin, Shibata, Mikami, Imataka and Sonenberg2009); the increased local concentration of eIF4E in proximity to the cap brought about by binding of eIF4G to the mRNA was proposed to be responsible for the increased extent of cap–eIF4E interaction. This leads to the question of whether the eIF4G RNA-binding activity has a similar role in yeast. The kinetic effects of full-length yeast eIF4G1 on interaction of eIF4E with capped RNAs have been studied by single-molecule FRET (O'Leary et al. Reference O'Leary, Petrov, Chen and Puglisi2013) (Fig. 20A); this showed that yeast eIF4G activities beyond the eIF4E-binding domain also modulate the kinetics of the eIF4E–cap interaction, most notably by increasing the association rate of the eIF4E•eIF4G–cap interaction to an extent greater than that seen at saturating concentrations of the 4E-binding domain alone. The biological significance of the mechanistic differences in how eIF4E–cap interaction is stimulated in yeast and higher eukaryotes remains unclear, but may reflect an aspect of the broader mechanistic differences between yeast and higher eukaryotes.
Dynamics of eukaryotic translation initiation factors at the single-molecule level. (a) Dynamic binding of S. cerevisiae eIF4E to a capped, model RNA measured by FRET. Excerpted with permission from O'Leary et al. (Reference O'Leary, Petrov, Chen and Puglisi2013). (b) Dynamics of RNA helicase activity catalyzed by human eIF4AI in the presence of eIF4H, also measured using FRET. From Sun et al. (Reference Sun, Atas, Lindqvist, Sonenberg, Pelletier and Meller2014). (c) Dynamics of the catalytically-essential S. cerevisiae eIF4A conformational cycle, and their dependence on eIF4B domains of eIF4G, measured by FRET. From Andreou & Klostermeier (Reference Andreou and Klostermeier2014).

The compositional and conformational dynamics that are central to the eIF4E–cap and -eIF4G recognition are extensively leveraged to exert regulation. One of the most important modes of regulation of eIF4E activity is its interaction with inhibitory 4E-binding proteins (4E-BPs) (Richter & Sonenberg, Reference Richter and Sonenberg2005). Early biochemical studies showed that human 4E-BPs repress translation by competing with eIF4G for binding to eIF4E through a common binding motif (Haghighat et al. Reference Haghighat, Mader, Pause and Sonenberg1995) (Mader et al. Reference Mader, Lee, Pause and Sonenberg1995), and structural studies identified the binding site as the same conserved eIF4G-binding site on the dorsal face of eIF4E (Marcotrigiano et al. Reference Marcotrigiano, Gingras, Sonenberg and Burley1999; Matsuo et al. Reference Matsuo, Li, Mcguire, Fletcher, Gingras, Sonenberg and Wagner1997). A similar situation arises in yeast, where the protein Caf20p functionally resembles the mammalian 4E-BPs (Ptushkina et al. Reference Ptushkina, von der Haar, Vasilescu, Frank, Birkenhager and Mccarthy1998). The binding is possible when 4E-BPs are hypophosphorylated; conversely, when 4E-BPs are phosphorylated in response to cell signaling events they cannot bind to eIF4E, allowing formation of the eIF4F complex and resulting in de-repression of cap-dependent translation initiation.
Much of the focus on 4E-BPs has naturally been on their regulation of translation initiation at a global level in the cell, particularly through analysis of the signaling cascades that drive their activity. However, biophysical methods have added substantially to the existing model for 4E-BPs’ mechanism of action. Interestingly, while the 4E-BPs are potent translational repressors, a number of studies have shown that they in fact cause an increase in the affinity of eIF4E for the cap (Ptushkina et al. Reference Ptushkina, von der Haar, Karim, Hughes and Mccarthy1999, Reference Ptushkina, von der Haar, Vasilescu, Frank, Birkenhager and Mccarthy1998; Scheper et al. Reference Scheper, van Kollenburg, Hu, Luo, Goss and Proud2002), a situation that prevents eIF4E from entering new cycles of translation initiation. Biophysical and structural studies of eIF4E bound to the cap and 4E-BPs showed that the complexes are similar to those seen with eIF4G (Tomoo et al. Reference Tomoo, Matsushita, Fujisaki, Abiko, Shen, Taniguchi, Miyagawa, Kitamura, Miura and Ishida2005). Further crystallographic and NMR studies of cap-free eIF4E in complex with a 4E-BP1 peptide showed that 4E-BP binding also causes structural changes in apo-eIF4E, similar to those induced by eIF4G, that are transmitted allosterically to the cap-binding site (Siddiqui et al. Reference Siddiqui, Tempel, Nedyalkova, Volpon, Wernimont, Osborne, Park and Borden2012). These structural data in part account for the ability of 4E-BPs to increase the affinity of eIF4E for the cap; however, detailed thermodynamic analysis concluded that the 4E-BP eIF4E-binding peptide alone is not sufficient to induce the increased affinity (Niedzwiecka et al. Reference Niedzwiecka, Marcotrigiano, Stepinski, Jankowska-Anyszka, Wyslouch-Cieszynska, Dadlez, Gingras, Mak, Darzynkiewicz, Sonenberg, Burley and Stolarski2002), suggesting a role for secondary interactions with eIF4E in mediating 4E-BP activity. Conformational dynamics of the 4E-BPs themselves, which are intrinsically unstructured proteins, are a further key component of their activity. A combination of structural and biophysical approaches showed how combinations of amino acids in 4E-BP1 promote a disordered-to-ordered folding transition of its eIF4E-binding sequence, generating the structure needed to bind eIF4E; this is disfavored by phosphorylation of Ser65 (numbering for human 4E-BP1), linking translational regulation, through the energy landscape of structural dynamics, directly to kinase activity in response to cell signaling events (Tait et al. Reference Tait, Dutta, Cowburn, Warwicker, Doig and Mccarthy2010).
The primary role of 4E-BPs is to disrupt the eIF4E–eIF4G interaction. Further insights into the mechanism of this disruption have come from biophysical studies on the small-molecule inhibitor of eIF4E–eIF4G association, 4EGI-1 (Moerke et al. Reference Moerke, Aktas, Chen, Cantel, Reibarkh, Fahmy, Gross, Degterev, Yuan, Chorev, Halperin and Wagner2007). It was shown that while 4EGI-1 disrupts eIF4E–eIF4G binding, 4E-BP may remain associated with eIF4E in the presence of the inhibitor, suggesting that the mechanism of inhibition is not through direct steric blockade of the eIF4G-binding site. This is reminiscent of the conclusions from the earlier biophysical studies that showed that the 4E-BP consensus binding peptide was not sufficient to enhance affinity of eIF4E for the cap. A subsequent SAXS (Small-Angle X-Ray Scattering) study that concluded that the eIF4E•4E-BP complex may indeed involve a suite of contacts beyond the peptide-binding site (Gosselin et al. Reference Gosselin, Oulhen, Jam, Ronzca, Cormier, Czjzek and Cosson2011). More recent structural studies have shown that 4EGI-1 binds eIF4E at a point removed from the eIF4G-binding site, causing a localized conformational transition that triggers eIF4G dissociation by an allosteric mechanism (Papadopoulos et al. Reference Papadopoulos, Jenni, Kabha, Takrouri, Yi, Salvi, Luna, Gavathiotis, Mahalingam, Arthanari, Rodriguez-Mias, Yefidoff-Freedman, Aktas, Chorev, Halperin and Wagner2014). 4EGI-1 destabilizes eIF4G binding to eIF4E while simultaneously stabilizing binding of 4E-BP1 (Sekiyama et al. Reference Sekiyama, Arthanari, Papadopoulos, Rodriguez-Mias, Wagner and Léger-Abraham2015), a situation that represents a double tumor suppressor effect. 4EGI-1 represents an interesting and novel therapeutic strategy for counteracting misregulation of eIF4E activity, which is associated with numerous pathologies, including head and neck cancers, diabetes, and autism (Sonenberg, Reference Sonenberg2008). Thus, eIF4E dynamics are not just the key to cap recognition and translational control, but are also an important potential target for therapeutics (Pelletier et al. Reference Pelletier, Graff, Ruggero and Sonenberg2015).
3.1.2 eIF4G
The cap-binding, helicase, and other functions of the eIF4F complex are coordinated by the multi-domain, multi-functional ‘scaffold’ protein, eIF4G. This was first purified from reticulocyte lysate over three decades ago (Grifo et al. Reference Grifo, Tahara, Morgan, Shatkin and Merrick1983), and later from wheat germ (Lax et al. Reference Lax, Fritz, Browning and Ravel1985) and yeast (Goyer et al. Reference Goyer, Altmann, Trachsel and Sonenberg1989). The protein has two paralogs across eukaryotes, termed eIF4GI and eIF4GII, encoded by separate genes (Goyer et al. Reference Goyer, Altmann, Lee, Blanc, Deshmukh, Woolford, Trachsel and Sonenberg1993; Gradi et al. Reference Gradi, Imataka, Svitkin, Rom, Raught, Morino and Sonenberg1998). Evidence from studies in yeast led to the conclusion that the isoforms are functionally redundant; it was shown that translation efficiency is sensitive to the total cellular eIF4G concentration rather than the relative concentrations of a particular isoform (Clarkson et al. Reference Clarkson, Gilbert and Doudna2010). Conversely, in higher eukaryotes there is evidence that the two isoforms contribute differentially to translation of specific mRNAs (Castello et al. Reference Castello, Alvarez and Carrasco2006).
All eIF4G proteins contain an N-terminal domain that binds the poly(A)-binding protein (PABP) (Cheng & Gallie, Reference Cheng and Gallie2007; Imataka et al. Reference Imataka, Gradi and Sonenberg1998; Tarun & Sachs, Reference Tarun and Sachs1996; Wakiyama et al. Reference Wakiyama, Imataka and Sonenberg2000), thought to promote net circularization of the mRNA termini with formation of a ‘closed-loop’ mRNP (see below) (Park et al. Reference Park, Walker, Lee, Rothenburg, Lorsch and Hinnebusch2011). In yeast, the extreme N-terminal portion of eIF4G also binds RNA (Berset et al. Reference Berset, Zurbriggen, Djafarzadeh, Altmann and Trachsel2003). A central region contains the eIF4E-binding site, an RNA-binding domain, and a HEAT domain that includes binding motifs for eIF4A, RNA and, in higher eukaryotes, for eIF3 (Lamphear et al. Reference Lamphear, Kirchweger, Skern and Rhoads1995; Neff & Sachs, Reference Neff and Sachs1999; Yanagiya et al. Reference Yanagiya, Svitkin, Shibata, Mikami, Imataka and Sonenberg2009). This central portion is the minimal sequence required for cap-dependent translation in mammals (Morino et al. Reference Morino, Imataka, Svitkin, Pestova and Sonenberg2000). Yeast eIF4Gs have not been shown to bind directly to eIF3, but the yeast eIF4G central domain binds eIF1 and eIF5; yeast eIF1 was shown to bind simultaneously to eIF4G and eIF3c in vitro, which may act as an alternative physical link between eIF4G and eIF3 (He et al. Reference He, von der Haar, Singh, Ii, Li, Hinnebusch, Mccarthy and Asano2003), though the importance of this remains unclear. In higher eukaryotes only, there is a further C-terminal segment with two additional HEAT domains, which binds eIF4A and Mnk1, the kinase that phosphorylates eIF4E (Bellsolell et al. Reference Bellsolell, Cho-Park, Poulin, Sonenberg and Burley2006; Imataka & Sonenberg, Reference Imataka and Sonenberg1997). This C-terminal third of the mammalian protein was shown to be dispensable for cap-dependent translation initiation and was proposed to serve a modulatory role (discussed below for eIF4A) (Morino et al. Reference Morino, Imataka, Svitkin, Pestova and Sonenberg2000). In yeast, the extreme C-terminal region from amino acids 853–952 has been shown to double the RNA-dependent ATPase activity and slightly reduce the dsRNA unwinding activity of eIF4A, at least for a narrow range of RNA substrates (Andreou & Klostermeier, Reference Andreou and Klostermeier2014). This region of yeast eIF4G shows short regions of similarity to the linker between the HEAT-1 and -2 domains of human eIF4G, which binds weakly to the C-terminal domain of human eIF4A (Marintchev et al. Reference Marintchev, Edmonds, Marintcheva, Hendrickson, Oberer, Suzuki, Herdy, Sonenberg and Wagner2009).
The mechanism of action of eIF4G has been defined primarily through genetics experiments (Hinnebusch & Lorsch, Reference Hinnebusch and Lorsch2012; Valásek, Reference Valásek2012). In part, this is because eIF4Gs are relatively large proteins that can be problematic to purify and store for biophysical, biochemical, or structural studies, owing to a tendency for extensive proteolysis (Berset et al. Reference Berset, Zurbriggen, Djafarzadeh, Altmann and Trachsel2003). Consequently, essentially nothing is known about the dynamics of full-length eIF4G. However, dynamic aspects of the activities of some of its domains have been studied in detail in the context of their interactions with specific partners in initiation.
Aside from its stabilization of eIF4E–cap binding, perhaps the best-studied aspect of eIF4G dynamics is its interaction with the third member of the eIF4F complex, the DEAD-box helicase eIF4A. A combination of biophysical and structural approaches showed how the HEAT-1 domain from the middle portion of human eIF4G and the HEAT-2 domain from its C-terminus interact differentially and dynamically with the N- and C-terminal domains of eIF4A, modulating the eIF4A catalytic cycle. A highly complicated network of interactions between the N- and C-terminal domains of eIF4A, the eIF4G HEAT domains, and the linker between the HEAT domains stabilize the ‘half-open’ conformation of eIF4A, potentiating ATP and RNA binding and facilitating the eIF4A-catalyzed unwinding (see below for further discussion of eIF4A dynamics) (Marintchev et al. Reference Marintchev, Edmonds, Marintcheva, Hendrickson, Oberer, Suzuki, Herdy, Sonenberg and Wagner2009; Oberer et al. Reference Oberer, Marintchev and Wagner2005). These contacts are dynamically remodeled throughout the eIF4A catalytic cycle. The centrality of dynamics to even this pairwise interaction showcases the need for further such studies with full-length eIF4G that can assess how eIF4G spatially coordinates the activities of its several simultaneous binding partners to mediate initiation.
The interaction of eIF4G with the PABP (Pab1p in yeast) might also rely on coupled compositional and conformational dynamics, not least because it was shown to require poly(A) binding (Tarun & Sachs, Reference Tarun and Sachs1996), reminiscent of the cooperative, dynamic assembly of the catalytically-active eIF4A•eIF4G complex. Formation of a ‘closed-loop’ mRNP by the mRNA–eIF4G–PABP interaction network promotes synergistic stimulation of translation over that seen in the presence of either the cap or poly(A) tail alone (Imataka et al. Reference Imataka, Gradi and Sonenberg1998; Kahvejian et al. Reference Kahvejian, Roy and Sonenberg2001). Nevertheless, direct observation of dynamics in this system has been elusive. Perhaps the most compelling demonstration of the eIF4G–PABP interaction was the direct visualization by atomic force microscopy (AFM) of the circularization of capped mRNA by a yeast eIF4E•eIF4G•Pab1p complex (Wells et al. Reference Wells, Hillner, Vale and Sachs1998). A subsequent study showed that formation of the closed-loop complex that results from the eIF4G–PABP–poly(A) interaction in human translation extracts likely depends on the presence of two PABP molecules and that different forms of the complex exist in a factor-dependent manner in the presence of 48S pre-initiation complexes or 80S ribosomes, again consistent with significant cooperativity between the protein components (Amrani et al. Reference Amrani, Ghosh, Mangus and Jacobson2008). Some structural insight into how PABP may interact with eIF4G was obtained from the X-ray co-crystal structure of rotavirus NSP3 protein, a competitor of PABP binding, and a fragment of human eIF4G, mapping out the key interactions (Groft & Burley, Reference Groft and Burley2002). However, little subsequent biophysical investigation on the eIF4G–PABP interaction appears to have been carried out. mRNA circularization is discussed in additional detail below.
Multiple facets of eIF4G mechanism remain unknown: How the eIF4G RNA-binding domains are deployed along the mRNA and how they are arranged in space relative to each other and to other factors in order to scaffold the cap-binding, RNA helicase, 40S subunit recruitment, and scanning activities of initiation. Studies using rabbit eIF4F showed that binding to mRNAs was dependent on a minimal RNA length and independent of the presence of the cap structure, highlighting the importance of the eIF4G–RNA interaction for translation (Kaye et al. Reference Kaye, Emmett, Merrick and Jankowsky2009). Studies with yeast eIF4G showed that the C-terminal domain, containing the RNA- and eIF4A-binding sites, is sufficient to promote mRNA recruitment to the 43S pre-initiation complex, and that the N-terminal domain that binds RNA, the PABP and eIF4E merely increased the affinity of eIF4G for the mRNA or the PIC (Mitchell et al. Reference Mitchell, Walker, Algire, Park, Hinnebusch and Lorsch2010). A particularly interesting question relates to how the eIF4E•eIF4G complex interacts simultaneously with the cap, mRNA 5′-UTR and 40S subunit during scanning, and how the activities of helicases such as eIF4A and Ded1p, which remodel the mRNA structure, impact the eIF4G–mRNA interaction (Spirin, Reference Spirin2009). Further biophysical and structural studies will be required to elucidate the molecular details of how the interaction network around eIF4G mediates translation.
3.1.3 eIF4A
As relatively long, single-stranded RNA molecules, mRNAs can potentially contain extensive secondary and tertiary structure. Where this occurs in the 5′ leader, it has the potential to interfere with initiation by occluding the 5′ end from engagement with eIF4E•eIF4G, preventing 40S subunit binding, or hindering scanning in the 48S PIC. The eIF4F complex has a means of overcoming this by including a DEAD-box RNA helicase, eIF4A, which binds to eIF4G.
eIF4A is the archetypal DEAD-box helicase, consisting of two RecA-like domains separated by a flexible linker. The termini of proteins in the DEAD-box family are variable, but eIF4A contains minimal extensions to, or modifications of the conserved enzyme core (Linder & Jankowsky, Reference Linder and Jankowsky2011). Its role in remodeling mRNA structure puts it at the center of dynamics in early initiation. The protein was identified as a component of the initiation machinery in early studies (Merrick, Reference Merrick2015) and was purified from rabbit reticulocyte lysate and characterized, leading to the finding that its binding to mRNA was stimulated by ATP and modulated by additional initiation factors such as eIF4B and eIF4H (Grifo et al. Reference Grifo, Tahara, Leis, Morgan, Shatkin and Merrick1982). The ability of eIF4A to unwind mRNA structures in an ATP-dependent manner was demonstrated and it was shown that while the presence of the other eIF4F factors and cap binding stimulates the unwinding activity, they are not required for it (Ray et al. Reference Ray, Lawson, Kramer, Cladaras, Grifo, Abramson, Merrick and Thach1985). These early studies implicated single-stranded mRNA as an important element for eIF4A activity (Abramson et al. Reference Abramson, Dever, Lawson, Ray, Thach and Merrick1987), though mammalian eIF4A also effectively unwinds blunt-end duplexes (Rogers et al. Reference Rogers, Lima and Merrick2001a), and yeast eIF4A can also somewhat inefficiently unwind them (Rajagopal et al. Reference Rajagopal, Park, Hinnebusch and Lorsch2012). The helicase activity of eIF4A in mammals and yeast is bi-directional, but in the presence of eIF4F and the mRNA cap is biased toward a 5′ to 3′ direction; in yeast, the eIF4G RNA-binding domains were shown to confer the 5′ end specificity (Rajagopal et al. Reference Rajagopal, Park, Hinnebusch and Lorsch2012; Rozen et al. Reference Rozen, Edery, Meerovitch, Dever, Merrick and Sonenberg1990). Biochemical studies also led to the conclusion that eIF4A is not a processive helicase and that it acts by destabilizing a short segment of duplex RNA (Rogers et al. Reference Rogers, Richter and Merrick1999).
Yeast eIF4A was identified after its mammalian homolog (Blum et al. Reference Blum, Mueller, Schmid, Linder and Trachsel1989). While yeast eIF4A and the protein from higher eukaryotes show much apparent similarity, they also differ in significant respects; it was shown that mouse eIF4A cannot support translation in yeast either in vitro or in vivo (Prat et al. Reference Prat, Schmid, Buser, Blum, Trachsel, Nielsen and Linder1990). In Saccharomyces cerevisiae, two separate genes encode identical eIF4A proteins. Conversely, there are three isoforms of eIF4A in humans. Mammalian eIF4AI and eIF4AII are similar but distinct polypeptides, and there is evidence that they act diferentially in translation (Galicia-Vázquez et al. Reference Galicia-Vázquez, Cencic, Robert, Agenor and Pelletier2012; Li et al. Reference Li, Ross-Smith, Proud and Belsham2001). eIF4AIII does not appear to be involved in translation; instead it shows nuclear localization, and is in fact a component of the exon junction complex, where it is proposed to act as an RNA clamp (Chan et al. Reference Chan, Dostie, Diem, Feng, Mann, Rappsilber and Dreyfuss2004; Ferraiuolo et al. Reference Ferraiuolo, Lee, Ler, Hsu, Costa-Mattioli, Luo, Reed and Sonenberg2004).
Early kinetic and thermodynamic studies on mammalian eIF4A highlighted the importance of conformational cycling, linked to nucleotide and RNA binding and release, for the catalytic activity of the enzyme (Lorsch & Herschlag, Reference Lorsch and Herschlag1998a, Reference Lorsch and Herschlagb). The dumbbell-shaped protein alternates between open, closed, and intermediate ‘half-open’ states, dynamically guided by substrate and cofactor binding. Engagement of the RNA-binding and nucleotide-binding domains with the mRNA and ATP result in domain closure; this is potentiated by interaction with eIF4G as described above. Subsequent studies focused on modulation of this cycle by nucleotide binding, eIF4G, RNA, and eIF4B/H have highlighted how the various initiation factors and their interactions kinetically control the conformational cycling of eIF4A that results in duplex unwinding, specifically promoting formation of the ‘closed’ conformation required for strand separation (Andreou & Klostermeier, Reference Andreou and Klostermeier2014; Harms et al. Reference Harms, Andreou, Gubaev and Klostermeier2014; Hilbert et al. Reference Hilbert, Kebbel, Gubaev and Klostermeier2011; Parsyan et al. Reference Parsyan, Svitkin, Shahbazian, Gkogkas, Lasko, Merrick and Sonenberg2011; Sun et al. Reference Sun, Atas, Lindqvist, Sonenberg, Pelletier and Meller2012, Reference Sun, Atas, Lindqvist, Sonenberg, Pelletier and Meller2014) (Figs 20B and 20C). A structural rationale for this conformational cycling has come from crystallographic studies (Caruthers et al. Reference Caruthers, Johnson and Mckay2000), showing that in the absence of eIF4G the protein adopts an extended conformation of the two RecA-like domains separated by the linker region, though later single-molecule FRET data suggests that the solution conformation may not be quite so extended (Hilbert et al. Reference Hilbert, Kebbel, Gubaev and Klostermeier2011). Binding of eIF4G then stabilizes the eIF4A N- and C-terminal domains in the half-open conformation (Marintchev et al. Reference Marintchev, Edmonds, Marintcheva, Hendrickson, Oberer, Suzuki, Herdy, Sonenberg and Wagner2009; Oberer et al. Reference Oberer, Marintchev and Wagner2005; Schutz et al. Reference Schutz, Bumann, Oberholzer, Bieniossek, Trachsel, Altmann and Baumann2008).
As indicated above, the activity of eIF4A is potentiated by other translation factors. These include eIF4B and its paralogue, eIF4H (Andreou & Klostermeier, Reference Andreou and Klostermeier2013). eIF4B is expressed in yeast and mammals, whereas eIF4H is not present in yeast. Both proteins increase the affinity of eIF4A for RNA. The activity of eIF4A is one area where differences between yeast and higher eukaryotes with regard to the mechanism of initiation become rather apparent, in a number of ways that will be noted below. eIF4B and eIF4H share a common binding site on mammalian eIF4A; their binding is mutually exclusive (Rozovsky et al. Reference Rozovsky, Butterworth and Moore2008). eIF4B stimulates eIF4A-catalyzed RNA unwinding; in higher eukaryotes this has been shown to be manifested as an increased coupling of ATP hydrolysis to RNA unwinding (Ozes et al. Reference Ozes, Feoktistova, Avanzino and Fraser2011; Rogers et al. Reference Rogers, Richter, Lima and Merrick2001b). There is some discrepancy between results for yeast eIF4A with regard to eIF4B. On one hand, in at least two studies (Rajagopal et al. Reference Rajagopal, Park, Hinnebusch and Lorsch2012), unlike mammalian eIF4B, yeast eIF4B (Tif3p) did not directly stimulate the duplex unwinding activity of eIF4A. Instead, a role was identified for yeast eIF4B in promoting stable association between eIF4A and eIF4G (Park et al. Reference Park, Walker, Zhou, Lee, Rajagopal, Lorsch and Hinnebusch2013). Conversely, recent kinetic and single-molecule conformational analyses (Andreou & Klostermeier, Reference Andreou and Klostermeier2014) showed (Fig. 20) that yeast eIF4B does indeed stimulate RNA unwinding, but without affecting the eIF4A conformation, and does not stimulate the ATPase activity unless eIF4G is present. The reason for these differences remains unclear. In terms of broader effects of eIF4B and eIF4H on translation, the picture is even more complicated, as eIF4B (and potentially eIF4H) also exhibits strand annealing activity that is partially dependent on its RNA-recognition motif (RRM) domain (Altmann et al. Reference Altmann, Wittmer, Methot, Sonenberg and Trachsel1995; Niederberger et al. Reference Niederberger, Trachsel and Altmann1998). The potential for the RNA-binding activity of this domain to act as in a strand-capture mechanism for ssRNA released by eIF4A has been suggested to play part of its role in stimulating translation (reviewed in (Hinnebusch & Lorsch, Reference Hinnebusch and Lorsch2012)).
Yeast eIF4B was also shown to interact with the ribosome via Rps20p (Walker et al. Reference Walker, Zhou, Mitchell, Larson, Valasek, Hinnebusch and Lorsch2013), suggesting that it may play a role in recruitment of the mRNA to the 43S pre-initiation complex. Recently, specific elements of the yeast eIF4B polypeptide that promote recruitment of mRNA to the 48S pre-initiation complex were examined in detail (Zhou et al. Reference Zhou, Walker, Mitchell, Lorsch and Hinnebusch2014). The results suggested that the RRM is dispensable for the activity of eIF4B in mRNA recruitment to the 43S pre-initiation complex, and that in fact only two of eIF4B's seven 26-amino acid repeat domains are sufficient for function, and within these only three highly conserved positions are essential. Thus, while combined effects of eIF4G and eIF4B promote forward commitment through the conformational cycle of eIF4A that is essential for its unwinding activity, both proteins may also act as direct or indirect bridges to the 40S ribosomal subunit in mRNA recruitment to the 43S complex. Further studies are needed to decipher the detailed molecular mechanism of how eIF4B promotes translation initiation.
eIF4H has broadly similar stimulatory effects on eIF4A activity to those of eIF4B; it was shown in its initial characterization to stimulate markedly globin synthesis in translation reactions where eIF4B was sub-saturating (Richter-Cook et al. Reference Richter-Cook, Dever, Hensold and Merrick1998). Further studies indicated that human eIF4H also stimulates the ATPase activity of eIF4A and increases its affinity for RNA (Ozes et al. Reference Ozes, Feoktistova, Avanzino and Fraser2011; Richter et al. Reference Richter, Rogers, Hensold and Merrick1999). The NMR structural studies noted above suggested that eIF4H binds to both domains of eIF4A, further stabilizing the closed, catalytically active conformation. An additional mechanistic role for eIF4H has been proposed on the basis of results from single-molecule FRET experiments with surface-immobilized hairpin-loop structures. The data suggested that the eIF4H•eIF4A complex can bind through eIF4H to single-stranded loop regions, facilitating repeated cycles of duplex unwinding (Sun et al. Reference Sun, Atas, Lindqvist, Sonenberg, Pelletier and Meller2012). Thus, eIF4H also leverages structural dynamics and kinetic control to potentiate eIF4A activity.
The dynamic nature of the eIF4A catalytic cycle makes it an excellent candidate for single-molecule approaches to study mechanism. These offer the potential for allowing conformation and composition of intermediates to be directly observed and correlated. One such study (Sun et al. Reference Sun, Atas, Lindqvist, Sonenberg, Pelletier and Meller2012) directly observed that, as expected from previous biochemical experiments, eIF4A requires a single ATP molecule per cycle of unwinding (Chen et al. Reference Chen, Potratz, Tijerina, Del Campo, Lambowitz and Russell2008; Liu et al. Reference Liu, Putnam and Jankowsky2008); this and another study (Sun et al. Reference Sun, Atas, Lindqvist, Sonenberg, Pelletier and Meller2014) confirmed the link between nucleotide binding and establishment of the ‘closed’ eIF4A conformation, and surprisingly indicated that the eIF4A closed-to-open transition occurs essentially simultaneously with duplex unwinding. Large-scale conformational rearrangements were thus proposed to be rate-limiting overall for catalysis. These results would appear to differ from the data in a single-molecule study on yeast eIF4A and eIF4B (Harms et al. Reference Harms, Andreou, Gubaev and Klostermeier2014), which showed that multiple cycles of opening and closing occur per ATP hydrolysis event. The discrepancy may arise from the use of differing RNA substrates in the two studies, general differences between eIF4B and eIF4H, or differences between mammalian and yeast eIF4A. Significantly different kinetics of opening and closing were found for disparate RNA substrates in the yeast eIF4A study. Regardless, the consensus is that ATP- and RNA-dependent conformational cycling in eIF4A is rate-limiting for its duplex unwinding activity, and that accessory proteins modulate the rates of specific steps, leading to kinetic control of the efficiency of ATP utilization. Very recently, single-molecule optical-trapping experiments with eIF4A•eIF4G•eIF4B/H complexes have challenged the view of eIF4A being a non-processive helicase (García-García et al. Reference García-García, Frieda, Feoktistova, Fraser and Block2015), echoing earlier results that led to the proposal of a role for eIF4H in increasing eIF4A processivity (Richter et al. Reference Richter, Rogers, Hensold and Merrick1999; Rogers et al. Reference Rogers, Richter, Lima and Merrick2001b). These experiments showed that eIF4A effectively and processively unwinds a 72 base-pair RNA hairpin in the presence of eIF4G and either eIF4B or eIF4H. In the absence of the accessory proteins, little or no unwinding was observed. Clearly, much still remains to be learned about how mRNA structure is dynamically remodeled in early initiation.
eIF4A is by no means the only helicase involved in translation initiation in eukaryotes; mRNAs with extensive secondary structures require additional helicases to be translated efficiency (Berthelot et al. Reference Berthelot, Muldoon, Rajkowitsch, Hughes and Mccarthy2004; Marsden et al. Reference Marsden, Nardelli, Linder and Mccarthy2006). Among several other candidates, the yeast DEAD-box helicase Ded1p and its mammalian homologue DDX3 have been studied in detail (Sharma & Jankowsky, Reference Sharma and Jankowsky2014; Tarn & Chang, Reference Tarn and Chang2009). Ded1p was shown to be an essential translation factor localized in the cytoplasm, and plays a role in promoting cap-dependent initiation on mRNAs with long and structured 5′ leaders (Berthelot et al. Reference Berthelot, Muldoon, Rajkowitsch, Hughes and Mccarthy2004; Chuang et al. Reference Chuang, Weaver, Liu and Chang1997; de la Cruz et al. Reference de la Cruz, Iost, Kressler and Linder1997). Biochemical and mechanochemical experiments showed Ded1p to be a more potent helicase than yeast eIF4A in vitro (Marsden et al. Reference Marsden, Nardelli, Linder and Mccarthy2006). The kinetics of the Ded1p ATPase and RNA unwinding activities have been studied in considerable detail (Sharma & Jankowsky, Reference Sharma and Jankowsky2014). A mechanism of unwinding by ‘local strand separation’ that does not require translocation of the helicase and that involves direct binding of the helicase to the RNA duplex, followed by ATP-dependent ‘prying’ apart of the dsRNA strands has been proposed; single-stranded regions spatially near the duplex region are thought to facilitate loading of the helicase onto the duplex (Yang et al. Reference Yang, del Campo, Lambowitz and Jankowsky2007; Yang & Jankowsky, Reference Yang and Jankowsky2006). The role of conformational dynamics in this catalytic cycle was illustrated by subsequent structural studies on the related mitochondrial DEAD-box helicase Ms116p, including a structure of the protein bound to a 14-bp RNA duplex, indicated that the two RecA-like domains function independently to bind ATP and dsRNA through the phosphate backbone (Mallam et al. Reference Mallam, Del Campo, Gilman, Sidote and Lambowitz2012). Substrate binding induces a conformational change that results in formation of the ‘closed’ state and the ATPase active site. Conserved motifs in the ATP-binding domain then promote strand separation. Apart from remodeling RNA secondary structure, Ded1p has also been shown to disrupt tertiary structure by a helix capture mechanism (Pan et al. Reference Pan, Potratz, Cannon, Simpson, Ziehr, Tijerina and Russell2014), which could be relevant to its activity with mRNA substrates that possess long, structured 5′ leaders.
Yeast Ded1p and its human homologue DDX3 are functionally similar in some respects, but differ in others; their roles extend beyond direct effects on scanning in translation initiation (Tarn & Chang, Reference Tarn and Chang2009). Through an interaction with eIF4G, Ded1p both represses and stimulates translation by forming a Ded1p•eIF4F•mRNA complex that accumulates in stress granules; subsequent ATP hydrolysis resolves the stalled mRNP and leads to exit from the stress granules (Hilliker et al. Reference Hilliker, Gao, Jankowsky and Parker2011). DDX3 has also been implicated in stress granule assembly in humans, apparently through interactions with eIF4E and the PABP (Shih et al. Reference Shih, Wang, Tsai, Kuo, Li and Wu Lee2012). Ded1p is a component of both nuclear and cytoplasmic mRNPs, suggesting that it may also affect nuclear export of mRNAs as part of its impact on their translation efficiency (Senissar et al. Reference Senissar, Saux, Belgareh-Touze, Adam, Banroques and Tanner2014). DDX3 is also thought to play a role in viral infection, where it is thought both to be involved in progression of the life cycles of a range of viruses, as well as in the host immune response (Valiente-Echeverría et al. Reference Valiente-Echeverría, Hermoso and Soto-Rifo2015).
An additional mammalian DExH-box protein, DHX29, has also been implicated in promoting translation initiation through enhancing the processivity of scanning on a variety of structured mRNAs (Parsyan et al. Reference Parsyan, Shahbazian, Martineau, Petroulakis, Alain, Larsson, Mathonnet, Tettweiler, Hellen, Pestova, Svitkin and Sonenberg2009; Pisareva et al. Reference Pisareva, Pisarev, Komar, Hellen and Pestova2008). DHX29 has also been shown to bind the eIF4F complex (Soto-Rifo et al. Reference Soto-Rifo, Rubilar, Limousin, de Breyne, Décimo and Ohlmann2012) and the ribosomal 40S subunit (Dhote et al. Reference Dhote, Sweeney, Kim, Hellen and Pestova2012). Footprinting experiments showed that DHX29 helps to suppress the deleterious effects of mRNA structures such as stable stem loops that enter the mRNA-binding channel during scanning (Abaeva et al. Reference Abaeva, Marintchev, Pisareva, Hellen and Pestova2011). A cryo-EM structural study showed DHX29•GMPPNP bound to the 43S complex around helix 16, which it bridges to the beak via a number of interactions with ribosomal proteins (Hashem et al. Reference Hashem, des Georges, Dhote, Langlois, Liao, Grassucci, Hellen, Pestova and Frank2013). Cumulative results on DHX29 lead to the model that the principal role of DHX29 is to dynamically alter the conformation of the small subunit during scanning, modulating the opening and closure of the mRNA entrance and facilitating the efficient scanning of structured mRNAs through a variety of mechanisms. Further experiments will be needed to understand more fully how the DHX29–40S subunit interaction modulates scanning.
At least one study on eIF4A has highlighted that elements of the cellular environment external to the translation machinery can have a considerable impact on the activities of translation factors, which is important to consider when constructing physical models for initiation dynamics (Akabayov et al. Reference Akabayov, Akabayov, Richardson and Wagner2013). It was shown that molecular crowding stimulates the ATPase activity of eIF4A, associated with stabilization of its more compact, catalytically active structure. Indeed, poly(ethylene glycol) (PEG) was shown to increase the ATPase activity of eIF4A 6-fold. Also of importance for eIF4A activity and that of other helicases, molecular crowding has been shown to have a large effect on RNA folding thermodynamics and kinetics (Dupuis et al. Reference Dupuis, Holmstrom and Nesbitt2014), for example inducing an order-of-magnitude increase in re-folding rates for an isolated GAAA tetraloop receptor. More experiments are needed along these lines to extrapolate the results from biochemical assays on translation to more physiological conditions. The dynamic interactions of mRNA structure and the numerous helicases and other RNA-binding proteins to which mRNAs are exposed in a crowded cytoplasm represent a potentially important aspect of translational control that remains to be studied in detail.
While the global effects of mRNA structure on translation dynamics have been examined (Chen et al. Reference Chen, Zhang, Broitman, Reiche, Farrell, Cooperman and Goldman2013a; Mao et al. Reference Mao, Liu, Liu and Tao2014; Wen et al. Reference Wen, Lancaster, Hodges, Zeri, Yoshimura, Noller, Bustamante and Tinoco2008), how mRNA structures precisely modulate translation machinery remains obscure. Recent studies on eIF4A have shown that differing RNAs can exhibit substantially different effects on the kinetics of its conformational cycling (Harms et al. Reference Harms, Andreou, Gubaev and Klostermeier2014), potentially resulting in an altered contribution to RNA structural remodeling that could influence initiation efficiency.
3.1.4 Circularization
The simultaneous interactions of eIF4G with both the mRNA 5′ end through its RNA-binding domains, and with 3′ end-associated PABP (Tarun & Sachs, Reference Tarun and Sachs1996), are thought to result in a circularization of the mRNA that potentiates eIF4E–cap binding and increases translation efficiency (Gray et al. Reference Gray, Coller, Dickson and Wickens2000). This eukaryote-specific feature of translation merits some individual attention. The ‘closed loop’ model (Imataka et al. Reference Imataka, Gradi and Sonenberg1998; Kahvejian et al. Reference Kahvejian, Roy and Sonenberg2001) is supported by biochemical data confirming the interactions, the eIF4G-dependent potentiation of translation by yeast PABP Pab1p (Kahvejian et al. Reference Kahvejian, Svitkin, Sukarieh, M'Boutchou and Sonenberg2005), and by an AFM study that revealed Pab1p-dependent circularization of poly(A) mRNA (Wells et al. Reference Wells, Hillner, Vale and Sachs1998). However, little is known about how conformational dynamics and kinetics of individual interactions lead to the observed stimulation. Furthermore, it has become increasingly clear that mRNP circularization may be differentially important for stimulation of translation in different organisms and cell types, possibly owing to considerable functional redundancy in the interactions that make up the eIF4F•PABP•mRNA complex (Aitken & Lorsch, Reference Aitken and Lorsch2012). In early studies with yeast, it was shown that the molecular pathways of PABP-driven translation and cap-dependent translation are mechanistically distinct (Otero et al. Reference Otero, Ashe and Sachs1999). Later, it was shown that the eIF4G–PABP interaction is not required for wild-type cell growth in yeast unless eIF4E cap-binding and the N-terminal RNA-binding activity of eIF4G are disrupted (Park et al. Reference Park, Walker, Lee, Rothenburg, Lorsch and Hinnebusch2011). A similar effect was seen for disruption of the PABP–eIF4G interaction in mammalian cells (Hinton et al. Reference Hinton, Coldwell, Carpenter, Morley and Pain2007). There is also evidence that neither the yeast nor human PABPs need to bind poly(A) to play their role in stimulating translation (Deardorff & Sachs, Reference Deardorff and Sachs1997; Gray et al. Reference Gray, Coller, Dickson and Wickens2000) (but recall that poly(A) binding is required for the yeast Pab1p–eIF4G association (Tarun & Sachs, Reference Tarun and Sachs1996)). Rather, the ability of Pab1p to sustain yeast cell viability was correlated with its non-specific RNA binding rather than high-affinity poly(A) binding. Furthermore, recent work on circular polysomes (Afonina et al. Reference Afonina, Myasnikov, Shirokov, Klaholz and Spirin2014) has shown that their formation is independent of the cap and poly(A) tail. This combination of data has led to suggestions that it may also be advisable to revisit the mechanistic origins of the effect of the poly(A)–eIF4G–eIF4E interaction on translation efficiency, which has been noted before (Aitken & Lorsch, Reference Aitken and Lorsch2012; Valásek, Reference Valásek2012). Alternatively, the contrasting results may again reflect differences between yeast and higher eukaryotes.
Regardless of whether there is a stable, circularized mRNP with the simultaneous engagement of all of the proposed pairwise interactions, results on mRNA circularization are still an excellent demonstration of the complexity and interdependence of protein–protein and protein–mRNA interaction networks in initiation, and how dynamics can influence translation efficiency. As noted in the section on eIF4G, little biophysical investigation of these dynamics has been undertaken. What is known is that individual components may have interaction lifetimes shorter than the timescale of initiation, which means that they can dissociate and be trapped by competing interactions before initiation has completed, potentially resulting in kinetic control of initiation. For example, the lifetime of the eIF4E–cap interaction has been measured at up to ~3 s for yeast eIF4E, and ~12 ms for the human protein (O'Leary et al. Reference O'Leary, Petrov, Chen and Puglisi2013; Slepenkov et al. Reference Slepenkov, Korneeva and Rhoads2008; von Der Haar et al. Reference von der Haar, Ball and Mccarthy2000). There has been some debate over the lifetime of the eIF4E–eIF4G interaction. Early studies using SPR showed complicated dissociation kinetics with a fast phase indicating a lifetime of ~5 s, and a slower phase with a lifetime of ~300 s (Gross et al. Reference Gross, Moerke, von der Haar, Lugovskoy, Sachs, Mccarthy and Wagner2003; Ptushkina et al. Reference Ptushkina, von der Haar, Vasilescu, Frank, Birkenhager and Mccarthy1998). Later work using transient-state kinetics suggested that the lifetime of the complex is ~75 s, independent of occupancy of the eIF4E cap-binding site (Slepenkov et al. Reference Slepenkov, Korneeva and Rhoads2008). The kinetics of dissociation of the eIF4G•RNA complex have not been directly measured, although experiments with multi-RRM-containing proteins involved in mediating mRNA stability suggest that the dissociation rates can range from tens to hundreds of seconds (Kim et al. Reference Kim, Wilce, Yoga, Pendini, Gunzburg, Cowieson, Wilson, Williams, Gorospe and Wilce2011; Park et al. Reference Park, Myszka, Yu, Littler and Laird-Offringa2000). An SPR study of the interaction of an N-terminal fragment of human eIF4G1 with the RRM 1-4 region of human PABPC determined an association rate of 0·3 µM–1 s–1 and a dissociation rate of 0·0062 s–1 (corresponding to a half-life of >100 s (Karim et al. Reference Karim, Svitkin, Kahvejian, de Crescenzo, Costa-Mattioli and Sonenberg2006)), but in principle these kinetics may differ in the presence of bound RNA. Nevertheless, once the eIF4G–Pab1p interaction is established, it would appear to persist during the entire initiation phase on most mRNAs. Conversely, the dissociation of PABP from poly(A), as measured by nanopore force spectroscopy (Lin et al. Reference Lin, Fabian, Sonenberg and Meller2012), appears to be very fast relative to the dissociation of the eIF4G–PABP interaction.
3.2 mRNA recruitment, scanning, and start codon selection
After the mRNA has been prepared, it must be recruited to the 40S ribosomal subunit and the start codon must be located. This biomolecular recognition event is guided by the factors decorating the mRNA and 40S subunit, and involves dynamics on a range of length- and timescales that leverage compositional and conformational changes to guide initiation. A very great deal of work has been done on understanding the molecular mechanisms of these processes, and within this, biophysical and structural methods have been to the forefront (Aitken & Lorsch, Reference Aitken and Lorsch2012; Fraser, Reference Fraser2015). These studies have in part been made possible by the development of reconstituted systems with purified components for studying the steps in detail for translation in yeast (Acker et al. Reference Acker, Kolitz, Mitchell, Nanda and Lorsch2007; Algire et al. Reference Algire, Maag, Savio, Acker, Tarun, Sachs, Asano, Nielsen, Olsen, Phan, Hinnebusch and Lorsch2002) and mammals (Pestova et al. Reference Pestova, Borukhov and Hellen1998, Reference Pestova, Lomakin, Lee, Choi, Dever and Hellen2000).
Among the earliest stages in the process where dynamics play a key role is the preparation of the 40S subunit for mRNA binding. Biophysical and cryo-EM studies show that the subunit is held in an mRNA-receptive, ‘open’ conformation by eIFs-1 and -1A, which bind it co-operatively and accelerate binding of the eIF2•GTP•Met-tRNAi ternary complex (Maag & Lorsch, Reference Maag and Lorsch2003; Passmore et al. Reference Passmore, Schmeing, Maag, Applefield, Acker, Algire, Lorsch and Ramakrishnan2007; Thomas et al. Reference Thomas, Goumans, Voorma and Benne1980a, Reference Thomas, Spaan, van Steeg, Voorma and Benneb). Further crystallographic studies confirmed that both proteins bind h44 of the 40S subunit near the mRNA channel. Careful thermodynamic analysis has recently highlighted how the 43S pre-initiation complex containing eIFs -1 and -1A, the eIF2•GTP•Met-tRNAi ternary complex, the multi-subunit factor eIF3, and eIF5, is stabilized by an intricate network of cooperative interactions between the bound factors, with eIF3 playing a central role in modulating the affinities of the other factors (Sokabe & Fraser, Reference Sokabe and Fraser2014). The mRNA is then recruited using what appears to be a highly interconnected network of biomolecular contacts; the precise architecture and sequence of events is still incompletely understood (Fraser, Reference Fraser2015). Structural studies – both using crystallography and electron microscopy – have shed further light on specific portions of the initiation machinery. A crystallographic study showed the positions of eIF1 and eIF1A on the 40S ribosomal subunit (Weisser et al. Reference Weisser, Voigts-Hoffmann, Rabl, Leibundgut and Ban2013), identifying the contacts the factors make with the subunit and showing that they produce local, but not global conformational changes relative to the subunit in the context of the 80S ribosome, and suggesting that their cooperative binding to the 40S subunit is mediated by helix 44.
As noted above, eIF3 is central to mRNA recruitment. This multi-subunit protein (Hinnebusch, Reference Hinnebusch2006; Valásek, Reference Valásek2012) binds to the solvent face of the 40S ribosomal subunit, contacting numerous initiation factors and ribosomal components. eIF3 represents one of the major points of difference between translation initiation in budding yeast and in mammals, in that the yeast protein consists of a core of five essential, distinct subunits, whilst the mammalian protein contains 13 subunits. The largest yeast eIF3 subunit, Tif32p/eIF3a, has been shown to be required for binding of the 43S complex to the mRNA, through its PCI domain (Khoshnevis et al. Reference Khoshnevis, Gunisova, Vlckova, Kouba, Neumann, Beznoskova, Ficner and Valasek2014). A crystal structure of the WD40 domain of Chaetomium thermophilum eIF3b led to the suggestion that its nine-bladed β-propellor fold is conserved across eukaryotic species and that it interacts with the 40S subunit through S9e and the 18S rRNA (Liu et al. Reference Liu, Neumann, Kuhle, Monecke, Schell, Chari and Ficner2014b). The Nip1p/eIF3c subunit mediates pre-initiation complex assembly, through an interaction with eIF5, and start codon recognition, through an interaction with eIF1 (Karaskova et al. Reference Karaskova, Gunisova, Herrmannova, Wagner, Munzarova and Valasek2012). In addition to promoting 43S-mRNA recruitment, the Hcr1p/eIF3j subunit has been implicated in termination and stop codon recognition in an in vivo system (Beznoskova et al. Reference Beznoskova, Cuchalova, Wagner, Shoemaker, Gunisova, von der Haar and Valasek2013). Assigning the roles of individual eIF3 subunits in initiation is an active, ongoing area of research that will be aided by developments in structural biology of initiation and further biophysical measurements.
In mammals, the eIF3–eIF4G interaction has been proposed to play a significant role in promoting binding of eIF4F-bound mRNA, through interaction of eIF4G with the eIF3c, –d and –e subunits (Lamphear et al. Reference Lamphear, Kirchweger, Skern and Rhoads1995; LeFebvre et al. Reference Lefebvre, Korneeva, Trutschl, Cvek, Duzan, Bradley, Hershey and Rhoads2006; Villa et al. Reference Villa, Do, Hershey and Fraser2013). In yeast, a direct eIF3–eIF4G interaction has not been demonstrated; however, as noted above yeast eIF4G binds to eIF5, which in turn binds to eIF3; these interactions were proposed to represent a potential functional substitute (He et al. Reference He, von der Haar, Singh, Ii, Li, Hinnebusch, Mccarthy and Asano2003).
Alternatively, eIF5 binding to eIF4G and eIF2β was more recently proposed as a possible mechanism for stabilization of the 48S complex (Singh et al. Reference Singh, Watanabe, Chowdhury, Hiraishi, Murai, Yamamoto, Miles, Ikeda, Asano and Asano2012). Nevertheless, subsequent studies on recruitment to the yeast 40S subunit of a range of synthetic and natural mRNAs showed that capped mRNAs are efficiently recruited in the presence of eIF4F and eIF3 alone, that uncapped mRNAs require only eIF3 for efficient recruitment in a pathway that is blocked by the triphosphate portion of the cap structure, and that eIF4B can modulate the efficiency of recruitment (Mitchell et al. Reference Mitchell, Walker, Algire, Park, Hinnebusch and Lorsch2010). At least in higher eukaryotes, one component of the eIF3-mediated stimulation of mRNA–40S subunit association is direct contact between the eIF3 subunits and mRNA, as detected by UV crosslinking experiments (Pisarev et al. Reference Pisarev, Kolupaeva, Yusupov, Hellen and Pestova2008). These studies also detected interactions between mRNA and eIF2. A model to explain the modulatory effects of yeast eIF4B on mRNA recruitment was subsequently put forward in terms of its ability to bind the head of the 40S subunit at Rps20, potentially inducing conformational changes in the 40S subunit that promote mRNA binding (Walker et al. Reference Walker, Zhou, Mitchell, Larson, Valasek, Hinnebusch and Lorsch2013).
Cryo-EM studies have also begun to provide structural information on the 43S complex. The structure of the mammalian 43S complex bound to the helicase DHX29 provided insights into the interactions of eIF2 and eIF3 with the 40S subunit (Hashem et al. Reference Hashem, des Georges, Dhote, Langlois, Liao, Grassucci, Hellen, Pestova and Frank2013). Cryo-EM analysis of a late-stage intermediate in initiation highlighted conformational changes that occur along the initiation pathway. A combination of crystallography, cryo-EM, crosslinking mass spectrometry, and structure modeling provided insights into the structure of the yeast 40S•eIF1•eIF3 complex, suggesting a model for how eIF3 engages the 40S subunit and positions other factors to establish a scaffold for several of the activities of initiation (Erzberger et al. Reference Erzberger, Stengel, Pellarin, Zhang, Schaefer, Aylett, Cimermancic, Boehringer, Sali, Aebersold and Ban2014) (Fig. 21A).
Cryo-electron microscopy of the eukaryotic ribosome. This technique is particularly well suited to both integrating mechanism with structure, as well as directly examining dynamics in a structural context. (a) 40S•eIF1•eIF3 structure showing locations of eIF3 subunits and eIF1. Excerpted with permission from Erzberger et al. (Reference Erzberger, Stengel, Pellarin, Zhang, Schaefer, Aylett, Cimermancic, Boehringer, Sali, Aebersold and Ban2014). (b) Reorientation of P-site initiator tRNA linked to eIF5B GTPase activity in the final stages of initiation, determined by cryo-EM reconstruction. From Yamamoto et al. (Reference Yamamoto, Unbehaun, Loerke, Behrmann, Collier, Bürger, Mielke and Spahn2014).

From the perspective of the mRNA, structural dynamics are also of considerable importance. mRNAs with extensive secondary structure show an increased requirement for eIF4A in order to be efficiently translated (Svitkin et al. Reference Svitkin, Pause, Haghighat, Pyronnet, Witherell, Belsham and Sonenberg2001), suggesting that dynamic remodeling of their structures is a key component of initiation. As has been seen, the roles of eIF4B and eIF4H in modulating eIF4A activity, also rely on structural elements of the mRNA. A question of some importance that has long remained unanswered is where the eIF4F complex resides after recruitment of the mRNA to the 43S complex. This has important implications for dynamics, since the available evidence suggests that the eIF4A unwinding activity is important for scanning (Spirin, Reference Spirin2009).
The role of dynamics in mediating translation efficiency is arguably most prominent during the scanning phase of initiation. Relatively large-scale motions are required to produce the net movement of the ribosome from its apparent binding site near the 5′ end of the RNA to the start codon. However, little is known of the detailed molecular mechanisms underlying the motion of the ribosome toward the start codon, and for many of the proposed models there are either no data, or conflicting supporting data (Alekhina & Vassilenko, Reference Alekhina and Vassilenko2012; Hinnebusch, Reference Hinnebusch2011). It is probably no coincidence that the least well understood component of initiation is also its most dynamic – the field simply has not been equipped with experimental tools to study such phenomena. The advent of single-molecule techniques, along with imaging methods such as cryo-EM that provide structural context, will likely accelerate progress.
The closest start codon to the mRNA 5′ end is almost always the (first) site of initiation (Kozak, Reference Kozak2002), and that reinitiation on subsequent start codons is possible and occurs sequentially in a 5′ to 3′ direction; this forms the basis of translational control mediated by reinitiation after upstream open reading frames (uORFs), perhaps most prominently studied in the case of yeast GCN4 (Hinnebusch, Reference Hinnebusch2005, Reference Hinnebusch2011). One of the questions most frequently asked in early studies on scanning revolved around whether it occurred through a linear or a bi-directional diffusive mechanism. The effects of 5′-UTR length on scanning were studied (Berthelot et al. Reference Berthelot, Muldoon, Rajkowitsch, Hughes and Mccarthy2004, Vassilenko et al. Reference Vassilenko, Alekhina, Dmitriev, Shatsky and Spirin2011) using luciferase-based assays with synthetic 5′-UTRs to show that the 43S complex was stably attached to even long (up to 1770 nt) 5′-UTRs in vivo. Movement of the 40S subunit in the scanning process was interpreted based on these data as a biased bidirectional walk. Subsequent measurements using wheat germ and mammalian in vitro translation systems suggested that scanning is unidirectional and its rate is essentially independent of mRNA sequence and, perhaps surprisingly, of secondary structures with stabilities up to –30 kcal mol–1. The presence of secondary structures in the mRNA 5′-UTR was found to impede initiation to a much greater extent for yeast ribosomes than for those of higher eukaryotes (Oliveira et al. Reference Oliveira, van den Heuvel and Mccarthy1993; Vega Laso et al. Reference Vega Laso, Zhu, Sagliocco, Brown, Tuite and Mccarthy1993); this again highlights the differences between aspects of the initiation mechanism in higher and lower eukaryotes.
A second unanswered question involves the roles of the initiation factors in determining the processivity and directionality of the scanning process. This revolves around the activities of the eIF4F proteins, in particular the helicase eIF4A. The issue of kinetic control, while not often explicitly associated with this aspect of scanning, is pertinent to the activity of eIF4A and other DEAD-box helicases such as Ded1p/DDX3 and DHX29 (Sharma & Jankowsky, Reference Sharma and Jankowsky2014). The processivity of scanning might be viewed as a direct surrogate for forward commitment through intermediate 43S•mRNA intermediates to location of the start codon. While the general idea that the role of ATP hydrolysis and helicase activity in scanning is to promote unidirectionality in the linear scanning process, the mechanistic details of how this is achieved remain unclear (Spirin, Reference Spirin2009).
The movement of the mRNA through the 40S ribosomal subunit has been shown to depend on the sequence of the RNA, and the effects of substitution of individual nucleotides with nucleotide analogs are not the same on scanning and elongation (Aspden & Jackson, Reference Aspden and Jackson2010). This suggests that the mechanisms of sequence recognition during scanning and elongation differ substantially, confirming the importance of the protein factors in mediating these processes. It also, however, contrasts with the results that showed that scanning rate is independent of mRNA sequence and structure; the reasons for this discrepancy remain incompletely understood.
Identification and faithful selection of the start codon involves a combination of the activities of eIF2•GTP•Met-tRNAi, eIF1, eIF1A, eIF5, and eIF3. Here again, highly intricate conformational dynamics and kinetic control have been shown to play a central role (reviewed in (Hinnebusch, Reference Hinnebusch2011)). Numerous detailed studies have implicated a sequence of conformational rearrangements involving eIF1, eIF1A, eIF5, and the eIF2 ternary complex that is triggered by start codon recognition. Establishment of a codon–anticodon interaction between the mRNA and eIF2-bound Met-tRNAi, is monitored by eIF1, which is located adjacent to the ribosomal P site and prevents full accommodation of the tRNAi along with the C-terminal tail of eIF1A (Lomakin & Steitz, Reference Lomakin and Steitz2013; Rabl et al. Reference Rabl, Leibundgut, Ataide, Haag and Ban2011; Saini et al. Reference Saini, Nanda, Lorsch and Hinnebusch2010; Yu et al. Reference Yu, Marintchev, Kolupaeva, Unbehaun, Veryasova, Lai, Hong, Wagner, Hellen and Pestova2009). An equilibrium assay for FRET between eIF1 and eIF1A showed that eIF1 and eIF1A move away from each other upon start codon recognition, and that the affinity of the 43S•mRNA complex for eIF1 is reduced almost 40-fold in the presence of the eIF2 ternary complex and an AUG codon in the mRNA (Maag et al. Reference Maag, Fekete, Gryczynski and Lorsch2005; Nanda et al. Reference Nanda, Saini, Munoz, Hinnebusch and Lorsch2013). It was then shown that eIF5-promoted GTP hydrolysis by eIF2 in fact occurs before start codon recognition, and that start codon recognition leads to irreversible release of Pi from eIF2, gated by the ejection of eIF1 from the PIC (Algire et al. Reference Algire, Maag and Lorsch2005). Subsequent studies showed that start codon recognition also potentiates an interaction between eIF1A and eIF5; this was proposed to result in a shift of equilibria in the 43S complex that stabilizes the ‘closed’ state (Maag et al. Reference Maag, Algire and Lorsch2006). In this closed conformation, scanning is arrested; at this point, the initiator tRNA also moves from its initial POUT position to an accommodated PIN state (Saini et al. Reference Saini, Nanda, Lorsch and Hinnebusch2010). Later studies suggested a model where full tRNA accommodation causes the C-terminal tail of eIF1A to move toward eIF5, an event that is coupled to ejection of eIF1 from the PIC (Nanda et al. Reference Nanda, Saini, Munoz, Hinnebusch and Lorsch2013). The coupling is mediated by an intricate rearrangement of the interactions between eIF1, eIF1A, eIF5, and eIF2β (Zhang et al. Reference Zhang, Saini, Shin, Nanda and Hinnebusch2015). A cryo-EM structure of a yeast 48S complex with the tRNA in the PIN state – with eIF1 still present – showed that the tRNAi codon–anticodon interaction is stabilized in the PIN state by the N-terminal tail of eIF1A (Hussain et al. Reference Hussain, Llácer, Fernández, Munoz, Martin-Marcos, Savva, Lorsch, Hinnebusch and Ramakrishnan2014), consistent with the earlier biochemical and genetics studies. eIF1A was shown to remain associated with the initiating ribosome and is then involved in the eIF5B-dependent downstream events that lead to subunit joining and factor release (Acker et al. Reference Acker, Shin, Nanda, Saini, Dever and Lorsch2009). This network of protein-protein and protein–RNA interactions that kinetically controls a key event in initiation is one of the best characterized of many such proposed networks in initiation.
3.3 Subunit joining
The start codon recognition phase of initiation is followed by subunit joining, mediated by the GTPase eIF5B, the eukaryotic version of bacterial IF2. eIF5B was shown to act catalytically in subunit joining only if GTP is present; when GDPNP was added, eIF5B promoted subunit joining only in a stoichiometric manner, suggesting that GTP hydrolysis is required only for the dissociation of eIF5B from the 80S initiation complex (Pestova et al. Reference Pestova, Lomakin, Lee, Choi, Dever and Hellen2000). Transient-state kinetic studies later confirmed that, along with eIF1A, eIF5B stimulates subunit joining, and proposed that consistent with its identity as a translational GTPase, its activity in mediating subunit joining depends on a conformation of eIF5B induced by GTP binding (Acker et al. Reference Acker, Shin, Nanda, Saini, Dever and Lorsch2009). GTP hydrolysis by eIF5B leads to rapid dissociation of eIF1A from the ribosome and also to eIF5B dissociation. The cryo-EM structure of the 80S initiation complex in complex with Met-tRNA i and eIF5B•GDPCP (Fernández et al. Reference Fernández, Bai, Hussain, Kelley, Lorsch, Ramakrishnan and Scheres2013) was determined, and showed that eIF5B interacts with the Met-tRNAi in the P site as well as the ribosomal GTPase center, in a conformation distinct from its nucleotide bound form in solution. Subsequent reanalysis of the cryo-EM dataset suggested that in contrast to the original proposal, this interaction includes direct contacts between the conserved domain IV of eIF5B and the aminoacylated CCA-end of the initiator tRNA (Kuhle & Ficner, Reference Kuhle and Ficner2014b), analogous to the situation for bacterial IF2. Crystallographic studies led to the proposal of ‘domain release mechanism’ for eIF5B activity, where GTP binding results in conformational changes that increase the flexibility of the protein (Kuhle & Ficner, Reference Kuhle and Ficner2014a). The recent crystallographic results and the cryo-EM data contrast with a more rigid ‘articulated lever’ model proposed earlier based on crystallographic studies of archaeal eIF5B (Roll-Mecak et al. Reference Roll-Mecak, Cao, Dever and Burley2000). A further crystallography study of Thermus thermophilus IF2 also suggested that eIF5B likely does not operate using the ‘articulated lever’ model (Eiler et al. Reference Eiler, Lin, Simonetti, Klaholz and Steitz2013). Recently, cryo-EM data have added nuance to the role of eIF5B in late initiation, namely that as a secondary function to its promotion of subunit joining, its activity can reorient the initiator tRNA in the 80S P site such that elongation can begin (Yamamoto et al. Reference Yamamoto, Unbehaun, Loerke, Behrmann, Collier, Bürger, Mielke and Spahn2014) (Fig. 21B).
Subunit joining is the final step where all initiation pathways are converging. Most structural information on mechanisms of 80S formation and transition to elongation comes from studies of internal ribosome entry sites (IRESes). IRESes rely on a reduced set of factors with mRNA taking their role. Recent advances in cryo-EM have resulted in number of ribosome-IRES structures in the last few years. Hepatitis C virus IRES is one of the best-studied human IRESes. The structure of the naked 80S•HCV IRES complex demonstrated that the IRES itself can funnel the 80S ribosome into three different conformations: prokaryotic-like rotated and non-rotated states, as well as eukaryotic-specific rolled state that resemble pre-translocation intermediate (Yamamoto et al. Reference Yamamoto, Collier, Loerke, Ismer, Schmidt, Hilal, Sprink, Yamamoto, Mielke, Bürger, Shaikh, Dabrowski, Hildebrand, Scheerer and Spahn2015). The presence of these conformers clearly indicates the structural heterogeneity along initiation pathways. Remarkably, the 80S•HCV IRES•eIF5B•GDPNP complex was also found to be in two distinct conformations (Yamamoto et al. Reference Yamamoto, Unbehaun, Loerke, Behrmann, Collier, Bürger, Mielke and Spahn2014) that are similar to pre- and post-translocated states of the eukaryotic ribosome (Budkevich et al. Reference Budkevich, Giesebrecht, Altman, Munro, Mielke, Nierhaus, Blanchard and Spahn2011). It was hypothesized that GTP hydrolysis by eIF5B occurs in the pre-like state, and the resulting complex adopts post-like conformation, thus allowing first tRNA binding.
Dicistroviridae intergenic IRESes are extreme in not utilizing any initiation factors and solely relying on mRNA structure to promote initiation. The structures of 80S complexes with Taura syndrome virus IRES and Cricket Paralysis Virus IRES were recently solved. The 80S complexes assembled over TSV IRES were found in two partially rotated states (Koh et al. Reference Koh, Brilot, Grigorieff and Korostelev2014). Similarly, Cryo-EM studies of 80S•CrPV IRES complexes showed ribosomes in both rotated and non-rotated states (Fernandez et al. Reference Fernandez, Bai, Murshudov, Scheres and Ramakrishnan2014). Notably, the domain III of the IRES, that mimics tRNA and mRNA occupied the A site of the ribosome, preventing A-site tRNA binding in both rotated and non-rotated complexes (Fernandez et al. Reference Fernandez, Bai, Murshudov, Scheres and Ramakrishnan2014; Koh et al. Reference Koh, Brilot, Grigorieff and Korostelev2014). Translocation by eEF2, the eukaryotic homolog of EF-G, is required to move the IRES from A site to the P site, thus allowing the first tRNA binding. In prokaryotes, translocation is tightly coupled to the reverse rotation (Chen et al. Reference Chen, Tsai, O'LEARY, Petrov and Puglisi2012a). It is reasonable to expect that eEF2 catalyzed translocation is also coupled to the inter-subunit movement in 80S•CrPV complexes. Interestingly, when first codon in CrPV IRES was replaced with a stop codon, and complexes were assembled in the presence of termination factors, all functional ribosomes were found in the non-rotated state (Muhs et al. Reference Muhs, Hilal, Mielke, Skabkin, Sanbonmatsu, Pestova and Spahn2015), indicating that elongation active complexes are uniform with respect to intersubunit conformation.
The late steps of IRES-driven initiation seem to follow a common scheme – the presence of multiple conformational intermediates, followed by intersubunit rearrangement catalyzed by a GTPase. The requirement for intersubunit movement during initiation is strikingly reminiscent to the prokaryotic initiation. In prokaryotes, subunits are also joined in the rotated conformation. GTP hydrolysis by IF2 is needed to facilitate intersubunit rotation and adoption of the non-rotated ribosomal conformation (Marshall et al. Reference Marshall, Aitken and Puglisi2009, Reference Marshall, Dorywalska and Puglisi2008). This promotes IF2 dissociation and allows first elongator tRNA binding (Antoun et al. Reference Antoun, Pavlov, Andersson, Tenson and Ehrenberg2003; Tsai et al. Reference Tsai, Petrov, Marshall, Korlach, Uemura and Puglisi2012).
What is significance of intersubunit movement during initiation that spans all domains of life? The tight coupling between elongation progression and rotational state of the ribosomes was previously demonstrated in prokaryotes (Aitken & Puglisi, Reference Aitken and Puglisi2010; Marshall et al. Reference Marshall, Dorywalska and Puglisi2008). The same scheme now begins to emerge in eukaryotic translation (Budkevich et al. Reference Budkevich, Giesebrecht, Altman, Munro, Mielke, Nierhaus, Blanchard and Spahn2011, Reference Budkevich, Giesebrecht, Behrmann, Loerke, Ramrath, Mielke, Ismer, Hildebrand, Tung, Nierhaus, Sanbonmatsu and Spahn2014; Svidritskiy et al. Reference Svidritskiy, Brilot, Koh, Grigorieff and Korostelev2014). Thus conformational heterogeneity of IRES-containing initiation complexes must be resolved prior to the beginning of the elongation, or during the first elongation step. Potentially, intersubunit rotation promoted by eIF5B in HCV IRES and eEF2 in CrPV IRES might be needed to select for correctly assembled initiation complexes and bias against dead-end intermediates that would not be able to undergo the rotation and enter elongation. It might also funnel structurally distinct conformers that arise from various initiation pathways into the single elongation ready complex. The direct tracking of the rotational state along initiation pathway and well as further structural information on initiation complexes are needed to pinpoint the functional role of the intersubunit rearrangements during translation initiation.
3.4 Elongation
The process of elongation is the most conserved step in translation across the domains of life. Decoding and accommodation of elongator tRNA, peptidyl transfer, and translocation occur within the structurally conserved ribosomal core. Furthermore, many of these processes are mediated in prokaryotes and eukaryotes by functionally similar factors. As described above, prokaryotic elongation has been studied extensively and much of the resulting mechanistic insight is applicable to eukaryotic translation elongation (Melnikov et al. Reference Melnikov, Ben-Shem, Garreau de Loubresse, Jenner, Yusupova and Yusupov2012; Wilson & Doudna Cate, Reference Wilson and Doudna Cate2012). However, there are also significant differences that result in distinct mechanistic motifs.
During decoding in eukaryotes, cognate aa-tRNA is delivered to the A site in a ternary complex with the GTPase eEF1A (EF-Tu in bacteria) and GTP. Following GTP hydrolysis, eEF1A·GDP is recycled for subsequent rounds of elongation by the guanine nucleotide exchange factor eEF1B (EF-Ts in bacteria), which is a heterodimeric complex of eEF1Bα and -Bδ (Marcinkiewicz et al. Reference Marcinkiewicz, Gajko and Galasinski1991). After tRNA accommodation in the A site, the nascent peptide chain is transferred from the P-site tRNA to the A-site tRNA. The eukaryotic GTPase eEF2 (EF-G in bacteria) binds the GTPase center of the 60S ribosomal subunit and catalyzes translocation of the A- and P-site tRNAs and mRNA by one codon. The predominant conformation of eEF2-bound ribosomes with tRNA in the E site differs from bacterial ribosomes with tRNA in the hybrid P/E or the classical P state (Frank & Agrawal, Reference Frank and Agrawal2000; Pulk & Cate, Reference Pulk and Cate2013; Tourigny et al. Reference Tourigny, Fernandez, Kelley and Ramakrishnan2013; Zhou et al. Reference Zhou, Lancaster, Donohue and Noller2013; Gao et al. Reference Gao, Selmer, Dunham, Weixlbaumer, Kelley and Ramakrishnan2009). Additionally, tRNA and ribosome dynamics also differ between eukaryotic and prokaryotic translation (Ferguson et al. Reference Ferguson, Wang, Altman, Terry, Juette, Burnett, Alejo, Dass, Parks, Vincent and Blanchard2015).
In contrast to prokaryotes where E-site tRNA departure is spontaneous after translocation (Uemura et al. Reference Uemura, Aitken, Korlach, Flusberg, Turner and Puglisi2010), in yeast, the ribosome-dependent ATPase activity of eEF3 is required for the release of tRNA from the E site (Andersen et al. Reference Andersen, Becker, Blau, Anand, Halic, Balar, Mielke, Boesen, Pedersen, Spahn, Kinzy, Andersen and Beckmann2006; Triana-Alonso et al. Reference Triana-Alonso, Chakraburtty and Nierhaus1995). In higher eukaryotes, intrinsic eEF3-like ATPase/GTPase activity may be responsible for mediating tRNA release from the E site (El'skaya et al. Reference EL'SKAYA, Ovcharenko, Palchevskii, Petrushenko, Triana-Alonso and Nierhaus1997; Rodnina et al. Reference Rodnina, Serebryanik, Ovcharenko and El'Skaya1994). A-site tRNA occupancy on the mammalian ribosome stimulates intrinsic ATPase activity and the subsequent release of tRNA from the E site (Rodnina et al. Reference Rodnina, Serebryanik, Ovcharenko and El'Skaya1994). In bacteria, RbbA, a ribosome dependent ATPase, shares some functional similarity with eEF3 (Kiel et al. Reference Kiel, Aoki and Ganoza1999; Kiel & Ganoza, Reference Kiel and Ganoza2001). However, RbbA is not strictly required for bacterial elongation and its role in elongation is not clear.
The crystal structure of eEF3 alone and the cryo-EM structure of eEF3 bound to ribosome nascent chain complexes suggest a mechanism for tRNA release by which binding of eEF3·ATP to post-translocated ribosomes results in movement of the L1 stalk from an ‘in’ conformation to an ‘open’ conformation, thereby unlocking the E site for tRNA dissociation (Andersen et al. Reference Andersen, Becker, Blau, Anand, Halic, Balar, Mielke, Boesen, Pedersen, Spahn, Kinzy, Andersen and Beckmann2006). Additionally, the positioning of eEF3·ATP near the ribosomal E suggests the protein may also influence 40S head movement, which can alter tRNA E-site affinity. Subsequent ATP hydrolysis and dissociation of eEF3 is required for E-site tRNA dissociation (Andersen et al. Reference Andersen, Becker, Blau, Anand, Halic, Balar, Mielke, Boesen, Pedersen, Spahn, Kinzy, Andersen and Beckmann2006). Temperature-sensitive eEF3 mutations that disrupt ATPase activity result in decreased biding of aa-tRNA by eEF1A to the ribosome (Anand et al. Reference Anand, Chakraburtty, Marton, Hinnebusch and Kinzy2003, Reference Anand, Balar, Ulloque, Gross and Kinzy2006). Whether the affect on eEF1A binding is due to direct eEF3–eEF1A interactions post eEF3 ATPase activity or indirectly due to eEF3-mediated departure of E-site tRNA acting as an allosteric switch is unclear. A recent smFRET study directly demonstrated A-site–E-site allostery in an in vitro human translation system (Ferguson et al. Reference Ferguson, Wang, Altman, Terry, Juette, Burnett, Alejo, Dass, Parks, Vincent and Blanchard2015).
Comparison of eukaryotic and prokaryotic ribosome structures in analogous states has been particularly useful in elucidating additional distinctions between eukaryotic and prokaryotic elongation. Both prokaryotic and eukaryotic ribosomes undergo large-scale rotations during translocation but the mechanisms of rotation and subsequent molecular rearrangements are distinct (Budkevich et al. Reference Budkevich, Giesebrecht, Altman, Munro, Mielke, Nierhaus, Blanchard and Spahn2011; Svidritskiy et al. Reference Svidritskiy, Brilot, Koh, Grigorieff and Korostelev2014). A cryo-EM study of the yeast 80S ribosome–tRNA complexes with P-site and E-site tRNAs, the ribosome was observed in a non-rotated state representing a POST state. Compared with the prokaryotic ribosome in a similar state, the 40S head tilt relative to the 60S subunit differed by 7 Å and P-site tRNA and E-site tRNA are 15 Å closer in the eukaryotic ribosome (Svidritskiy et al. Reference Svidritskiy, Brilot, Koh, Grigorieff and Korostelev2014). The rotated conformation of the yeast ribosome with P/E tRNA bound was similar to that seen in a mammalian 80S ribosome structures that contained both A/P and P/E tRNAs suggesting that the A/P tRNA does not substantially affect eukaryotic ribosome conformation prior to translocation (Budkevich et al. Reference Budkevich, Giesebrecht, Altman, Munro, Mielke, Nierhaus, Blanchard and Spahn2011). A later cryo-EM study of the mammalian 80S ribosome in a POST state and in complex with ternary complex showed a distinct global conformational rearrangement specific to eukaryotic ribosomes termed ‘subunit rolling’ that converts the POST-state ribsome to the classical PRE-state ribosome following accommodation of A-site tRNA (Budkevich et al. Reference Budkevich, Giesebrecht, Behrmann, Loerke, Ramrath, Mielke, Ismer, Hildebrand, Tung, Nierhaus, Sanbonmatsu and Spahn2014). Collectively, the results suggest eukaryotic ribosomes sample a larger conformational landscape than the prokaryotic ribosome which may signify additional dynamic interactions and conformational rearrangements between ribosomal subunits, tRNA and elongation factors. Continued advancement in eukaryotic ribosomal structure and biophysical characterization will further delineate mechanistic differences between of prokaryotic a eukaryotic translation elongation.
3.5 eIF5A
Early studies aimed at identifying eukaryotic initiation factors utilized a methionyl-puromycin formation assay as a proxy for peptidyl transfer in the first round of elongation, to elucidate the roles of protein factors. These studies identified a 16–18 kDa factor, initially designated eIF-4D and later known as eIF5A, that stimulated Met-puromycin synthesis, but not Met-tRNAiMet or mRNA binding to the 43/48S PIC, or 80S initiation complex formation (Benne & Hershey, Reference Benne and Hershey1978; Kemper et al. Reference Kemper, Berry and Merrick1976; Schreier et al. Reference Schreier, Erni and Staehelin1977). These results, together with data indicating that eIF5A did not stimulate polyphenylalanine synthesis, led to the conclusion that eIF5A is not a general activator of peptide bond formation but rather a specialized factor involved in formation of the first peptide bond. Furthermore, eIF5A did not stimulate globin synthesis, a likely consequence of the experimental conditions; although the possibility that eIF5A acts only on a subset of natural mRNAs was not excluded. Much of the subsequent work on eIF5A has been focused on elucidating the precise role and of eIF5A in protein synthesis (Dever et al. Reference Dever, Gutierrez and Shin2014; Park et al. Reference Park, Nishimura, Zanelli and Valentini2010; Rossi et al. Reference Rossi, Kuroshu, Zanelli and Valentini2014).
Advancements in yeast genetics facilitated the development of several conditionally sensitive eIF5A mutants that have been essential for developing an understanding of the role of eIF5A in translation in vivo. In an early yeast study, using a protein destabilizing element and the GAL promoter to deplete eIF5A resulted in a decrease in protein synthesis rate of 30% and apparently normal polysome profiles indicating eIF5A is not required for general protein synthesis (Kang & Hershey, Reference Kang and Hershey1994). These results bolstered the hypothesis that eIF5A might promote initiation, or even elongation, on a specific subset of mRNAs. Indeed, a yeast strain expressing a temperature sensitive mutant of eIF5A was used in polyribosome profiling and ribosome transit assays to show that eIF5A inactivation results in an elongation-deficient phenotype, rather than an initiation-deficient one (Saini et al. Reference Saini, Eyler, Green and Dever2009). Furthermore, under permissive temperatures, +1 ribosomal-programmed frame-shifting was inhibited, suggesting a functional interaction between eEF2 and eIF5A (Saini et al. Reference Saini, Eyler, Green and Dever2009) and providing further evidence that eIF5A is an elongation factor. It should be noted that, conversely, similar studies analyzing polysome profiles from eIF5A temperature sensitive mutants have suggested that eIF5A acts as an initiation factor rather than an elongation factor (Henderson & Hershey, Reference Henderson and Hershey2011). Discrepancies between the results could be to differences in assay endpoint timing or more nutritional conditions (Henderson & Hershey, Reference Henderson and Hershey2011). Consistently, eIF5A, whether functioning as an initiation or elongation factor, seems to be a specialized factor that acts on a subset of mRNAs. Although the subset(s) of mRNAs targeted by eIF5A have not been defined completely, eIF5A clearly plays a role in the translation of polyproline motifs (Gutierrez et al. Reference Gutierrez, Shin, Woolstenhulme, Kim, Saini, Buskirk and Dever2013; Mandal et al. Reference Mandal, Mandal and Park2014).
Using a dual luciferase reporter system used for determining codon-specific effects on translation elongation rates and toe print analysis (Gutierrez et al. Reference Gutierrez, Shin, Woolstenhulme, Kim, Saini, Buskirk and Dever2013), demonstrated that the eukaryotic ribosome stalls during the translation of polyproline motifs in the absence of eIF5A. Similarly, the prokaryotic counterpart of eIF5A, EF-P is also involved in polyproline translation. EF-P is a specialized elongation factor involved in the rectification of polyproline-induced ribosomal stalling (Doerfel et al. Reference Doerfel, Wohlgemuth, Kothe, Peske, Urlaub and Rodnina2013; Peil et al. Reference Peil, Starosta, Lassak, Atkinson, Virumae, Spitzer, Tenson, Jung, Remme and Wilson2013; Ude et al. Reference Ude, Lassak, Starosta, Kraxenberger, Wilson and Jung2013; Woolstenhulme et al. Reference Woolstenhulme, Parajuli, Healey, Valverde, Petersen, Starosta, Guydosh, Johnson, Wilson and Buskirk2013). While the mechanism of EF-P function is not fully understood, quench-flow kinetic measurements of peptidyl transfer using several proline analogues, that probe the activation parameters for peptide bond formation with and without EF-P, indicate that differences in the free energy of activation are due to favorable entropic contributions by EF-P. The results suggest that EF-P entropically steers or stabilizes Pro-tRNAPro in a productive orientation for peptide bond formation in the ribosome PTC (Doerfel et al. Reference Doerfel, Wohlgemuth, Kubyshkin, Starosta, Wilson, Budisa and Rodnina2015). However, the detailed mechanism remains to be elucidated. Details from structural work on eIF5A, eIF5A–ribosome complexes and EF-P–ribosome complexes have provided further insight into the mechanism of eIF5A and EF-P (Blaha et al. Reference Blaha, Stanley and Steitz2009; Gutierrez et al. Reference Gutierrez, Shin, Woolstenhulme, Kim, Saini, Buskirk and Dever2013; Tong et al. Reference Tong, Park, Hong, Nedyalkova, Tempel and Park2009). Directed hydroxyl radical cleavage data from eIF5A–80S ribosome complexes was used in conjunction with previously determined yeast 60S and eIF5A structures and an EF-P–70S ribosome complex crystal structure to build a model of eIF5A onto the 60S ribosomal subunit (Gutierrez et al. Reference Gutierrez, Shin, Woolstenhulme, Kim, Saini, Buskirk and Dever2013). Similar to EF-P, eIF5A is positioned on the 60S subunit between the P-site tRNAi and E site with the amino and carboxyl domains making contact with the acceptor stem and D loop of tRNAi Met, respectively. A conserved loop in the N-terminal domain of eIF5A interacts with the CCA end of the acceptor stem. Sequence alignments eIF5A from a range of organisms reveal a high degree of sequence similarity in this loop, along with an invariant lysine residue (Lys50 in human and Lys51 in yeast) (Hanawa-Suetsugu et al. Reference Hanawa-Suetsugu, Sekine, Sakai, Hori-Takemoto, Terada, Unzai, Tame, Kuramitsu, Shirouzu and Yokoyama2004). The conserved lysine is post-translationally modified to hypusine (Nε(4 amino-2 hydroxylbutyl-ι-lysine)) in eIF5A. Interestingly, hypusine was first isolated and identified from bovine brain by Shiba et al. (Reference Shiba, Mizote, Kaneko, Nakajima and Kakimoto1971). Over a decade later the single, eukaryotic, cellular protein containing hypusine was identified as eIF5A (Cooper et al. Reference Cooper, Park, Folk, Safer and Braverman1983).
Hypusine is essential for eIF5A mediated peptidyl transfer and association of eIF5A with translation factors and translating ribosomes (Jao & Chen, Reference Jao and Chen2006; Zanelli et al. Reference Zanelli, Maragno, Gregio, Komili, Pandolfi, Mestriner, Lustri and Valentini2006). How hypusine confers eIF5A functionality is not entirely understood. It has been hypothesized that the hypusine moiety acts as a surrogate for the formyl group of prokaryotic fMet-tRNAi fMet, sterically constraining Met-tRNAi Met in an orientation optimal for formation of the first peptide bond (Hershey et al. Reference Hershey, Smit-Mcbride and Schnier1990). Modeling an extended hypusine into the loop places the side chain at the active site of the PTC where it could, in fact, contribute additional contacts that would stabilize the PTC and/or the amino acid in the P site in an orientation optimal for peptide bond formation (Blaha et al. Reference Blaha, Stanley and Steitz2009; Gutierrez et al. Reference Gutierrez, Shin, Woolstenhulme, Kim, Saini, Buskirk and Dever2013). Similarly, eIF5A could stabilize proline for more efficient peptidyl transfer as way to rectify the stalled ribosome.
In addition to its role in protein synthesis, eIF5A has been linked to mRNA turnover, nucleocytoplasmic transport, transcription, cell cycle progression and development, and cancer (Hofmann et al. Reference Hofmann, Reichart, Ewald, Muller, Schmitt, Stauber, Lottspeich, Jockusch, Scheer, Hauber and Dabauvalle2001; Mathews & Hershey, Reference Mathews and Hershey2015; Zuk & Jacobson, Reference Zuk and Jacobson1998). However, whether this functional promiscuity is independent from or mediated through protein synthesis is not yet clear. Identification of mRNA sequences and motifs targeted by eIF5A will be important in elucidating the role of eIF5A. Also there is still very little in known about the mode and mechanism of eIF5A–ribosome interaction. During elongation, peptidyl transfer of the polypeptide chain from P-site to A-site tRNA occurs rapidly and is followed by eEF2-mediated translocation. The timing of eIF5A arrival and the conformational state of the ribosome is unknown. Furthermore, it is unclear if and how eIF5A–eEF2 interactions are involved. Future work addressing this and other aspects of eIF5A will be essential in defining its role as a translation factor.
3.6 Termination and recycling
Eukaryotic translation also ends when a stop codon (UAA, UAG, or UGA) appears in the A site of the ribosome, which is then decoded to release the peptide during termination by RFs. After termination, recycling factor ABCE1, an ATP-binding cassette protein (Rli1p in yeast), binds to the post-termination ribosome complex and promotes 60S subunit dissociation. Recycling of the rest of the ribosome complex (40S:P site tRNA:mRNA) and in some cases reinitiation are mediated by initiation factors (eIF1, eIF1A, eIF3, and eIF3j).
In contrast to the two class I RFs present in bacteria (RF1 and RF2), a single omnipotent eukaryotic class I RF (eRF1) recognizes all three stop codons during translation termination. Structurally distinct from the prokaryotic counterparts (Vestergaard et al. Reference Vestergaard, Van, Andersen, Nyborg, Buckingham and Kjeldgaard2001), eRF1 comprises three domains: N-terminal (N), middle (M), and C-terminal (C) domains. The N domain contains a conserved tetrapeptide NIKS motif that recognizes the stop codon during termination (Song et al. Reference Song, Mugnier, Das, Webb, Evans, Tuite, Hemmings and Barford2000). The tip of the M domain holds the universally conserved GGQ motif that is required to trigger peptidyl-tRNA hydrolysis (Ito et al. Reference Ito, Ebihara, Uno and Nakamura1996). Structural studies on eRF1 illustrated how these two conserved motifs (NIKS and GGQ) can extend to bind to the decoding site and the PTC on the ribosome, respectively, mimicking a tRNA (Song et al. Reference Song, Mugnier, Das, Webb, Evans, Tuite, Hemmings and Barford2000). Termination is also regulated by a GTPase class II RF (eRF3) (Zhouravleva et al. Reference Zhouravleva, Frolova, le Goff, le Guellec, Inge-Vechtomov, Kisselev and Philippe1995), whose GTPase activity requires eRF1 and ribosome binding (Frolova et al. Reference Frolova, le Goff, Zhouravleva, Davydova, Philippe and Kisselev1996). eRF3 forms a stable complex with eRF1 in solution through interaction with the eRF1 C domain (Ito et al. Reference Ito, Ebihara and Nakamura1998). The observed coupling between the GTPase activity of eRF3 and binding to eRF1 and the ribosome during termination drove further biochemical experiments that showed that eRF3 greatly enhances the peptide release efficiency of eRF1 during termination through GTP hydrolysis (Alkalaeva et al. Reference Alkalaeva, Pisarev, Frolova, Kisselev and Pestova2006).
These structural and biochemical studies support a ‘ternary complex’ model (Nakamura et al. Reference Nakamura, Ito and Isaksson1996) where a pre-formed eRF1:eRF3:GTP complex binds to the ribosome during termination to recognize the stop codon and release the peptide. Analogous to the tRNA:eEF1A:GTP ternary complex in elongation, proper stop codon recognition by eRF1 triggers GTP hydrolysis by eRF3 that leads to a conformational change to better position the eRF1 GGQ motif into the PTC for efficient peptide release. eRF3 in its inactive GDP-form then dissociates from the ribosome and the post-termination ribosome is ready to be recycled. Recent Cryo-EM structure of eRF1:eRF3:GMPPNP:ribosome termination complex provided structural insight into the coordination between GTP hydrolysis by eRF3 and subsequent peptide release by eRF1 (Taylor et al. Reference Taylor, Unbehaun, Li, Das, Lei, Liao, Grassucci, Pestova and Frank2012). This multistep termination mechanism is yet to be observed directly in real-time during translation. Novel single-molecule techniques in the future will aid in understanding the kinetics of the different steps of eukaryotic termination through direct tracking.
Initial studies on ribosome recycling showed that recycling can be mediated by a combination of initiation factors, led by eIF3, that promote subunit dissociation (Pisarev et al. Reference Pisarev, Hellen and Pestova2007). Later, it was discovered that the ABCE1 is responsible for recycling in many cases, in combination with eRF1 and eRF3 or the related factors Dom34 and Hbs1 (Pisarev et al. Reference Pisarev, Skabkin, Pisareva, Skabkina, Rakotondrafara, Hentze, Hellen and Pestova2010; Shoemaker & Green, Reference Shoemaker and Green2011). Analogous to EF-G hydrolyzing GTP to trigger prokaryotic ribosome subunit dissociation, ABCE1 hydrolyzes an ATP to dissociate the 60S subunit from the rest of the post-termination complex.
After subunit disassembly, the small 40S subunit remains associated for a time with the mRNA and deacylated P-site tRNA. This complex is further dismantled by initiation factors eIF1, eIF1A, and eIF3. While eIF1 and eIF1A weaken the interaction of the P-site tRNA with recycled 40S subunits, eIF3 together with its loosely-associated subunit eIF3j (Hcr1p in yeast) regulate the stability of 40S:mRNA complex (Kolupaeva et al. Reference Kolupaeva, Unbehaun, Lomakin, Hellen and Pestova2005). The role of eIF3 and eIF3j in re-initiation is beginning to be uncovered (Beznoskova et al. Reference Beznoskova, Cuchalova, Wagner, Shoemaker, Gunisova, von der Haar and Valasek2013). A recent study (Skabkin et al. Reference Skabkin, Skabkina, Hellen and Pestova2013) showed that the mRNA-bound 40S subunits can scan the mRNA bi-directionally, and in the presence of eIF1, eIF1A, eIF2, eIF3, and Met-tRNAi, can re-initiate on ORFs both 5′ and 3′ of the original stop site. This study also suggested that reinitiation may occur with terminated 80S ribosomes prior to subunit dissociation. The mechanistic hypotheses arising out of these data are ideally suited to future studies by single-molecule methods, in particular. Understanding the detailed mechanisms of termination, re-initiation and recycling, in combination with dissecting the mechanism of scanning, will provide substantial new insights into translational control.
3.7 Summary and future perspectives
The established models for the mechanisms of translation and translational control in eukaryotes have proven to be remarkably accurate even though developed without access to experiments that offer high-resolution insights into structure and kinetics. These structural and kinetic perspectives are now beginning to emerge, and along with further biochemical and genetics experiments, demonstrate that the mechanistic landscape of eukaryotic translation is much richer and subtler than previously understood. Some of these subtleties are due to the existence of parallel pathways and the prevalence of kinetic control.
4. Techniques to monitor dynamics and pathways
Single-molecule techniques have a distinctive advantage of direct real-time monitoring of a system. Both single-molecule force and fluorescence methods have helped to elucidate translational dynamics separately. Recent advances in other spectroscopic methods will allow hybrid approaches to study real-time translational dynamics from multiple perspectives.
Super resolution imaging methods have revolutionized microscopy. One future area will use super resolution microscopic imaging to gain real-time information on translational processes in the cell. Super resolution imaging could be used to track directly the positions of a fluorescently labeled ribosome on an mRNA, using methods such as Fluorescence Imaging with One-Nanometer Accuracy (FIONA) allowing sub-nanometer spatial resolution and millisecond range timescale (Toprak et al. Reference Toprak, Kural and Selvin2010; Yildiz et al. Reference Yildiz, Forkey, Mckinney, Ha, Goldman and Selvin2003). FIONA and other methods can be combined with other techniques, such as AFM to resolve different factors within complex (Fronczek et al. Reference Fronczek, Quammen, Wang, Kisker, Superfine, Taylor, Erie and Tessmer2011). However, spatial observance alone provides rather limited information of translational dynamics, and spatial resolution does not contain much dynamical information due to the unpredictable conformation of mRNA in solution. Combined with other force inducing methods such as optical trapping, microfluidics or magnetic trapping, the conformation of mRNA can be manipulated to harness dynamics of ribosome-mRNA complex during translation (Fig. 22).
Schematic of FIONA. (a) Fluorescence signal is captured by CCD camera then 2D intensity profile is fitted to Gaussian distribution. Ability to determine the center of Gaussian distribution improves as more photon is collected
 $\left( { \sim \sqrt N} \right)$
. (b) From collected data, displacement of fluorophore (in this method paper by Selvin et al. kinesin motor protein moving on microtubule track) is tracked with nanometer accuracy (Toprak et al.
Reference Toprak, Kural and Selvin2010).

The combination of fluorescence and optical trapping promises simultaneous monitoring of conformational dynamics with mechanical manipulation and measurement. Incorporating fluorescent probes into an optical trap system is not trivial, since photobleaching of dyes from multiphoton excitation by the trapping lasers is rampant. Several solutions to this problem have been proposed (Lang et al. Reference Lang, Fordyce, Engh, Neuman and Block2004; Comstock et al. Reference Comstock, Ha and Chemla2011). Alternatively, magnetic trapping can be used, in which interference between two methods is minimal (Graves et al. Reference Graves, Duboc, Fan, Stransky, Leroux-Coyau and Strick2015). Ability to track conformation, composition and location on mRNA with appropriate temporal/spatial resolution would be ideal to study dynamics of translation.
Single-molecule methods have fundamental limitations on observable spectra through fluorescence method (up to five different colored fluorophores) and on ability to measure only few parameters at once. Recent improvement in structural methods broadens obtainable information about conformation and composition during translation.
NMR is ideally suited to probe dynamic systems. NMR can provide detailed conformations of proteins and nucleic acids up to 100 KDa using modern labeling approaches and pulse sequences. More importantly, NMR provides a rich density of conformational probes throughout a biomolecule, unlike fluorescence. Solution NMR suffers from size limitations caused by slow tumbling, but TROSY methods have allowed the method to expand the range of systems that can be investigated. Solid-state NMR methods have also matured during the past decade, allowing NMR investigation of systems of unlimited size (Tang et al. Reference Tang, Comellas and Rienstra2013).
NMR probes conformation and dynamics across a range of timescales from nanoseconds to seconds and longer (Ravera et al. Reference Ravera, Salmon, Fragai, Parigi, Al-Hashimi and Luchinat2014; Salmon et al. Reference Salmon, Yang and Al-Hashimi2014). Recent developments using relaxation dispersion methods have allowed probing of conformational equilibria on the μs to millisecond timescales, which are relevant to many processes in translation (Mittermaier & Kay, Reference Mittermaier and Kay2006; Palmer, Reference Palmer2014). In addition, these methods allow probing of excited or lowly populated states in a biological system, sorting through systems of heterogeneous conformation. NMR would be a powerful tool to study an intrinsically heterogeneous and dynamic process such as translation. To date, the size limitations of solution NMR have restricted it to examining smaller components (factor–factor, factor mRNA, and RNA conformation) of translation. A challenge to the field is to integrate NMR and its powerful perspective into our understanding of translation.
X-ray crystallography has long been the best method for detailed, atomic level structures of translational components. In the past decade, there have been hundreds of structures of bacterial and now eukaryotic ribosomes in a variety of functional states, revolutionizing our understanding of ribosomes. (Schmeing & Ramakrishnan, Reference Schmeing and Ramakrishnan2009). Continued improvements in synchrotron radiation, detector beamlines, and automation will continue to further this trend. However, crystallization is challenged by the heterogeneous nature of many of the translation intermediates discussed in this review. Another obvious limitation of X-ray crystallography is the lack of any temporal information, and only very stable states, or states trapped with artificial methods can be crystallized. Recent advances in free-electron laser X-ray sources hold promise in observing biological process in real time with atomic resolution (Chapman et al. Reference Chapman, Fromme, Barty, White, Kirian, Aquila, Hunter, Schulz, Deponte, Weierstall, Doak, Maia, Martin, Schlichting, Lomb, Coppola, Shoeman, Epp, Hartmann, Rolles, Rudenko, Foucar, Kimmel, Weidenspointner, Holl, Liang, Barthelmess, Caleman, Boutet, Bogan, Krzywinski, Bostedt, Bajt, Gumprecht, Rudek, Erk, Schmidt, Homke, Reich, Pietschner, Struder, Hauser, Gorke, Ullrich, Herrmann, Schaller, Schopper, Soltau, Kuhnel, Messerschmidt, Bozek, Hau-Riege, Frank, Hampton, Sierra, Starodub, Williams, Hajdu, Timneanu, Seibert, Andreasson, Rocker, Jonsson, Svenda, Stern, Nass, Andritschke, Schroter, Krasniqi, Bott, Schmidt, Wang, Grotjohann, Holton, Barends, Neutze, Marchesini, Fromme, Schorb, Rupp, Adolph, Gorkhover, Andersson, Hirsemann, Potdevin, Graafsma, Nilsson and Spence2011).
Cryo-electron microscopy (cryo-EM) is an exceptionally important tool to study translation, and is poised to revolutionize the field. This method has several advantages over others to solve structures of translation components: First, the sample can be prepared in various environments, including near-physiological conditions. Second, only small amount of high-quality sample is needed. Third, there is no need to grow crystals. Fourth, although cryo-EM is a static technique, cryo-EM can detect multiple conformations and compositional subcomplexes in an ensemble. These distinct states can be used to reconstruct the dynamics in translational processes (Knoops et al. Reference Knoops, Schoehn and Schaffitzel2012). For example, cryoEM was used to follow tRNA trajectory during elongation by sorting 2 million images into 50 distinct 3D reconstructions (Fischer et al. Reference Fischer, Konevega, Wintermeyer, Rodnina and Stark2010). Then, these 50 reconstructions were ordered to show possible time-evolution of tRNA–ribosome complex during translation. Recent developments in detector technology (direct electron detection) have greatly improved the sensitivity and resolution of cryoEM, allowing near atomic level structures of ribosomal complexes (Bai et al. Reference Bai, Fernandez, Mcmullan and Scheres2013). CryoEM will be an essential tool in delineating mechanisms of translation.
In parallel, cryo-ET enables direct 3D imaging in native cell environment. Any cell of interest can be vitrified and thinned using techniques such as Focused Ion Beam milling. Then, the sample is imaged with cryo-EM in various tilt angles to give 3D image of sample (Lucic et al. Reference Lucic, Rigort and Baumeister2013). Using cryo-ET, translation in native physiological environments can be observed. In recent study, the polysome structure was identified in both reconstructed system of bacterial ribosomes and in intact human cells (Brandt et al. Reference Brandt, Etchells, Ortiz, Elcock, Hartl and Baumeister2009, Reference Brandt, Carlson, Hartl, Baumeister and Grunewald2010). Methods combining distinct imaging modes have been developed, for example using normal or subdiffraction fluorescence imaging to guide cryo-ET target of interest (Sartori et al. Reference Sartori, Gatz, Beck, Rigort, Baumeister and Plitzko2007). These methods will allow us to move mechanistic investigations into the cellular context.
These different structural methods probe distinct aspects of a biological system and can be recombined to provide dynamical snapshots. The limits of these methods and lack of real-time observation will require a combination of structural and single-molecule methods to provide an accurate view of translation.
5. Concluding remarks
The past decades have seen a revolution in our understanding of prokaryotic translation, and we are now starting to glimpse the complexity of the eukaryotic counterpart. As additional atomic-resolution structures from cryo-EM or X-ray crystallography become available; they will provide mechanistic detail, but translation should not be viewed just as a connection of these structural ‘snapshots’. This leads to an underestimation of the conformational and compositional dynamism inherent in translation, and a tendency to view the process as a linear pathway through a series of metastable intermediates. The concepts of kinetic control, pathways, and regulation will be important to understanding translational control. Single-molecule methods are powerful for their ability to parse subpopulations and sort pathways that are free from ensemble averaging. The complexity and heterogeneity of eukaryotic translation make this an attractive target for single-molecule methods. Understanding regulatory mechanisms and translational control will lead to an understanding how misregulation leads to disease and allow design of new therapeutics that target these processes.
Acknowledgements
The authors would like to thank all members of the Puglisi laboratory for helpful discussion, and Peter Sarnow for our long-term collaboration on eukaryotic translation. This work was supported by NIH grants GM51266, GM099687, GM111858, and AI047365. J. Chen is supported by the Stanford Interdisciplinary Graduate Fellowship, and J. Choi is supported by the Stanford Bio-X Graduate Fellowship.