INTRODUCTION
Anthropogenic forest edges can have negative impacts on local ecosystems and it is imperative that the nature and extent of these edge effects are understood for different organisms, habitats and regions (Laurance et al. Reference LAURANCE, LOVEJOY, VASCONCELOS, BRUNA, DIDHAM, STOUFFER, GASCON, BIERREGAARD, LAURANCE and SAMPAIO2002, Murcia Reference MURCIA1995, Saunders et al. Reference SAUNDERS, HOBBS and MARGULES1991). Compared with the forest interior, edges are exposed to increased temperatures, solar radiation, turbulence and decreased humidity (Newmark Reference NEWMARK2001, Pohlman et al. Reference POHLMAN, TURTON and GOOSEM2007, Young & Mitchell Reference YOUNG and MITCHELL1994). This causes the death and replacement of large, old-growth tree species (Laurance et al. Reference LAURANCE, NASCIMENTO, LAURANCE, ANDRADE, RIBEIRO, GIRALDO, LOVEJOY, CONDIT, CHAVE, HARMS and D'ANGELO2006b) by necromass, lianas and light-demanding, successional plant species (Laurance et al. Reference LAURANCE, NASCIMENTO, LAURANCE, ANDRADE, FEARNSIDE, RIBEIRO and CAPRETZ2006a, Nascimento & Laurance Reference NASCIMENTO and LAURANCE2004). Animals often respond to these changes in vegetation structure and resource provisioning (Laurance Reference LAURANCE2004, Moradi et al. Reference MORADI, MOHAMMED, MOHD and EBIL2010, Restrepo & Gomez Reference RESTREPO and GOMEZ1998), if not to their own physiological intolerance of edge microclimate (Karr & Freemark Reference KARR and FREEMARK1983), altering their own distributions relative to the edge.
Many animal taxa have shown edge sensitivity (Didham Reference DIDHAM1995, Laurance et al. Reference LAURANCE, LOVEJOY, VASCONCELOS, BRUNA, DIDHAM, STOUFFER, GASCON, BIERREGAARD, LAURANCE and SAMPAIO2002), and the effects of edges on rain-forest birds have been especially well documented in South America (Banks-Leite et al. Reference BANKS-LEITE, EWERS and METZGER2010, Laurance Reference LAURANCE2004), Africa (Menke et al. Reference MENKE, BOHNING-GAESE and SCHLEUNING2012, Peron & Crochet Reference PERON and CROCHET2009) and South-East Asia (Moradi et al. Reference MORADI, MOHAMMED, MOHD and EBIL2010, Rosli et al. Reference ROSLI, ZAKARIA, MOHD, YUSUF, JAMES and KHAIRULMAZMI2012). Edge habitat repels bird species with specialized, forest-interior niches (Rosli et al. Reference ROSLI, ZAKARIA, MOHD, YUSUF, JAMES and KHAIRULMAZMI2012), especially for certain guilds such as insectivores (Canaday Reference CANADAY1996, Laurance et al. Reference LAURANCE, STOUFFER and LAURANCE2004, Restrepo & Gomez Reference RESTREPO and GOMEZ1998) and understorey birds (Laurance Reference LAURANCE2004, Stouffer & Bierregaard Reference STOUFFER and BIERREGAARD1995a). As a result, edges usually have lower species richness and/or abundance of birds (Laurance Reference LAURANCE2004, Rosli et al. Reference ROSLI, ZAKARIA, MOHD, YUSUF, JAMES and KHAIRULMAZMI2012). However, some guilds such as frugivores and nectarivores are often attracted to forest edges (Restrepo & Gomez Reference RESTREPO and GOMEZ1998, Stouffer & Bierregaard Reference STOUFFER and BIERREGAARD1995b), perhaps responding to increased availability of food (Restrepo Reference RESTREPO1995). Furthermore, as the interface between the forest and the matrix, edges can give access to complementary resources (e.g. aerial insects and nest sites; Ries & Sisk Reference RIES and SISK2004), thus favouring edge specialists (Kahana et al. Reference KAHANA, MALAN and SYLVINA2013, Peron & Crochet Reference PERON and CROCHET2009, Stouffer & Bierregaard Reference STOUFFER and BIERREGAARD1995a).
Despite many studies documenting edge effects in rain-forest birds there has been little research in Australia and those studies that do include forest edge habitat (Hausmann et al. Reference HAUSMANN, CATTERALL and PIPER2005, Johnson & Mighell Reference JOHNSON and MIGHELL1999) have not found evidence of edge effects. This study aims to explicitly test for edge effects in the bird communities of riparian tracts of rain forest in Tropical North Queensland. As the coastal study area is often disturbed by cyclones, the rain-forest interior could contain fewer specialists than other study sites such that the overall community response to edges is less negative than other studies, or even positive. We also address a lack of research into how edge shape mediates edge effects (Nams Reference NAMS2012) by comparing flat and more complex edge shapes. In theory, more convoluted edges could provide a buffer against extreme microclimate variables and subsequent biotic edge effects, however the increased edge surface area might have additive or even synergistic impacts on forest biota (Harper et al. Reference HARPER, MASCARUA-LOPEZ, MACDONALD and DRAPEAU2007, Malcolm Reference MALCOLM1994, Porensky & Young Reference PORENSKY and YOUNG2013). Thus, we hypothesize that (1) bird detection frequency, species richness and community composition will differ between the edge and interior (edge distance) and that this difference will vary by guild, (2) edge shape will modulate avifaunal responses to edge effects, and (3) edge distance and shape will also be associated with differences in habitat structure, providing a possible explanation for the avifaunal edge effects.
METHODS
Study area
The study was conducted in the rain forests of Cape Tribulation, 140 km north of Cairns, Australia (16°06′S, 145°26′E). This rain forest adjoins the World Heritage-listed Daintree National Park, 100000 ha of the most biodiverse habitat in Australia (Williams et al. Reference WILLIAMS, PEARSON and WALSH1996). The rain forest is type 1a/2a complex mesophyll vine forest (Tracey Reference TRACEY1982) with a canopy averaging 18–25 m in height. The annual average rainfall is 3500 mm (Australian Bureau of Meteorology) of which 70% falls in the wet season (December–April). Three tracts of riparian rain forest were separated by two strips of cleared forest (8 ha and 17 ha respectively). The clearings contain 18-mo- to 5-y-old planted rain-forest trees. The rain-forest tract at the north-west corner of the study area had a patchier canopy, however this would not invalidate potentially significant edge effects as interior sites located there would be more ‘edge-like’ in quality, thus, if anything, reducing the effect size.
Sampling sites
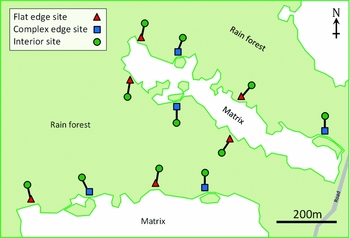
Along three rain-forest/matrix borders, we selected 11 locations which were, on average, 200 m apart (minimum distance 150 m) so as to maximize the independence of bird sampling (Figure 1). At each location, we created two sites for point counts and habitat surveys. An edge site was positioned 5 m into the forest whilst an interior site was placed 50 m into the forest; 50 m is close to, or greater than, the depth of most recorded edge effects (Ewers & Banks-Leite Reference EWERS and BANKS-LEITE2013, Laurance et al. Reference LAURANCE, LOVEJOY, VASCONCELOS, BRUNA, DIDHAM, STOUFFER, GASCON, BIERREGAARD, LAURANCE and SAMPAIO2002, Quintela Reference QUINTELA1985) and it was logistically difficult to place sites deeper into the forest.
Map of the study area displaying the sites where bird point counts were conducted and habitat variables were measured. The study area is located in Cape Tribulation, Tropical North Queensland, Australia. Eleven pairs of sites were distributed along three borders of riparian rain-forest tracts. Each pair comprised an interior site located 50 m into the rain forest (green circles) and an edge site located 5 m into the forest which was either flat (red triangles) or complex (blue squares) in shape. Flat edges were straight, clean cuts to the forest whereas complex edges retained small patches of adjacent forest.

In order to determine how the shape of the forest edge modified edge effects we defined two edge shapes. A flat edge was where the forest has been cleared to leave a relatively straight edge providing a contrasting boundary between matrix and forest. In contrast, a complex edge had a small patch of rain forest (50–100 m2) adjacent to the edge such that the canopy was contiguous. Edge shape could affect the aspect and surface area of the forest edge and thus the exposure to environmental variables which could potentially propagate through the ecosystem. Locations along the same edge had alternating treatments.
Vegetation surveys
We conducted vegetation surveys at each site within a 2.5-m-radius circle, measuring 11 variables in total. We counted the number of trees that fell into six dbh categories (<5, 5–10, 10–20, 20–30, 30–50 and >50 cm). From this, mean tree width (MTW) was estimated by multiplying the frequency of each category by the category's mid-range dbh (2.5 cm, 7.5 cm etc.) and then dividing by the total tree count. We visually estimated canopy height in addition to the percentage cover of three strata of forest cover: canopy (> 18 m), subcanopy (18–4 m) and understorey (4–1 m). On the ground, we estimated the percentage cover of leaf litter, the presence of seedlings, saplings and grass, and we counted dead logs and lianas. To increase accuracy, all variables (excluding MTW) were repeatedly estimated on four separate occasions by two observers independently. Averages of the eight estimates were then generated for analysis.
Bird sampling
Data collection was carried out from 7 May to 27 June 2014. We sampled all sites every day between 06h30 and 12h30 as peak activity occurred around 08h00 and evenings were relatively quiet. In total, we sampled each site for 35 d to maximize the chances of detecting more cryptic or rare species. The sampling order of the three edges was rotated. Along each rain-forest/matrix border, edge locations were visited in a random order and at each location, the two sites were randomly sampled. Each point count consisted of 2 min acclimatization followed by 5 min in which we recorded the presence of any bird species heard or seen within 20 m. A 20-m radius maximized the area sampled whilst preventing direct overlap between edge and interior sites. This left a minimum of 10 m between point count areas. Song Meter 2 was used to record the songs and calls during point counts in order to verify bird identification if necessary.
Data analysis
We defined the detection frequency of each site as the sum of the number of detections of each species over 35 d and the species richness of each site was defined as the total number of species detected. Detection at a given site is assumed to be independent of the probability of detection at other sites. To test for the effect of edge distance (the difference between the edge and interior) and edge shape on total detection frequency and species richness, we constructed general linear mixed models (GLMM) with Poisson errors. Given the paired structure of sites, we included site pairings (11 pairs) as a random effect. For this, and all subsequent GLMMs and LMMs (linear mixed models), the interaction term was removed from the maximal model if not significant and the results of the main effects were reported from the reduced model.
To investigate edge effects within guilds, species were split into groups (Del Hoyo et al. Reference DEL HOYO, ELLIOTT, SARGATAL, CHRISTIE and DE JUANA2015, Pizzey & Knight Reference PIZZEY and KNIGHT2012) according to foraging, rain-forest specialization and diet (Appendix 1). Mixed-flock insectivores were also tested as the only large insectivorous sub-guild. For each guild, we performed a GLMM to test for the effects of edge distance and edge shape on guild member detection frequency and species richness.
To assess changes in community composition, we used a Principal Coordinate Analysis (PCoA), conducted on a Bray–Curtis dissimilarity matrix of species detection frequencies. The site scores of the first and second axes were tested for the effect of edge distance and shape in a LMM with the site pairing as a random effect. To understand how habitat structure might affect the avifaunal community, a Principal Component Analysis (PCA) was conducted on the matrix of habitat variables per site. The site scores of the first and second axes of the PCA were tested for the effect of edge distance and shape in an LMM as above. Analyses were carried out in R (version 3.1.3) using the packages lme4 (Bates et al. Reference BATES, MAECHLER, BOLKER and WALKER2014), VEGAN (Dixon Reference DIXON2003) and APE (Paradis et al. Reference PARADIS, CLAUDE and STRIMMER2004) for mixed models, community analysis and PCoA respectively.
RESULTS
Detection frequency and species richness
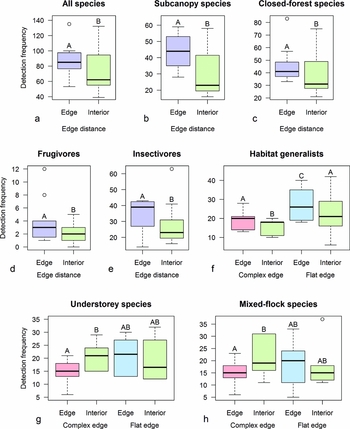
In total, 1946 detections of 48 species were made during >60 h of point counts (Appendix 1). We found a significant effect of edge distance on detection frequency (Z = 2.98, P = 0.003, Figure 2a, Appendix 2) with the detection frequency at the edge (mean number of detections ± SE: 87.1 ± 8.63) being greater than that of the interior (75.6 ± 6.56). However, there was no significant effect of edge shape (Z = 1.13, P = 0.260) or of an interaction of edge shape and distance (Z = 0.56, P = 0.574). For species richness, we found no significant effect of edge distance (Z = 1.27, P = 0.203), edge shape (Z = 0.4, P = 0.687) or their interaction (Z = 0.649, P = 0.517).
Boxplots displaying the effects of edge distance and shape on the detection frequency of birds in riparian rain forest in Cape Tribulation, Queensland. The detection frequency represents the number of bird detections over 35 point counts. A boxplot displaying the effect of edge distance on total bird detection frequency (a). Boxplots displaying the effect of edge distance on the detection frequency of particular guilds: subcanopy species (b), closed-forest species (c), frugivores (d) and insectivores (e). Boxplots displaying both the effect of edge distance and edge shape on the detection frequency of: habitat generalists (f), understorey species (g) and mixed-species flock members (h). Boxplots show the median values, 25th and 75th percentiles and 95% confidence intervals. Capital letters denote significant differences between treatments.

Guild detection frequency and species richness
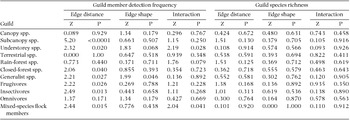
We found a greater detection frequency at the edge, when compared with the interior, of subcanopy species (Z = 5.20, P < 0.0001, Figure 2b), closed-forest species (Z = 2.06, P = 0.040, Figure 2c), frugivores (Z = 2.22, P = 0.026, Figure 2d) and insectivores (Z = 2.49, P = 0.013, Figure 2e, Appendix 3).
Generalists were both more frequently detected at edges compared with interior sites (Z = 2.21, P = 0.027, Figure 2f) and in sites adjacent to flat edges compared with sites adjacent to complex edges (Z = 1.99, P = 0.046). We found a significant effect of edge distance for the detection frequency of understorey species (Z = 2.32, P = 0.020) as well as a significant interaction of edge distance and shape (Z = 2.19, P = 0.028, Figure 2g). Similar results were found for the detection frequency of mixed-species flock members (distance × shape: Z = 2.04, P = 0.041; distance: Z = 2.44, P = 0.015, Figure 2h). In both cases when compared with the interior, edge detection frequency was lower at complex edges but no different at flat edges. Finally, we found for all guilds that neither edge distance nor edge shape affected species richness (Appendix 3).
Bird community composition
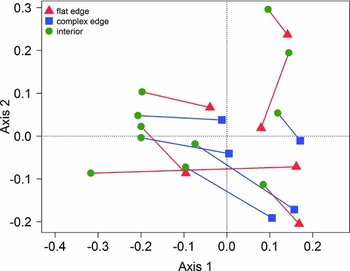
The first two axes of the PCoA explain 21.4% and 15.9% of the variation in species composition (Figure 3). There was a significant effect of edge distance on species composition as measured along axis 1 (t = −3.65, P = 0.0023) and axis 2 (t = 4.28, P = 0.0007), but there was no effect of edge shape or an interaction of shape and distance.
An ordination plot of the first two axes of a PCoA based on a Bray–Curtis dissimilarity matrix of bird species detection frequencies across 11 pairs of rain-forest sites in Cape Tribulation, Queensland; proximity of sites represents Bray–Curtis similarity. Each pair comprises an interior site (green circle) and a corresponding edge site which was either flat (red triangle) or complex (blue square) in shape.

Association with habitat structure
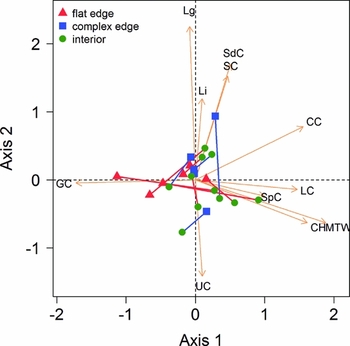
The first two axes of the PCA of habitat variables explained 24.6% and 18.9% of the site variation (Figure 4). Sites with positive axis 1 scores had large trees with a high, extensive canopy and plenty of leaf litter, whilst sites with negative scores had shorter more-open forest with grass growing in the gaps. Sites with positive axis 2 scores have more seedlings, logs and lianas as well and greater subcanopy cover whilst sites with negative scores have greater understorey cover. There was a significant interaction of edge distance and shape on PCA axis 1 (t = 2.96, P = 0.0047) in addition to a significant effect of edge shape (t = −2.25, P = 0.019) but no effect of edge distance (t = −0.376, P = 0.356). Edge distance had a diverging effect on the habitat structure in forest with a flat edge whilst it had little to no effect in forest with a complex edge. Flat edges had lower canopy cover, smaller trees and grass instead of leaf litter whilst interior sites had a taller, more extensive canopy.
An ordination plot of the first two axes of a PCA based on the dissimilarity of 11 habitat variables. These variables were measured at 11 pairs of rain-forest sites in Cape Tribulation, Queensland, where bird point counts were also conducted. Proximity of sites represents the similarity in habitat. Flat-edge sites (red triangles) and complex-edge sites (blue squares) are linked to their corresponding interior sites (green circles). Text at the end of orange lines denotes habitat variables and their distance from the origin shows their relative importance and direction in ordinating the sites. The distance of a site along an orange line gives the relative amount of that variable for that site. CH = canopy height, CC = canopy cover, SC = subcanopy cover, US = understorey cover, LC = leaf litter cover, SdC = seedling cover, SpC = sapling cover, GC = grass cover, Lg = no. of logs, Li = no. of lianas, MTW = mean tree width.

DISCUSSION
In this study, we found that the detection frequency of birds was 15.1% greater at rain-forest edges compared with interiors and that edge effects significantly influenced community composition, but did not affect species richness. The results obtained for species richness are not surprising as this metric is notorious for obscuring community-level patterns (Banks-Leite et al. Reference BANKS-LEITE, EWERS and METZGER2012, Reference BANKS-LEITE, PARDINI, BOSCOLO, CASSANO, PUETTKER, BARROS and BARLOW2014). For example, in this study, Meliphaga honeyeaters were present everywhere, however M. gracilis favoured the interior canopy whilst M. lewinii preferred forest edges. Such subtle trends, by definition, cannot be detected through analyses of species richness. What is more surprising is the finding of generally positive edge effects, given the weight of research which predicts that rain-forest bird communities would be largely repelled from the altered microclimate, habitat structure and resource availability of the edges (Banks-Leite et al. Reference BANKS-LEITE, EWERS and METZGER2010, Canaday & Rivadeneyra Reference CANADAY and RIVADENEYRA2001, Laurance Reference LAURANCE2004, Rosli et al. Reference ROSLI, ZAKARIA, MOHD, YUSUF, JAMES and KHAIRULMAZMI2012).
The first most obvious explanation would be that we could visually detect birds more easily at edges given their open habitat. However, the proportion of visual detections was actually slightly lower (10.2%) at the edge compared with the interior (12%). It also seems unlikely that calls or songs would be more detectable (as opposed to more frequent) at the edge given the relatively short radius of detection. Thus, the differences in detection frequency probably reflect real differences in presence. Another potential methodological problem with our study is that the rain-forest tracts were potentially too narrow to fully realize the depth and magnitude of potential edge effects. It is possible that the interior sites are not ‘true interiors’ as they do not have the same abiotic and biotic conditions as deep interior rain forest, where more edge-averse specialists may remain. However, our results are supported by studies elsewhere in Tropical North Queensland (Johnson & Mighell Reference JOHNSON and MIGHELL1999, Laurance et al. Reference LAURANCE, JONES, WESTCOTT, MCKEOWN, HARRINGTON and HILBERT2013), so it is unlikely that the patterns we found are biased.
Positive edge effects on animals are often explained by a greater concentration of resources at edges (Kahana et al. Reference KAHANA, MALAN and SYLVINA2013, Ries & Sisk Reference RIES and SISK2004). However, the forest structure at edges of Cape Tribulation was typical of a low-quality habitat, with smaller, shorter trees and a more open canopy. Another common explanation for positive edge effects is the presence of complementary resources available in the forest and matrix. Indeed, we observed some forest species (e.g. Meliphaga notata, Zosterops lateralis) foraging in the short, forest regrowth whilst species such as Dicrurus bracteatus could hold territories at the edge which include forest nesting sites and more open foraging areas. This hypothesis is further supported by the fact that many species were detected less frequently at complex edges, where the boundary between forest and matrix was less clear and further apart than at flat edges.
The most likely explanation, however, is that this section of forest has fewer interior specialists than other rain forests, even in the same region. This coast is periodically affected by cyclones (including 2014) which can strip the trees of their leaves. It is difficult to quantify, or even qualify, the effect cyclones have had on birds (Rittenhouse et al. Reference RITTENHOUSE, PIDGEON, ALBRIGHT, CULBERT, CLAYTON, FLATHER, HUANG, MASEK and RADELOFF2010) but regular disturbance could limit the species pool to the most tolerant and generalist species (Devictor et al. Reference DEVICTOR, JULLIARD and JIGUET2008) with high dispersal ability (Şekercioḡlu et al. Reference ŞEKERCIOḠLU, EHRLICH, DAILY, AYGEN, GOEHRING and SANDÍ2002), precluding low-dispersal specialists which may have been lost historically from the narrow, coastal rain forest (Williams & Pearson Reference WILLIAMS and PEARSON1997). Regardless, these results cannot be used to underpin the use of fragmentation to maximize biodiversity. Such a strategy would only support already abundant species at the expense of the few rain-forest specialists, such as the southern cassowary, whose habitat has already diminished (Williams & Pearson Reference WILLIAMS and PEARSON1997).
To conclude, this study found significant differences in the avifaunal detection frequency and community composition between the edge and interior of riparian tracts of rain forest in Tropical North Queensland. Detection frequency was higher at edge sites, with many guilds showing positive edge effects. Although edge shape did not generally affect edge responses, complex edges appeared to reduce or even reverse the edge response of particular guilds. This suggests some complex interactions between bird abundance, habitat structure and distance to edge that should be investigated further. Whilst causation has not been demonstrated, it is likely that the generally positive edge responses reflect the complementarity of resources across the forest edge as well as a more disturbance-tolerant species pool, accustomed to continued cyclonic disturbance. It is important to note the edge aversion of certain guilds and species (particular with regard to the shape of rain-forest edges) when considering the management of Australian rain forest.
ACKNOWLEDGEMENTS
In Queensland, we would like to thank the DRO Site Manager P. Byrnes for his help and hospitality, R. Phillips for allowing the use of ARF land and Y. Ashida for logistical help. Thanks to M. J. Liddell and S. G. W. Laurance for their advice and support. Thanks to JCU for allowing our research in Australia. Thanks to B. Smith and J. McLucas for hospitality during Cyclone Ita. In the UK we would like to thank J. Lloyd for financial support and for introducing us to JCU and the DRO.
APPENDICES
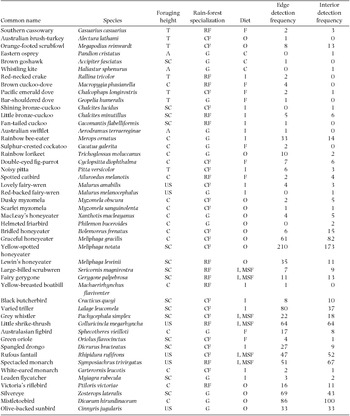
Bird species detected in riparian rain forest in Cape Tribulation, Queensland, after 35 d of point counts (nomenclature after IOC World Bird List v 6.1; Gill & Donsker Reference GILL and DONSKER2015). Each species is attributed to a guild based on foraging height, rain-forest specialization and diet. For foraging height: T = terrestrial, US = understorey, SC = subcanopy, C = canopy and A = aerial. For rain-forest specialization: G = generalist, CF = closed forest and RF = rain forest. For diet: I = insectivore, F = frugivore, C = carnivore, O = omnivore and MSF refers the mixed-species flock sub-guild of insectivores. Also given is the total detection frequency of each species across all edge and interior sites.

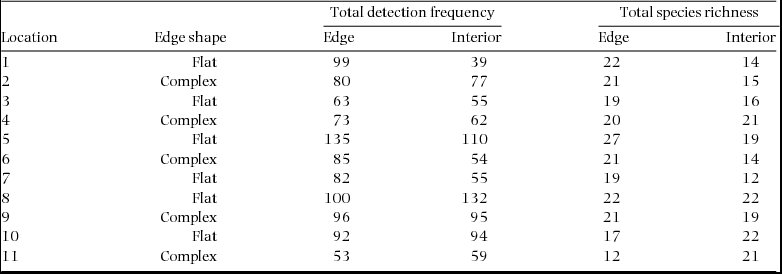
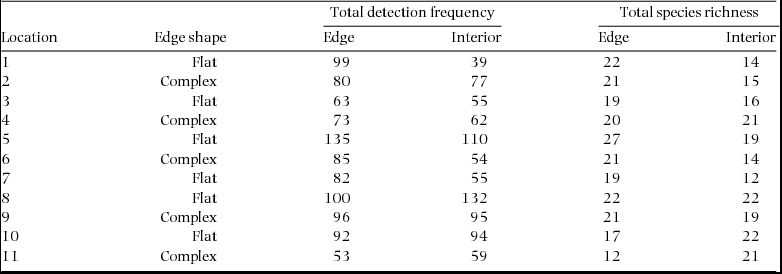
The total detection frequency and species richness of birds at 11 pairs of edge and interior sites distributed along three rain-forest/matrix borders in Cape Tribulation, Queensland. The shape of the edge at each location is also given where flat edges were straight, clean cuts to the forest and where complex edges retained small patches of adjacent forest.
Results from general linear mixed models of the effect of edge distance and shape on the detection frequency and species richness of avian guilds at 11 pairs of rain-forest sites in Cape Tribulation, Queensland. Each species was assigned to a foraging-strata guild (canopy, subcanopy, understorey or terrestrial), a specialism level (rain-forest specialist, closed-forest species or generalist) and a dietary guild (frugivore, insectivore or omnivore). Mixed-species flock members were included as the only large sub-guild of insectivores. The models included the pairing of sites as a random effect and Poisson errors. The Z-value and P-value of each model is given.