Implications
To the best of our knowledge, this is the first study that validated the water intake in sheep and goats by using the isotope dilution technique. The results show that the applied method (isotope dilution technique) allows the estimation of water intake in sheep and goats with high accuracy. This technique has the advantage that water flux can be evaluated individually while animals are kept in herds under extensive free-range conditions. Thus, normal drinking behaviour will not be disturbed by non-representative housing conditions such as stables.
Introduction
Various factors have been shown to influence water intake in domestic small ruminants including climatic conditions (King, Reference King1983; Squires, Reference Squires1993; Sirohi et al., Reference Sirohi, Karim and Misra1997), species or breed (Aganga et al., Reference Aganga, Umunna, Okoh and Oyedipe1989; Squires, Reference Squires1993; Silanikove, Reference Silanikove2000; Ferreira et al., Reference Ferreira, Hoffman, Schoeman and Sheridan2002; Keskin et al., Reference Keskin, Sahin, Bicer, Gül, Kaya, Sari and Duru2005; Salem et al., Reference Salem, Salem, El-Adawy and Robinson2006), physiological state and age (Das et al., Reference Das, Maitra and Bisht1999). In addition, water intake is linearly related to dry matter intake (DMI; MacFarlane and Howard, Reference Macfarlane and Howard1972; Nocek and Braun, Reference Nocek and Braun1985) and thus influenced by feeding regime and food composition (King, Reference King1983; Silanikove, Reference Silanikove1989; Sirohi et al., Reference Sirohi, Karim and Misra1997; Ferreira et al., Reference Ferreira, Hoffman, Schoeman and Sheridan2002; Salem et al., Reference Salem, Salem, El-Adawy and Robinson2006).
An animal’s net requirement for water can be calculated as the sum of the minimal losses in faeces and urine, evaporative losses, the water gained by the body in growth and pregnancy and that lost by secretion in milk (Freer et al., Reference Freer, Dove and Nolan2007). Measurements of water intakes showed that the intakes are generally greater than calculated minimal requirements which might be due to the isotonic urine excretion by animals (Larvor, Reference Larvor1983). Water intake in sheep ranges between 2 and 4.6 l/kg DMI for adult animals when kept under temperate conditions and is reported to increase to 4.2 and 12 l/kg DMI under arid conditions (Lynch et al., Reference Lynch, Brown, May and Donnelly1972; Freer et al., Reference Freer, Dove and Nolan2007).
Species differences in water requirements are of major importance for a sustainable use of limited water resources, for example, in arid and semi-arid areas and represent important criteria for the selection of the most appropriate type of domestic animal kept under these conditions (Devendra, Reference Devendra1990; Silanikove, Reference Silanikove2000). Several studies have confirmed differences between sheep and goats in their water consumption and water conservation capacities. Mutton Merino lambs had a 49% higher water intake per kg mass gain than Boer goats (Ferreira et al., Reference Ferreira, Hoffman, Schoeman and Sheridan2002). Higher water turnover rates were also found in sheep compared with goats kept under tropical conditions in Nigeria (Aganga et al., Reference Aganga, Umunna, Okoh and Oyedipe1989). The lower water turnover rates in goats suggest that goats are better adapted to withstand dehydration than sheep under dry climatic conditions (Silanikove, Reference Silanikove2000). Differences between sheep and goats in drinking frequency were in the same direction as water intake, so measurement of drinking behaviour may be an easy way to measure the water intake (Keskin et al., Reference Keskin, Sahin, Bicer, Gül, Kaya, Sari and Duru2005).
Several methods have been applied to evaluate the water intake. The direct measurement of water consumed is not applicable under most extensive (and nomadic) husbandry conditions in which sheep and goats in arid and semi-arid areas are mainly kept. In this context, the isotope dilution technique (Lifson and McClintock, Reference Lifson and McClintock1966) is a suitable method for estimating individual water flux under free-range conditions and has been applied in the field in many species (Aggrey, Reference Aggrey1982; Aganga et al., Reference Aganga, Umunna, Okoh and Oyedipe1989; Atti et al., Reference Atti, Bocquier, Thériez, Khaldi and Kayouli2000). Isotopes used include the non-toxic stable 2H in deuterium oxide (D2O) and 3H in tritiated water (TOH), which is a weak radioactive β-emitter. Aganga et al. (Reference Aganga, Umunna, Okoh and Oyedipe1989) applied tritiated water to determine water spaces in sheep and goats. However, for free-range studies D2O appears to be a better alternative for environmental reasons and welfare considerations. The accuracy of the D2O dilution technique in estimating total body water (TBW), water turnover rate, body composition and milk intake was confirmed in several studies in sheep (Holleman et al., Reference Holleman, White and Luick1982; Penman and Wright, Reference Penman and Wright1987; Atti et al., Reference Atti, Bocquier, Thériez, Khaldi and Kayouli2000). However, to our knowledge no such studies applying D2O are available for goats.
This study was undertaken to evaluate the D2O dilution technique in sheep and goats. We also tested the hypothesis of a species difference in water intake and measurements of drinking behaviour were included to evaluate the possibility of their usefulness in measuring water intake.
Material and methods
Animals and management
In this study, 16 dry animals (eight German Black Head Mutton ewes and eight Boer goats) were involved. Sheep originated from the Experimental Station Relliehausen of Göttingen University and the goats from a herd owned by the Department of Animal Sciences, University of Göttingen. Animals were transferred to the experimental pens 1 week before the start of the trial for acclimatization and were kept for two consecutive weeks at the Department of Animal Sciences under controlled stable conditions (room temperature: 13.6 ± 0.4°C; relative humidity: 49.1 ± 9.7% (mean ± s.d); light schedule: 10 h dark and 14 h light). Animals were kept in four different rooms in individual straw pens (1.5 × 2.0 m) separated by species. Sheep and goats were on average 2.3 ± 0.5 and 6.0 ± 1.8 years old. Sheep and goats were weighed at the beginning and the end of the experiment and had a body mass of 69.0 ± 8.3 kg and 64.2 ± 3.2 kg, respectively. Hay from ryegrass dominated grassland with an average DM content of 85.7 ± 1.2% and water was available ad libitum. Daily samples of hay were oven dried at 105°C for 24 h to determine the DM content. The moisture content was calculated as [(wet sample weight – dry sample weight)/wet sample weight] × 100.
Water intake studies
Water was individually provided in open buckets (10 l). Water and hay intakes were individually measured on a daily basis by weighing and re-weighing food and water buckets for each animal with an electronic scale to the nearest 1 g (Sartorius model CP34000, Sartorius AG, Göttingen, Germany). To estimate water loss by evaporation from the bucket surface, a control bucket was placed in the stable and re-weighed daily. The re-weighing of the control water bucket showed that water loss via evaporation from the surface was negligible under the present temperate stable conditions.
Water intake was estimated from water kinetics for two consecutive weeks by using the D2O dilution technique. Before the isotope administration a 5 ml blood sample was drawn from the jugular vein into blood tubes containing sodium citrate to determine the background level of D2O. A dose of 0.3 g D2O/kg body mass of 99.90% purity (Euriso-top GmbH, Saarbruecken, Germany) was intramuscularly injected at two body sites. The actual dose given was gravimetrically measured by weighing the syringe before and after the administration of D2O to the nearest 0.001 g (Sartorius model CW3P1-150IG-1, Sartorius AG). Blood samples (∼5 ml) were collected at 6 and 24 h and 2, 4, 7, 9, 11 and 14 days after the application of D2O. The samples were then centrifuged within 30 min of collection at 3500 r.p.m. for 10 min. The plasma fraction was pipetted into glass vials and then frozen at −20°C until the determination of the D2O concentration.
Earlier work showed that tracer concentrations in plasma samples are the same as in vacuum-sublimated water samples (Riek et al., Reference Riek, Gerken and Moors2007). Therefore, plasma samples from sheep and goat were analysed for D2O concentrations. Analyses were carried out at the Competence Centre for Stable Isotopes (KOSI, Göttingen University, Germany). Isotope ratios of 2H were measured using an on-line high temperature reduction technique in a helium carrier gas described previously (Gehre et al., Reference Gehre, Geilmann, Richter, Werner and Brand2004) and expressed relative to the Vienna standard mean ocean water (VSMOW), which is the international reference standard for D2O. Individual samples were measured in triplicate and the averages were calculated.
Calculations
Isotopic equilibrium concentration and fractional water turnover were computed for each animal by extrapolating the regression of the D2O concentrations (C t) on time by the regression equation:

where C 0 is the equilibrium concentration (intercept) for D2O, k is the fractional water turnover (slope) and t is the time elapsed since tracer administration (Holleman et al., Reference Holleman, White and Luick1982). Isotope equilibration and pre-dose baseline concentration were then used to calculate the D2O dilution space (V d) in kilogram by using the equation from Schoeller et al. (Reference Schoeller, Ravussin, Schutz, Acheson, Baertschi and Jequier1986):

where D = dose given in grams, APEdose = atomic enrichment of the dose in percentage (99.90%), MWdose = molecular weight of the dose (D2O = 20.02), C 0 = isotope equilibrium concentration expressed as delta D v. VSMOW, C b = pre-dose baseline concentration and R std=ratio of deuterium to hydrogen in VSMOW, that is, 1.5574 × 10⁻⁴.
The D2O dilution space was divided by 1.04 to calculate the TBW content as compiled data suggest that the dilution spaces for D2O are overestimated by 4% (Schoeller, Reference Schoeller1983). As body mass did not differ significantly between the beginning and the end of the trial, no correction for changing pool size was necessary. The body water fraction, which is TBW content, as a percentage of body mass was calculated as TBW in kilogram divided by body mass in kilogram.
Finally, total water intake (TWI) of the animals was calculated as the product of TBW and k according to Oftedal et al. (Reference Oftedal, Hintz and Schryver1983), that is:

where L = amount of daily water lost, G = amount of daily water stored and k = daily water turnover rate. TWI includes preformed and metabolic water from food and drinking water. Metabolic water was calculated from the feed composition. It was assumed that 1 g metabolized carbohydrates, fat and protein yielded 0.56, 1.07 and 0.42 g water, respectively (Maynard et al., Reference Maynard, Loosli, Hintz and Warner1981). Measured TWI was calculated as

Drinking behaviour
Individual’s drinking behaviour was observed during the two experimental weeks every 2 to 3 days for 24 h by using a time-lapse (eightfold) video-recording system. Infrared lights were used to facilitate data recording during night. For each animal, six to eight observations were available and analysed with the Interact® 7.0 system (Mangold international GmbH, Arnstorf, Bavaria, Germany). Drinking behaviour was defined as follows:
(i) Drinking frequency (number of drinking bouts).
(ii) Drinking duration (time in minutes when the animal was actively engaged in the ingestion and swallowing of water).
Statistical analysis
Statistical analyses were performed with the software package Statistical Analysis Systems version 9.01 (Statistical Analysis Systems Institute (SAS), 2001). The nonlinear regression procedure was used for extrapolating the regression of C t on time by equation (1). For further statistical analyses, averages per animal were used for all traits. Because of the small sample sizes and non-normal distribution of the data, non-parametric procedures were used. The differences between species were tested using the NPAR1WAY procedure in SAS, which performs a non-parametric test across a one-way classification. For a better understanding, means ± s.d. are presented in the tables, but significance given is based on the exact Wilcoxon two-sample test (two sided P-values).
Kendall’s τ-b rank correlations were estimated between water drunk, measured and estimated TWI and drinking behaviour across species, based on averages per animal.
We are aware of the difficulties of a two species approach and therefore followed suggestions to minimize these shortcomings outlined in detail in Garland and Adolph (Reference Garland and Adolph1994).
Results
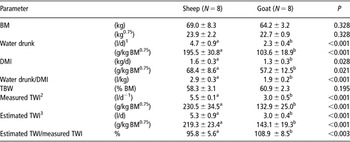
Significant species differences were found for nearly all traits measured, with the exception of body mass and TBW (Table 1). Daily water drunk (Table 1) as measured by re-weighing water buckets, differed significantly between the two species with higher amounts for sheep than for goats. These species differences were also maintained when relating water intake to metabolic body mass (water intake per kg body mass0.75). DMI differed significantly between the two species with higher intakes in sheep than in goats. The species difference was maintained when expressed as amount of DMI per kg body mass0.75, similar to water drunk. When calculating water intake per kg DMI, German Blackhead Mutton sheep had a higher intake than Boer goats.
BM, WD, DMI, TBW and TWI in Black Head Mutton sheep and Boer goats kept under stable conditions

BM = body mass; WD = water drunk; DMI = dry matter intake; TBW = total body water; TWI = total water intake.
Numbers represent averages per animal (mean ± s.d.).
1Measured by reweighing water buckets.
2TWI=metabolic water + water drunk + preformed water from moisture content of the hay.
3Estimated by D2O dilution.
a,bvalues within the same row with different superscripts differ significantly; P-values: exact Wilcoxon two-Sample test, two-sided.
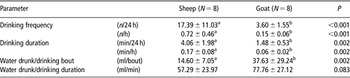
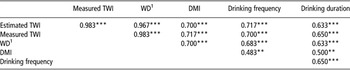
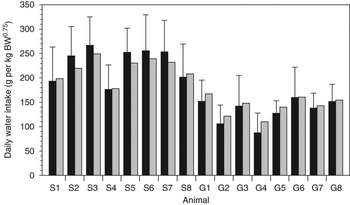
The body water fraction ranged between 54% to 63% for sheep and 58% to 64% for goats, with no significant differences between species. Sheep had significantly higher TWIs than goats, whether measured or estimated. The ratios between estimated TWI (D2O dilution) and measured TWI (re-weighing water buckets) for both sheep and goats indicate that the D2O method predicts water intake in both species with high accuracy (Table 1) with only small variations (−4.2% to 8.9%). The behavioural observations showed that the drinking frequency was about five times higher in sheep than in goats, with goats ingesting less than half the amount per bout (Table 2). The ratio between water drunk and drinking duration illustrates this species difference in drinking intensity. However, the correlations between drinking behaviour and measured or estimated water intakes were found to be only of moderate magnitude (0.48 to 0.72; Table 3). In contrast, TWI estimated by D2O provided a very good predictor for the measured amount of water drunk (τ = 0.967). Pairwise individual ratios of TWI (measured v. estimated) are shown in Figure 1 and suggest a higher variability in sheep than in goats. The differences between both methods were not significant (P = 0.574 for sheep and P = 0.382 for goats, respectively; exact Wilcoxon two-sample test, two-sided).
Daily drinking behaviour (frequency and duration) and water intake in Black Head Mutton sheep and Boer goats kept under stable conditions, based on 24-h video recordings

Numbers represent averages per animal (mean ± s.d.).
In all, 64 video recordings in sheep (eight per animal), 53 recordings in goats (6.6 per animal).
a,bValues within the same row with different superscripts differ significantly; P-values: exact Wilcoxon two-sample test, two-sided.
Kendall’s τ-b correlations between measured and estimated TWI by using D2O, WD (g/kg BM0.75), DMI (g/kg BM0.75) and drinking behaviour across species, based on averages per animal

TWI = total water intake; BM = body mass; WD = water drunk; DMI = dry matter intake.
1Measured by re-weighing water buckets.
***P < 0.001; **P < 0.01.
Comparison between measured (by re-weighing water buckets, black columns) and estimated daily water intake (by D2O dilution, grey columns) in individual sheep (S) and goats (G). Values for measured intakes are means ± s.d. of daily measurements for 2 weeks and values for estimated intakes are individually calculated over a 2-week period (see text for details).

Discussion
To our knowledge, this study is the first to show that the deuterium oxide dilution technique is a means of accurately measuring water intake in sheep and goats. The study also confirmed previous findings (Aganga et al., Reference Aganga, Umunna, Okoh and Oyedipe1989; Ferreira et al., Reference Ferreira, Hoffman, Schoeman and Sheridan2002) of higher water intakes in sheep compared with goats and also showed that measurement of drinking time and frequency are only of moderate usefulness in measuring water intake.
The very close relation between measured and estimated TWI (τ = 0.983) confirms that the isotope dilution technique gives reliable results for water intake in sheep and goats. The variations of −4.2% to 8.9% found between measured and estimated water intake in both species are in the range of previous results for other species including birds (Nagy and Costa, Reference Nagy and Costa1980; Degen et al., Reference Degen, Pinshow, Alkon and Arnon1981). Variations in water intake could be explained by the loss of deuterium through feaces and urine and by evaporation during the equilibration period, which lasts approximately 6 h in sheep and goats (Holleman et al., Reference Holleman, White and Luick1982; Oftedal et al., Reference Oftedal, Hintz and Schryver1983). However, these losses are normally negligible compared with the amount injected.
In the present study, the body water fraction estimated by D2O ranged between 54% to 63% and 58% to 64% in sheep and goats, respectively. These results are similar to values estimated by the dilution of TOH in indigenous breeds of sheep (Uda, Yankasa) and goats (Sahel, Maradi) ranging between 73.6% to 80.5% and 66.1% to 77.8%, respectively (Aganga et al., Reference Aganga, Umunna, Okoh and Oyedipe1989). Ranjhan et al. (Reference Ranjhan, Kalanidhi, Gosh, Singh and Saxena1982) reported TOH spaces of 71.9% to 77.4% of crossbred sheep in India, while Panaretto (Reference Panaretto1963) found TOH spaces between 36.8% to 74.2% and 55.6% to 75.7% for sheep and goats, respectively. Several studies have shown that the estimates of TBW determined by TOH or D2O dilution in sheep and goats are in close agreement with those derived from post-mortem desiccation methods (Panaretto, Reference Panaretto1963; Panaretto and Till, Reference Panaretto and Till1963; Atti et al., Reference Atti, Bocquier, Thériez, Khaldi and Kayouli2000).
The species differences found in this study are in agreement with earlier reports. Higher DMI in sheep compared with goats have also been found by Aregheore (Reference Aregheore1996) and Van et al. (Reference Van, Mui and Ledin2007) who explained this observation by higher nutrient requirements and genetic potential for growth in sheep. Ferreira et al. (Reference Ferreira, Hoffman, Schoeman and Sheridan2002) showed that goats need less water to synthesize 1 kg of weight gain than sheep.
The water turnover rates in this study were higher in sheep than in goats. Similar results were also found for native sheep (Uda, Yankasa) and goats (Sahel, Maradi) in Nigiria under natural climatic conditions with 2.52, 2.63, 0.86 and 1.09 l/day per animal, respectively (Aganga et al., Reference Aganga, Umunna, Okoh and Oyedipe1989). Our findings also agree closely with the results of Aggrey (Reference Aggrey1982) in West African dwarf sheep and goats kept in Ghana during the dry season with 2.06 and 1.28 l/day for sheep and goats, respectively.
Silanikove (Reference Silanikove2000) analysed the physiological basis of the superior water management in goats emphasizing the role of the rumen as water reservoir that can be utilized during dehydration and rapid rehydration. Adaptation strategies of goats to withstand dehydration include their small body size, low metabolic requirements, efficient utilization of high fibre forage, the ability to minimize water losses via urine and feaces and to reduce nitrogen requirements via urea recycling and nitrogen conservation (Casey and Van Niekerk, Reference Casey and Van Niekerk1988; Silanikove, Reference Silanikove2000). Merino sheep have been selected for their productive performance on high-quality pastures and therefore probably need a higher water turnover for the excretion of nitrogen in the urine (Ferreira et al., Reference Ferreira, Hoffman, Schoeman and Sheridan2002), as has been shown in the Blesbok and Impala (Fairall and Klein, Reference Fairall and Klein1984). In this context, it is of interest to note that this suggested superiority of goats for desert conditions was also found in this study where animals were kept under temperate climatic conditions.
The correlation between measured and estimated TWI and drinking behaviour was found to be of only moderate magnitude. This moderate relation might be explained by the fact that observations of drinking behaviour do not account for other sources of water intake such as water from ingested feed. This observation is similar to previous results on suckling behaviour which suggest that the time spent suckling is not a useful predictor to measure milk transfer in mammals (Higgins et al., Reference Higgins, Costa, Huntley and Le Boeuf1988; Cameron, Reference Cameron1998). Comparable to suckling, intensity of water ingestion (water swallowed per minute) might be variable between individuals and influenced by, for example, drinking motivation that cannot be adequately evaluated by observation. Furthermore, in a previous study, the direct observation of drinking behaviour in sheep showed that drinking bouts are very short, lasting approximately ⩽1 min (Das et al., Reference Das, Maitra and Bisht1999). The use of time-lapse video recording (eightfold), as in this study, might not be suitable to identify such short drinking bouts with high accuracy.
In this study, German Blackhead Mutton sheep spent approximately 0.3% of time per day for drinking, while Boer goats spent only 0.1%. Similar low values for diurnal water ingestion were also reported for stall-fed sheep, which invested <1% (0.12 ± 0.02) of their activity during 24-h drinking (Das et al., Reference Das, Maitra and Bisht1999). The species differences in drinking behaviour could result from a higher metabolic rate in sheep, higher DMI, differences in activity level and thermoregulative capacities. These results indicate that ethological observations are a good predictor to compare drinking behaviour in sheep and goats, but appear to be less suitable to predict the amount of water ingested in both species.
The D2O dilution technique estimated water intake in sheep and goats under stall-feeding conditions with high accuracy. The present results suggest that the isotope dilution method offers a viable technique to measure individual water consumption. This technique has the advantage that water flux can be evaluated individually while animals are kept in herds under extensive free-range conditions. Thus, normal drinking behaviour will not be disturbed by non-representative housing conditions such as stables. Behavioural studies of water intake by direct observations require much less technical equipment than isotope analyses and could be easily applied under difficult field conditions. However, the moderate correlations between drinking behaviour traits and the amount of water drunk show their limited suitability for measurement of water intake.
The lower water intake in Boer goats, compared with Black Head Mutton sheep, when kept under temperate conditions confirms the superior water management capacity in goats found by other authors in particular for tropical conditions. For a better understanding of the underlying adaptive mechanisms, a parallel study of several breeds (genotypes) per species bred for different purposes and kept under different climatic conditions would be suitable.
Acknowledgements
The authors thank Dr E. Moors for assistance in D2O injections and J. Langel for stable isotope analyses. The technical assistance of A. Oppermann and K. Salzmann of the Experimental Station Relliehausen and J. Dörl and the technical staff of the Department of Animal Science of the University of Goettingen is highly appreciated. This research was supported by a scholarship from the German Academic Exchange Service (DAAD) to DA.