



1. Introduction
Research in drag reduction has traditionally been stimulated by energy costs and the environmental impact of energy use. One of the questions to be addressed is the overall system efficiency, i.e. whether the energy savings associated with drag reduction surpass the energy expenditures implied by the flow control process. Alternatively, one can look at drag reduction as a part of the overall propulsion system where one can expend energy on reducing drag rather than increasing the propulsive force so that the existing propulsive system can deliver an improved performance. If the maximum possible propulsive force has been achieved, the only way to improve the system performance is to expend energy on drag reduction. It is worth noting the recent emergence of a new direction of such research with the reduction of the energy cost associated with stirring being the main objective (Gepner & Floryan Reference Gepner and Floryan2020).
Drag is created primarily by two effects: the interaction of the pressure field with the geometry of a moving object and the friction between the fluid and the surface of this object (Mohammadi & Floryan Reference Fukagata, Sugiyama and Kasagi2012). While the physical processes are well understood, an enormous effort has been expended in developing strategies which could mitigate drag. This work is focused on the use of surface transpiration to change the character of the interaction between the stream and its bounding surface with the goal of reducing frictional drag.
Wall friction is proportional to the fluid viscosity and the wall-normal velocity gradient in the case of Newtonian fluids. Assuming that the fluid properties cannot be altered, shear can be reduced only by changing the velocity field near the wall. The recognition that laminar shear is always smaller than turbulent shear led to a sustained interest in the development of laminar–turbulent transition control strategies explored primarily in the context of the development of laminar flow aerofoils (Arnal, Perraud & Séraudie Reference Aljallis, Sarshar, Datla, Sikka, Jones and Choi2008). These techniques can be viewed as indirect methods of drag reduction. Direct methods involve externally imposed modifications of flows in the immediate vicinity of the bounding wall using either passive or active means. Altering surface topography (Perot & Rothstein Reference Hossain and Floryan2004) represents the former approach while the use of surface transpiration (Bewley & Alamo Reference Bewley and Alamo2004; Min et al. Reference Floryan and Zandi2006; Bewley Reference Bewley2009; Hœpffner & Fukagata Reference Hœpffner and Fukagata2009; Mamori, Iwamoto & Marata Reference Floryan, Yamamoto and Murase2014), plasma- (Inasawa, Ninomiya & Asai Reference Inasawa, Ninomiya and Asai2013), sound- (Kato, Fukunishi & Kobayashi Reference Floryan1997) and piezo-driven actuators (Fukunishi & Ebina Reference Chen, Floryan, Chew and Khoo2001) as well as surface vibrations (Floryan & Zandi Reference Canuto, Hussaini, Quarteroni and Zang2019) represent the latter techniques.
Passive methods rely on the creation of a proper surface topography. If the smooth surface is viewed as the reference case, all its alterations increase the wetted area and, thus, the reduction of the wall shear must be large enough to overcome the increase of this area. It is known that short wavelength longitudinal grooves (riblets) can reduce drag by forcing the stream to lift above the grooves (Walsh Reference Marusic, Joseph and Nahesh1980, Reference WalshReference Waltz, Morales, Nocedal and OrbanReference Woodcock, Sader and MarusicReference Yadav, Gepner and SzumbarskiReference Walsh1983). It is also known that long wavelength longitudinal grooves can lead to drag reduction through changes in the distribution of the bulk flow (Szumbarski, Blonski & Kowalewski Reference Lieu, Moarref and Jovanovič2011, Moradi & Floryan Reference Gomez, Blackburn, Rudman, Sharma and McKeon2013; Mohammadi & Floryan Reference Mohammadi and Floryan2013aReference Mohammadi and FloryanReference Mohammadi and FloryanReference Moradi and FloryanReference Ou, Perot and RothsteinReference Park, Park and Kim, Reference Mohammadi and Floryan2014, Reference Gepner and Floryan2015; Mohammadi, Moradi & Floryan Reference Mohammadi, Moradi and Floryan2015, Chen et al. Reference Bewley and Alamo2016; DeGroot, Wang & Floryan Reference DeGroot, Wang and Floryan2016; Raayai-Ardakani & McKinley Reference Hossain and Floryan2017; Yadav, Gepner & Szumbarski Reference Yadav, Gepner and Szumbarski2017, Reference Mohammadi and Floryan2018). Such grooves can be optimized (Mohammadi & Floryan Reference Fukunishi and Ebina2013b) with their most effective forms changing with the imposed constraints. Grooves are effective in the laminar case if the flow remains stable, but the required stability estimates are available for long wavelength grooves only (Szumbarski Reference Szumbarski2007; Moradi & Floryan Reference Moradi and Floryan2014; Mohammadi et al. Reference Mohammadi, Moradi and Floryan2015; Yadav et al. Reference Yadav, Gepner and Szumbarski2017, Reference Mohammadi and Floryan2018).
Use of the so-called super-hydrophobic effect (Rothstein Reference Rothstein2010) offers an attractive version of topography re-arrangement. The essence of this effect is the ability of the surface topography to trap gas bubbles in micro-pores which partially replace direct contact between the liquid and the solid by contact between the liquid and the gas, reducing the shear stress acting on the liquid (Ou, Perot & Rothstein Reference Hœpffner and Fukagata2004; Ou & Rothstein Reference Ou and Rothstein2005; Park, Park & Kim Reference Hossain and Floryan2013; Srinivasan et al. Reference Srinivasan, Choi, Park, Chatre, Cohen and Mckinley2013; Park, Sun & Kim Reference Park, Sun and Kim2014). This effect is limited to two-phase systems and is counteracted by the simultaneous creation of pressure drag by surface irregularities. The stability characteristics of flows over superhydrophobic surfaces are yet to be established, including conditions which guarantee the existence of laminar flows. Other system limitations are associated with the integrity of the gas-liquid interface, which depends on surface tension and shear-driven interfacial instabilities, and on the hydrostatic pressure which can lead to the collapse of gas bubbles, leaving the liquid directly exposed to a rough surface (Poetes et al. Reference Perot and RothsteinReference Poetes, Holtzmann, Franze and Steiner2010; Bocquet & Lauga Reference Arnal, Perraud and Séraudie2011; Samaha, Tafreshi & Gad-el-Hak Reference Kato, Fukunishi and Kobayashi2011; Aljallis et al. Reference Aljallis, Sarshar, Datla, Sikka, Jones and Choi2013). Bubble collapse can be avoided by working with two liquids, leading to the concept of liquid infused surfaces (Wong et al. Reference Wong, Kang, Tang, Smythe, Hatton, Grinthal and Aizenberg2011). The infusing liquid has much higher viscosity than a gas, but drag reduction is nevertheless possible (Solomon, Khalil & Varanasi Reference Samaha, Tafreshi and Gad-el-HakReference Solomon, Khalil and VaranasiReference Sumitani and KasagiReference Szumbarski, Blonski and KowalewskiReference Tilton and CortelezziReference Solomon, Khalil and Varanasi2014, Reference Koganezawa, Mitsuishi, Shimura, Iwamoto, Mamori and Murata2016; Rosenberg et al. Reference Inasawa, Ninomiya and Asai2016). Substantial drag reduction has been reported recently (Van Buren & Smits Reference Van Buren and Smits2017). This technique is subject to limitations associated with variations of pressure along the surface, which causes migration of the infusing liquid.
A separate class of methods relies on spatial heating patterns which create convection rolls. The roll rotation is driven by horizontal density gradients providing a propulsive force. The rolls prevent direct contact between the stream and the bounding walls, reducing friction opposing fluid movement. The net result cannot be predicted a priori as the stream needs to meander between convection rolls, potentially increasing friction. The strength of this effect is increased by combining spatially distributed and uniform heating (Floryan & Floryan Reference Byrd, Hribar and Nocedal2015), and by heating both walls with the proper phase difference between the upper and lower heating patterns (Hossain & Floryan Reference DeGroot, Wang and Floryan2016). The effect is resilient as it can be generated by heating applied either at the lower or upper wall (Hossain & Floryan Reference Coleman and Li2014). The flow must remain laminar for the method to work and the relevant stability characteristics are available (Hossain & Floryan Reference Hossain and Floryan2015). The method remains effective for small Reynolds numbers (Hossain, Floryan & Floryan Reference Floryan2012) as stronger flows eliminate the convection bubbles. Recent results (Hossain & Floryan Reference Hossain and Floryan2020) demonstrate that proper combination of the heating and groove patterns can significantly amplify the drag reducing effect through activation of the thermal streaming mechanism (Abtahi & Floryan Reference Abtahi and Floryan2017).
Studies of stationary transpiration were initiated by Floryan, Yamamoto & Murase (Reference Floryan, Yamamoto and Murase1992), who carried out direct numerical simulations of the laminar–turbulent transition process in channel flows modulated by transpiration, including the turbulent regime. They demonstrated the existence of a bypass transition induced by transpiration. The theoretical framework for analysis was provided by Floryan (Reference Byrd, Gilbert and Nocedal1997), who demonstrated formation of instabilities leading to the generation of streamwise vortices as well as reduction of the critical Reynolds number for the Tollmien–Schlichting waves. The vortex instabilities have also been found in Couette flow (Floryan Reference Floryan2003). These studies assumed pores of infinitesimal size uniformly and densely distributed along a wall. Such models imply that the pressure required to implement transpiration must be increasing without bounds as the pore size goes to zero, and that there is a pore at any point along the wall; its limitations are well summarized by Tilton & Cortelezzi (Reference Mamori, Iwamoto and Marata2008). Bewley & Alamo (Reference Bewley and Alamo2004) and Bewley (Reference Bewley2009) concluded that the energy cost of transpiration is always higher than energy savings associated with reduction of pressure losses. Min et al. (Reference Floryan and Zandi2006), Marusic, Joseph & Nahesh (Reference Marusic, Joseph and Nahesh2007) and Woodcock, Sader & Marusic (Reference Moarref and Jovanovič2012) demonstrated that a reduction of the pressure gradient can be achieved using suction/blowing waves but that the energy cost of the creation of such waves is higher than the energy savings associated with smaller pressure gradients (Bewley Reference Bewley2009; Fukagata, Sugiyama & Kasagi Reference Fukagata, Sugiyama and Kasagi2009). Transpiration can also increase losses through destabilization of the laminar flow (Lee, Min & Kim Reference Floryan and Floryan2008; Lieu, Moarref & Jovanovič Reference Lieu, Moarref and Jovanovič2010; Moarref & Jovanovič Reference Moarref and Jovanovič2010). Similar waves can lead to relaminarization of turbulent flows (Mamori et al. Reference Floryan, Yamamoto and Murase2014) which provides a different mechanism for reduction of pressure losses. Transpiration has been used in the control of turbulent flows (Sumitani & Kasagi Reference Lee, Min and Kim1995; Quadrio, Floryan & Luchini Reference Hossain and Floryan2005, Reference Quadrio, Floryan and LuchiniReference Raayai-Ardakani and McKinleyReference Roberts and FloryanReference Rosenberg, Van Buren, Fu and SmitsReference Quadrio, Floryan and Luchini2007; Gomez et al. Reference Coleman and Li2016; Koganezawa et al. Reference Koganezawa, Mitsuishi, Shimura, Iwamoto, Mamori and Murata2019), where it was concluded that the drag reducing effect is associated with the injection of the turbulence-free fluid. The effects of transpiration on boundary layer instabilities were investigated by Roberts et al (Reference Roberts, Floryan, Casalis and Arnal2001) and Roberts & Floryan (Reference Roberts and Floryan2002, Reference Hossain, Floryan and Floryan2008). Szumbarski & Floryan (Reference Szumbarski and Floryan2000) analysed small amplitude transpirations and explained how they interact with the Tollmien–Schlichting waves.
The main objective of this study is to carry out a detailed analysis of the changes in pressure-gradient-driven laminar channel flow subject to different patterns of spatial modulations created by transpiration, with the goal of identifying conditions leading to a reduction of pressure losses. Section 2 presents the formulation of the model problem. Section 3 discusses the solution method. Section 4 is focused on one-wall unimodal transpiration; § 4.1 discusses flow topologies and reduction of pressure losses; § 4.2 describes nonlinear streaming generated by such transpiration and self-pumping; § 4.3 describes flow properties with a special focus on transpiration distributions which lead to the reduction of pressure losses; § 4.4 is focused on flow energetics. Section 5 considers unimodal transpiration applied at both walls with a focus on pattern interaction effects and their consequences for the energy costs. Section 6 discusses multimodal transpiration and commensurability effects. Section 7 is focused on transpiration using finite-size slots. Section 8 provides a short summary of the main conclusions.
2. Problem formulation
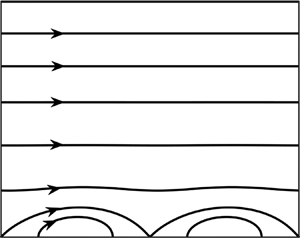
We begin by explaining our model problem. Consider the steady flow of a fluid confined in a channel bounded by two parallel walls extending to  ${\pm} \infty $ in the x-direction and placed a distance 2 h apart as shown in figure 1. The flow is driven in the positive x-direction by a pressure gradient. The fluid is incompressible and Newtonian with constant and uniform dynamic viscosity
 $\mu $, density ρ and kinematic viscosity
 $\nu = \mu /\rho $. The velocity and pressure fields and the flow rate have the form
 \begin{align}{\boldsymbol{v}_0}(x,y) = [{u_0}(y),0] = [1 - {y^2},0],\quad \; {p_0}(x,y) ={-} \frac{{2x}}{{Re}} + \textrm{const}\textrm{.},\quad {Q_0} = 4/3,\end{align}
where  ${\boldsymbol{v}_0} = [{u_0},{v_0}]$ denotes the velocity vector scaled by the maximum of the x-velocity
 ${U_{max}},{p_0}$ stands for the pressure scaled by
 $\; \rho U_{max}^2$,
 ${Q_0}$ is the flow rate and
 $\; Re = {U_{max}}h/\nu $ stands for the Reynolds number.
Sketch of the flow configuration. Left side: continuous transpiration; right side: slotted transpiration.

Let us introduce spatially distributed transpiration at the walls and represent the resulting flow as a superposition of the original flow and the transpiration-driven modifications. The complete flow quantities have the form
 \begin{gather}\left.
\begin{gathered} {{u_T}(x,y) = Re\; {u_0}(y) +
{u_1}(x,y)\quad {v_T}(x,y) = {v_1}(x,y),}\\ {{p_T}(x,y) =
R{e^2}{p_0}(x) + {p_1}(x,y),\quad {Q_T} = Re\; {Q_0} +
{Q_1},} \end{gathered}
\right\}\end{gather}
where  $[{u_T},{v_T}]$,
 ${p_T}$,
 ${Q_T}$ stand for the complete velocity vector, pressure and flow rate, respectively, and
 $[{u_1},{v_1}]$, p 1 and
 ${Q_1}$ denote velocity, pressure and flow rate modifications, respectively. The complete flow quantities and the modifications have been scaled by the convective velocity scale
 ${U_v} = \nu /h$, where
 ${U_{max}}/{U_v} = Re$, and the complete pressure field and the pressure modifications have been scaled using
 $\rho U_v^2$ as the pressure scale.
Transpirations can have arbitrary patterns but cannot carry any net mass flux. We shall represent them using Fourier expansions of the form
 \begin{gather}{u_1}(x, - 1) = 0,\quad {v_1}(x, - 1) = R{e_L}\mathop \sum \limits_{n ={-} {N_L},n \ne 0}^{n ={+} {N_L}} f_L^{(n)}\,{\textrm{e}^{\textrm{i}\,n\alpha x}},\end{gather}
 \begin{gather}{u_1}(x,
+ 1) = 0,\quad {v_1}(x, + 1) = R{e_U}\mathop \sum
\limits_{n ={-} {N_U},n \ne 0}^{n ={+} {N_U}}
f_U^{(n)}\,{\textrm{e}^{\textrm{i}\,n\alpha
x}},\end{gather}
where  $\alpha $ is the transpiration wave number and
 $\lambda = 2{\rm \pi} /\alpha $ is its wavelength,
 $R{e_L} = {V_L}h/\nu $ and
 $R{e_U} = {V_U}h/\nu $ are the lower and upper transpiration Reynolds numbers, respectively,
 ${V_L}$ and
 ${V_U}$ are the differences between the maximum and minimum of
 ${v_1}$ at the lower and upper walls, respectively,
 $f_L^{(n)}$ and
 $f_U^{(n)}$ have been scaled by
 ${V_L}$ and
 ${V_U}$ so that
 \begin{gather}-
\tfrac{1}{2} \le \mathop \sum \limits_{n ={-} {N_G}}^{n =
{N_G}} f_L^{(n)}\,{\textrm{e}^{\textrm{i}\,n\alpha x}} \le
\tfrac{1}{2},\quad - \tfrac{1}{2} \le \mathop \sum \limits_{n
={-} {N_G}}^{n = {N_G}}
f_U^{(n)}\,{\textrm{e}^{\textrm{i}\,n\alpha x}} \le
\tfrac{1}{2},\end{gather}
the reality conditions require that  $f_L^{(n)} = f_L^{{{( - n)}^\ast }}$,
 $f_U^{(n)} = f_U^{{{( - n)}^\ast }}$ where stars denote complex conjugates, and
 ${N_L}$ and
 ${N_U}$ denote the numbers of Fourier modes required to describe transpiration distributions at the lower and upper walls, respectively.
The field equations for the flow modifications are of the form
 \begin{gather}\frac{{\partial {u_1}}}{{\partial x}} + \frac{{\partial {v_1}}}{{\partial y}} = 0,\end{gather}
 \begin{gather}(Re\; {u_0} + {u_1})\frac{{\partial {u_1}}}{{\partial x}} + Re\; {v_1}\frac{{\textrm{d}{u_0}}}{{\textrm{d}y}} + {v_1}\frac{{\partial {u_1}}}{{\partial y}} ={-} \frac{{\partial {p_1}}}{{\partial x}} + {\nabla ^2}{u_1},\end{gather}
 \begin{gather}(Re\; {u_0} + {u_1})\frac{{\partial {v_1}}}{{\partial x}} + {v_1}\frac{{\partial {v_1}}}{{\partial y}} ={-} \frac{{\partial {p_1}}}{{\partial y}} + {\nabla ^2}{v_1},\end{gather}
where  ${\nabla ^2}$ denotes the Laplace operator. The transpiration is expected to affect pressure losses, and the question of their determination is posed as the question of finding the additional pressure gradient which is required to maintain the same flow rate in channels with and without transpiration. This requirement is imposed in the form of the flow rate constraint, i.e.
 \begin{gather}{Q_T} =
{Q_0} = \int_{ - 1}^1 {{u_T}\,\textrm{d}y} = \int_{ - 1}^1
{(Re\; {u_0} + {u_1})\,\textrm{d}y} = \tfrac{4}{3}Re +
{Q_1},\end{gather}
where typically  ${Q_1} = 0$. Sometimes it is convenient to pose this question in an alternative manner, i.e. determine the flow rate created by the same mean pressure gradient in channels with and without transpiration, which leads to the pressure gradient constraint in the form of
 \begin{gather}\; {\left. {\frac{{\partial {p_T}}}{{\partial x}}} \right|_{mean}} = {\left. {\frac{{\partial {p_0}}}{{\partial x}}} \right|_{mean}} + {\left. {\frac{{\partial {p_1}}}{{\partial x}}} \right|_{mean}} ={-} 2Re + A,\end{gather}
where typically  $A = 0$.
In the next section we briefly describe the numerical method in order to provide the reader with an assessment of the reliability and accuracy of our results.
3. Method of solution
The following presentation is limited to a short outline and is focused on the fixed flow rate constraint (more details can be found in Hossain et al. Reference Floryan2012). We define the stream function  $\psi (x,y)$ in the usual manner, i.e.
 ${u_1} = \partial \psi /\partial y$,
 ${v_1} ={-} \partial \psi /\partial x$, and eliminate pressure, bringing the governing equations to the following form:
 \begin{gather}{\nabla ^4}\psi - Re\; {u_0}\frac{\partial }{{\partial x}}({\nabla ^2}\psi ) + Re\frac{{{\textrm{d}^2}{u_0}}}{{\textrm{d}{y^2}}}\frac{{\partial \psi }}{{\partial x}} = NN(x,y),\end{gather}
where the nonlinear term NN is expressed as
 \begin{gather}NN(x,y) = \frac{\partial }{{\partial y}}\left( {\frac{{\partial \langle {u_1}{u_1}\rangle }}{{\partial x}} + \frac{{\partial \langle {u_1}{v_1}\rangle }}{{\partial y}}} \right) - \frac{\partial }{{\partial x}}\left( {\frac{{\partial \langle {u_1}{v_1}\rangle }}{{\partial x}} + \frac{{\partial \langle {v_1}{v_1}\rangle }}{{\partial y}}} \right),\end{gather}
 ${\nabla ^4}$ denotes the biharmonic operator and
 $\langle \cdots \rangle $ denotes products. The solution is assumed to be in the form of Fourier expansions, i.e.
 \begin{gather}\left.
{\begin{gathered} {\psi (x,y) = \mathop \sum
\limits_{n ={-} \infty }^{n ={+} \infty }
{\varphi^{(n)}}(y)\,{\textrm{e}^{\textrm{i}\,n\alpha
x}},\quad {u_1}(x,y) = \mathop \sum \limits_{n ={-} \infty
}^{n ={+} \infty }
u_1^{(n)}(y)\,{\textrm{e}^{\textrm{i}\,n\alpha x}},}\\
{{v_1}(x,y) = \mathop \sum \limits_{n ={-} \infty }^{n ={+}
\infty } v_1^{(n)}(y)\,{\textrm{e}^{\textrm{i}\,n\alpha
x}},\quad {p_1}(x,y) = Ax + \mathop \sum \limits_{n ={-}
\infty }^{n ={+} \infty }
p_1^{(n)}(y)\,{\textrm{e}^{\textrm{i}\,n\alpha x}},}
\end{gathered}} \right\}\end{gather}
where  $u_1^{(n)} = D{\varphi ^{(n)}}$,
 $u_1^{(n)} ={-} \textrm{i}\,n\alpha {\varphi ^{(n)}}$,
 ${\varphi ^{(n)}} = {\varphi ^{{{( - n)}^\ast }}}$,
 ${u_1}^{(n)} = {u_1}^{{{( - n)}^\ast }}$,
 ${v_1}^{(n)} = {v_1}^{{{( - n)}^\ast }}$,
 ${p_1}^{(n)} = {p_1}^{{{( - n)}^\ast }}$,
 $D = \textrm{d}/\textrm{d}y$, stars denote complex conjugates and A stands for the pressure gradient correction associated with the transpiration whose positive values identify reduction of pressure losses. The products are expressed using Fourier expansions of the form
 \begin{gather}\langle PR\rangle = \mathop \sum \limits_{n ={-} \infty }^{n ={+} \infty } {\langle FG\rangle ^{(n)}}(y)\,{\textrm{e}^{\textrm{i}\,n\alpha x}},\end{gather}
where  $\langle PR\rangle $ stands for any of the following quantities:
 $\langle {u_1}{u_1}\rangle $,
 $\langle {u_1}{v_1}\rangle $,
 $\langle {v_1}{v_1}\rangle $, NN. Substitution of (3.2) into (3.1) and separation of Fourier components results in a system of ordinary differential equations for the modal functions of the form
 \begin{gather}D_n^2{\varphi ^{(n)}} - \textrm{i}n\alpha Re({u_0}{D_n} - {D^2}{u_0}){\varphi ^{(n)}} = N{N^{(n)}},\end{gather}
where  ${D^2} = {\textrm{d}^2}/\textrm{d}{y^2}$,
 ${D_n} = {D^2} - {n^2}{\alpha ^2}$,
 $N{N^{(n)}} = \textrm{i}n\alpha D{\langle {u_1}{u_1}\rangle ^{(n)}} + {D^2}{\langle {u_1}{v_1}\rangle ^{(n)}} + {n^2}{\alpha ^2} {\langle {u_1}{v_1}\rangle ^{(n)}} - \textrm{i}n\alpha D{\langle {v_1}{v_1}\rangle ^{(n)}}$,
 $- \infty \lt n \lt + \infty $. The boundary conditions for the modal functions, which account for the flow rate constraint (2.5), are expressed as
 \begin{gather}{\varphi ^{(0)}}( - 1) = 0,\quad {\varphi ^{(0)}}( + 1) = 0,\end{gather}
 \begin{gather}{\varphi ^{(n)}}( - 1) = \textrm{i}\,R{e_L}f_L^{(n)}/n\alpha \quad \textrm{for}\;n \le {N_L},\quad {\varphi ^{(n)}}( - 1) = 0\quad \textrm{for}\;n \gt {N_L},\end{gather}
 \begin{gather}{\varphi ^{(n)}}( + 1) = \textrm{i}\,R{e_U}f_U^{(n)}/n\alpha \quad \textrm{for}\;n \le {N_U},\quad {\varphi ^{(n)}}( + 1) = 0\quad \textrm{for}\;n \gt {N_U},\end{gather}
 \begin{gather}D{\varphi ^{(n)}}( - 1) = 0,\quad D{\varphi ^{(n)}}( + 1) = 0\quad \textrm{for}\; - \infty \lt n \lt + \infty .\end{gather}
System (3.4) and (3.5) is solved numerically using Chebyshev expansions for the modal functions, Galerkin's procedure for conversion of the differential equations into algebraic equations and the Tau method for incorporation of boundary conditions (Canuto et al. Reference Canuto, Hussaini, Quarteroni and Zang1996).
The pressure modal functions are computed by inserting (3.2) into (2.4b) and separating Fourier modes, resulting in
 \begin{gather} p_1^{(n)} = \dfrac{{ -
\textrm{i}}}{{n\alpha }}\left[\vphantom{\left. \textrm{i}n\alpha \;
Re\dfrac{{\textrm{d}{u_0}}}{{\textrm{d}y}}{\varphi^{(n)}} -
\textrm{i}n\alpha {{\langle {u_1}{u_1}\rangle }^{(n)}} -
D{{\langle {u_1}{v_1}\rangle }^{(n)}}\right]} ({D^2} - {n^2}{\alpha^2} -
\textrm{i}n\alpha \; Re{u_0})D{\varphi^{(n)}}\right.
\nonumber\\ \quad + \left. \textrm{i}n\alpha \;
Re\dfrac{{\textrm{d}{u_0}}}{{\textrm{d}y}}{\varphi^{(n)}} -
\textrm{i}n\alpha {{\langle {u_1}{u_1}\rangle }^{(n)}} -
D{{\langle {u_1}{v_1}\rangle }^{(n)}}\right], \quad n
\ne 0, \end{gather}
 \begin{gather}A = {D^3}{\varphi ^{(0)}} - D{\langle {u_1}{v_1}\rangle ^{(0)}}.\end{gather}
The modal function  $p_1^{(0)}$ is computed by inserting (3.2) into (2.4c) and extracting the zeroth mode, resulting in the following expression:
 \begin{gather}p_1^{(0)} ={-} {\langle {v_1}{v_1}\rangle ^{(0)}} + \textrm{const}\textrm{.,}\end{gather}
where the integration constant is selected by setting the mean part  ${p_{mean}}$ of the periodic pressure component to zero, i.e.
 \begin{gather}{p_{mean}} = \frac{1}{{2\lambda }}\int_{ - 1}^1 {\int_0^\lambda {\left[ {\sum\limits_{n ={-} \infty }^{n ={+} \infty } {({p^{(n)}}\,{\textrm{e}^{\textrm{i}\,n\alpha x}}) + \textrm{const}\textrm{.}} } \right]} \,\textrm{d}x\,\textrm{d}y} = \frac{1}{2}\int_{ - 1}^1 {{p^{(0)}}\,\textrm{d}y} + \textrm{const}\textrm{.} = 0.\end{gather}
It is convenient for discussion purposes to write the expression for the total mean pressure gradient in the following form:
 \begin{gather}{\left. {\frac{{\partial {p_T}}}{{\partial x}}} \right|_{mean}} = Re\left( { - 2 + \frac{A}{{Re}}} \right),\end{gather}
as the effectiveness of the transpiration can be judged by comparing A with the reference pressure gradient −2Re required to drive the flow in the channel without transpiration (or by comparing A/Re with −2).
To implement the fixed pressure gradient constraint (2.6), we integrate (3.6b) to obtain
 \begin{gather}{D^2}{\varphi ^{(0)}}(1) - {D^2}{\varphi ^{(0)}}( - 1) = 2A,\end{gather}
which replaces boundary condition (3.5b).
4. Unimodal transpiration at one wall
We start discussion of transpiration effects with the simplest transpiration pattern, characterized by a single Fourier mode (unimodal transpiration) applied at one wall only, i.e.
 \begin{gather}{u_1}(x, - 1) = 0,\quad {v_1}(x, - 1) = {\textstyle{1 \over 2}}R{e_L}\cos (\alpha x),\end{gather}
 \begin{gather}{u_1}(x, + 1) = 0,\quad {v_1}(x, + 1) = 0.\end{gather}
4.1. Flow topologies and reduction of pressures losses
We begin our presentation with the description of flow topologies in order to provide the reader with a global view of the modifications created by transpiration. Typical topologies, shown in figure 2, demonstrate formation of a ‘cushion’ preventing direct contact between the stream and the wall, which is expected to lead to the reduction of flow resistance. The cushion has a finite thickness, which reduces the flow cross-sectional area available to the fluid and, in this sense, it may increase the flow resistance. The cushion thickness depends strongly on the transpiration wave number as it is a function of the fluid volume  ${Q_w} = 2R{e_L}/\alpha $ injected into the flow per half wavelength, i.e. it is large for long-wavelength transpiration and rapidly diminishes for short-wavelength transpiration for the nominally identical ReL. It also depends on the flow Reynolds number as faster flows limit penetration of the injected fluid into the channel (see figure 2). As a result, transpiration creates spatial flow modulations everywhere in the channel for small α's, while such modulations are limited to a thin boundary layer attached to the lower wall for large α's. In this limit, the stream lifts above the wall and slides on the cushion made of the injected fluid.
Flow topologies created by transpiration with ReL = 20 applied at the lower wall: (a–c) Re = 10, α = 0.5, 2.0, 10; (d–f) Re = 1000, α = 0.5, 2.0, 10. The thicker line identifies streamlines separating the stream from the fluid injected through the wall.

Variations of pressure gradient required to drive a specified fluid volume as a function of the transpiration wavelength displayed in figure 3 demonstrate increase of the pressure gradient for small α's, indicating the dominance of effects associated with the reduction of the cross-sectional area. Large  ${Q_w}$ requires a larger pressure gradient as the amount of mass which needs to be driven from the injection to the extraction zone increases significantly (see figure 3). One can show analytically (details not given due to their length) that for
 $\alpha \to 0$, the pressure gradient correction approaches a finite, α-independent limit whose magnitude is proportional to
 $Re$ and
 $Re_L^2$.
Variations of the pressure gradient correction A as a function of the transpiration wave number α for  $R{e_L} = 2,\; 20$ using log-linear scales in figure 3(a) and log-log scales in figure 3(b). Curves for both ReL’s overlap within the resolution of this figure. The cut-off wave numbers (see definition in the text) are
 ${\alpha _c} = 1.638,\; 1.638,\; 1.728,\; 1.925,\; 2.044$, or Re = 1, 10, 100, 500, 1000, respectively. The grey colour identifies conditions leading to the reduction of pressure losses.

Figure 3 demonstrates a decrease of the pressure gradient for large α's, indicating the dominance of the effects associated with the reduction of the direct contact between the stream and the wall. Analysis presented in Appendix A shows that this effect is proportional to  ${\alpha ^{ - 2}}$ and is the result of nonlinear interactions between the first three (0 + 1 + 2) modes. The character of variation of A in this limit is well illustrated in figure 3(b), which uses the log-log scale for display of the same data as shown in figure 3(a).
Figure 3 also demonstrates that A is proportional to  $Re_L^2$ in the whole range of α's. It further shows that there exists a cut-off wave number
 ${\alpha _c}$ which separates the resistance reducing from the resistance increasing transpirations.
The above discussion demonstrates that there are two mechanisms at work, i.e. reduction of the effective channel opening due to formation of a cushion made of transpiration ‘bubbles’, which dominates the flow response for small α's, and reduction of shear due to elimination of the direct contact between the stream and the transpired wall, which dominates for large α's. Both mechanisms are active for intermediate α's, but the system response under such conditions is dominated by a third mechanism which we shall discuss in the next subsection.
4.2. Nonlinear streaming
The third mechanism relies on the nonlinear interactions associated with transpiration, which generate a net propulsive force. To demonstrate this effect, we change problem formulation by imposing the fixed pressure gradient constraint (2.6) with  $A = 0$. We start with no external mean pressure gradient
 $(Re = 0)$, apply unimodal suction at the lower wall, begin with a very small
 $R{e_L}$ and keep increasing it while evaluating the mean longitudinal flow rate
 ${Q_1}$. Variations of
 ${Q_1}$ as a function of
 $R{e_L}$, displayed in figure 4(a), demonstrate that there is no mean flow if
 $R{e_L}$ is below a certain critical value
 $R{e_{L,crit}}$, with
 $R{e_{L,crit}} = 50$ for conditions used in this test. Once
 $R{e_{L,crit}}$ is exceeded, net longitudinal flow appears, which can be directed either to the right or to the left with variations of
 ${Q_1}$ as a function of
 $R{e_L}$ following a typical pitchfork bifurcation. The direction of the flow is dictated by edge effects, which may be difficult to control. Introduction of the external mean pressure gradient
 $(Re \gt 0)$ breaks the symmetry and results in a smooth increase of
 ${Q_1}$ with
 $R{e_L}$, with this increase being initially proportional to
 $Re_L^2$. We shall refer to this effect as nonlinear streaming. This effect does exist for ReL’s smaller than
 $R{e_{L,crit}}$, but it is not strong enough to generate its own flow – it just assists the pressure gradient with propelling the fluid. It is of interest to observe that the presence of a flow driven by the mean pressure gradient mitigates the streaming effect since
 ${Q_1}$ for
 $Re = 0$ becomes rapidly larger than
 ${Q_1}$ for
 $Re \ne 0$ as
 $R{e_L}$ increases above
 $R{e_{L,crit}}$. The flow topologies illustrated in figure 5 demonstrate flow symmetry below
 $R{e_{L,crit}}$ and elimination of this symmetry by nonlinear streaming for
 $R{e_L} \gt R{e_{L,crit}}$ with transpiration ‘rolls’ becoming skewed either to the left or to the right. The critical value of
 $R{e_L}$ depends strongly on
 $\alpha $ with its minimum occurring at
 $\alpha = 2.53$;
 $R{e_{L,crit}}$ rapidly increases as
 $\alpha $ either increases above 2.53 or decreases below 2.53, as illustrated in figure 4(b). The minimum of
 $R{e_{L,crit}}$ correlates well with the maximum reduction of pressure losses (see figure 3), which supports the conclusion that nonlinear streaming is responsible for most of the reduction of pressure losses for
 $\alpha = 0(1)$.
Variations of the flow rate correction  ${Q_1}\; $ a function of
 $R{e_L}$ for
 $\alpha = 2$ determined using the fixed pressure gradient constraint (2.6) with
 $A = 0$ are displayed in figure 4(a). Flow patterns for conditions identified using black squares are displayed in figure 5. Dotted lines illustrate growth of
 ${Q_1}$ for small ReL’s. Variations of the critical value
 $R{e_{L,crit}}$ required for the onset of the streaming as a function of
 $\alpha $ are displayed in figure 4(b).

Flow patterns for  $Re = 0$,
 $\alpha = 2$,
 $R{e_L} = 50$ (a) and
 $R{e_L} = 70$ (b,c).

4.3. Description of flow properties
In this section we shall provide a detailed description of processes leading to changes in the flow resistance. This resistance is created by wall shear, which consists of three elements:
 \begin{gather}\tau (x, - 1) ={-} 2Re + \frac{1}{2}R{e_L}\alpha \sin (\alpha x) - {\left. {\frac{{\partial {u_1}}}{{\partial y}}} \right|_{y ={-} 1}} ={-} 2Re + {\tau _{1,L}} + {\tau _{2,L}} ={-} 2Re + {\tau _{ad,L}},\end{gather}
 \begin{gather}\tau (x,1)\; \; ={-} 2Re - \frac{1}{2}R{e_U}\alpha \sin (\alpha x) + {\left. {\frac{{\partial {u_1}}}{{\partial y}}} \right|_{y = 1}}\; \; ={-} 2Re + {\tau _{2,U}} ={-} 2Re + {\tau _{ad,U}},\end{gather}
where the first term accounts for contributions from the unmodified flow, the second term captures the direct forcing associated with the transpiration and the third term describes contributions from the transpiration-induced flow modifications. While the second term (direct forcing) does not affect the average shear, the third term (flow modifications) may increase or decrease the mean shear and, thus, this term is responsible for changes in the overall friction. Distributions of  ${\tau _{2,L}}$ and
 ${\tau _{2,U}}$, illustrated in figure 6, are characterized by very large amplitudes (compare with 2Re for the flow with no transpiration), as well as changes of direction. The resulting mean stresses at the lower wall for
 $Re = 10,\alpha = (0.5,2.7)$ are
 ${\tau _{L,m}} = ( - 18.76,2.878)$; for
 $Re = 1000$ and
 $\alpha = (0.5,5.15)$, they are
 ${\tau _{L,m}} = ( - 106.2,1.542)$. Mean stresses at the upper wall for
 $Re = 10$ and
 $\alpha = (0.5,\; 2.7)$ are
 ${\tau _{U,m}} = ( - 2.349,\; \; 0.9605)$; for
 $Re = 1000,\alpha = (0.5,\; 5.15)$, they are
 ${\tau _{U,m}} = ( - 19.06,0.5520)$. The wave numbers used in this figure were selected to illustrate drag increasing distributions (α = 0.5) and drag decreasing distributions (α = 2.70 gives the maximum decrease of friction for Re = 10; α = 5.15 gives maximum decrease of friction for Re = 1000). The increase of friction occurs approximately in the zone
 $x \in (0,\lambda /2)$, i.e. the zone of the largest reduction of the effective flow cross-sectional area (see figure 2), while decrease occurs for
 $x \in (\lambda /2,\; \lambda )$ where decrease in the cross sectional area is much smaller (but not zero). The velocity distributions displayed in figure 7 demonstrate flow acceleration in the zone with the largest reduction of the flow cross-sectional area and deceleration in the zone of the smallest reduction in the cross-sectional area.
Distributions of shear stress components acting on the fluid for ReL = 20, ReU = 0:  ${\tau _{1,L}}$ (dashed lines),
 ${\tau _{2,L}}\; $ (dash-dotted lines),
 $\; {\tau _{ad,L}}\; $ and
 ${\tau _{ad,U}}$ (solid lines).
 ${\tau _{2,L}}$ and
 ${\tau _{ad,L}}\; $ figure 6(b) for
 $\alpha = 0.5$ were multiplied by 0.1 and
 ${\tau _{ad,U}}$ in figure 6(d) for α = 0.5 was multiplied by 0.001 for display purposes.


When  $\alpha $ is large enough, the decrease of shear dominates, resulting in an overall reduction of pressure losses. The flow topologies displayed in figure 2 demonstrate stream lift away from the wall; the flow cross-sectional area decreases, but the transpiration-induced stream cushioning near the wall results in an overall decrease of the drag as the stream ‘slides’ on the cushion made of the injected fluid.
The mean values of  ${\tau _{ad,L}}$ and
 ${\tau _{ad,U}}$, i.e.
 $\; {\tau _{L,mean}}$ and
 ${\tau _{U,mean}}$, vary in a very similar manner as functions of α, with both contributing to the drag reduction for transpirations with sufficiently short wavelengths and with the lower stress being much larger and thus dominating the system response (figure 6). The maximum drag reduction occurs at
 $\alpha = {\alpha _m}$, and variations of
 ${\alpha _m}$ as a function of Re displayed in figure 8 show
 ${\alpha _m} \approx 2.7$ and being insensitive to changes of Re for Re < 10, then increasing up to
 ${\alpha _m} \approx 5$ at Re ≈ 400 and subsequently decreasing down to
 ${\alpha _m} \approx 2$ at Re ≈ 5000. The same figure shows that the cut-off wave number is approximately constant, with
 ${\alpha _c} \approx 1.638$, when Re < 10 and increases to around
 $2$ when Re increases to 5000.
Variations of the additional mean shear at the lower ( ${\tau _{L,\; m}}$, solid line) and upper (
 $5\ast {\tau _{U,\; m}}$, dashed lines) walls as well as their sums (dashed-dotted line) as functions of
 $\alpha $ for ReL = 2, Re = 10 are displayed in figure 8(a). Variations of the cut-off wave number
 ${\alpha _c}$ resulting in A = 0 (solid line) and the wave number
 ${\alpha _m}$ giving the largest A (dashed line) as functions of
 $Re$ for
 $R{e_L} \le 20$ are displayed in figure 8(b).

The results displayed in figure 9(a) demonstrate that the reduction of pressure losses is initially proportional to Re for  $Re \lt 20$ and then slows down with further increase of Re. It increases proportionally to
 $Re_L^2$ within the range of ReL’s of interest as demonstrated in figure 9(b). Once
 $R{e_L}$ reaches a certain critical value, the reduction of pressure losses is equal to the pressure losses of the reference flow, i.e. there is no need for any external pressure gradient to maintain the fluid movement. When
 $R{e_L}$ exceeds the critical value, an opposite pressure gradient must be imposed to slow down the fluid movement in order to maintain the prescribed flow rate. This effect can be attributed to the nonlinear streaming. The results displayed in figure 10 show the relationship between the reduction of pressure losses and the typical flow and transpiration conditions.
Variations of the pressure gradient correction A: (a) as a function of Re for α = 2 and (b) as a function of  $R{e_L}$. Grey zones identify conditions where transpiration can drive the flow by itself, i.e. without any external pressure gradient. Thick solid (dashed) lines correspond to positive (negative) values.

Variations of  $20\ast A/(Re\ast Re_L^2)$ (solid line) and
 $A/Re_L^2$ (dashed line) as functions of α and Re are displayed in figure 10(a). Variations of A/Re for Re = 10 (solid lines) and 100*A/Re for Re = 1000 (dashed lines) as functions of α and ReL are displayed in figure 10(b). Grey colours identify conditions leading to a reduction of pressure losses.

4.4. Energetics
It is of interest to determine if the use of transpiration can lead to a net reduction of energy cost associated with fluid movement. To determine energy balances, we start with the field equations expressed in terms of the full flow quantities, multiply the x-momentum equation by  ${u_T}$, the y-momentum equation by
 ${v_T}$, add them together and integrate over the control volume extending between the walls in the y-direction and over one wavelength in the x-direction to arrive at
 \begin{gather}\begin{array}{ccccc} & \int_0^\lambda {\int_{ - 1}^1 {\left( {u_T^2\dfrac{{\partial {u_T}}}{{\partial x}} + {u_T}{v_T}\dfrac{{\partial {u_T}}}{{\partial y}} + {u_T}{v_T}\dfrac{{\partial {v_T}}}{{\partial x}} + v_T^2\dfrac{{\partial {v_T}}}{{\partial x}}} \right)} \,\textrm{d}y\,\textrm{d}x} \\ & \quad ={-} \int_0^\lambda {\int_{ - 1}^1 {\left( {{u_T}\dfrac{{\partial {p_T}}}{{\partial x}} + {v_T}\dfrac{{\partial {p_T}}}{{\partial y}}} \right)\,\textrm{d}y\,\textrm{d}x} } \\ & \quad \quad + \int_0^\lambda {\int_{ - 1}^1 {\left( {{u_T}\dfrac{{{\partial^2}{u_T}}}{{\partial {x^2}}} + {u_T}\dfrac{{{\partial^2}{u_T}}}{{\partial {y^2}}} + {v_T}\dfrac{{{\partial^2}{v_T}}}{{\partial {x^2}}} + {v_T}\dfrac{{{\partial^2}{v_T}}}{{\partial {y^2}}}} \right)} \,\textrm{d}y\,\textrm{d}x.} \end{array}\end{gather}
Re-arrangement of the left-hand-side (LHS), its integration by parts, use of the continuity equation and simplification due to x-periodicity result in
 \begin{gather}LHS =
\tfrac{1}{2}\int_0^\lambda {(v_T^3{|_{y = 1}} - v_T^3{|_{y
={-} 1}})\,\textrm{d}x}
.\end{gather}
Re-arrangement of the second term on the right-hand-side (RHS2), its integration by parts, use of the boundary and periodicity conditions as well as the continuity equation lead to
 \begin{gather}RHS2 ={-} \int_0^\lambda {\int_{ - 1}^1 {\left[ {{{\left( {\frac{{\partial {u_T}}}{{\partial x}}} \right)}^2} + {{\left( {\frac{{\partial {u_T}}}{{\partial y}}} \right)}^2} \!+\! {{\left( {\frac{{\partial {v_T}}}{{\partial x}}} \right)}^2} + {{\left( {\frac{{\partial {v_T}}}{{\partial y}}} \right)}^2}} \right]} } \,\textrm{d}y\,\textrm{d}x \!=\!{-} DIS({u_T},{v_T}),\end{gather}
where  $DIS({u_T},{v_T})$ stands for the dissipation function for the full flow quantities. Re-arrangements of the first term on the right-hand-side (RHS1) begins with dividing pressure into the linear and periodic components, i.e.
 \begin{gather}{p_T} = Bx + {p_1}(x,y),\end{gather}
where B stands for the mean pressure gradient and  ${p_1}$ denotes the periodic component. Substituting (4.6) into RHS1, integrating by parts, and taking advantage of the periodicity conditions and the continuity equation leads to
 \begin{gather}RHS2 ={-} B\lambda {Q_T} - \int_0^\lambda {[{{({v_T}{p_1})}_{y = 1}} - {{({v_T}{p_1})}_{y ={-} 1}}]} \,\textrm{d}x,\end{gather}
where  ${Q_T}$ is the flow rate. Substitution of (4.4), (4.5) and (4.7) into (4.3) and re-arrangements lead to a relationship of the form
 \begin{gather}B\lambda
{Q_T} ={-} \int_0^\lambda {\left\{ {{{\left[ {{v_T}\left(
{\tfrac{1}{2}v_T^2 + {p_1}} \right)} \right]}_{y = 1}} -
{{\left[ {{v_T}\left( {\tfrac{1}{2}v_T^2 + {p_1}} \right)}
\right]}_{y ={-} 1}}} \right\}\,\textrm{d}x} -
DIS({u_T},{v_T}),\end{gather}
where the integral can be viewed as the kinetic energy inserted at the slots and the work associated with transpiration done at the slots. Write conservation of the x-momentum for the same control volume to arrive at
 \begin{gather}\int_{ - 1}^1 {{p_T}{|_{x = 0}}\,\textrm{d}y} - \int_{ - 1}^1 {{p_T}{|_{x = \lambda }}\,\textrm{d}y} - \int_0^\lambda {({\tau _T}{|_{y = 1}} + {\tau _T}{|_{y ={-} 1}})\,\textrm{d}x} = 0,\end{gather}
where  ${\tau _T}$ stands for the wall shear stress. Substitute (4.6) and simplify to arrive at
 \begin{gather}2B\lambda = \int_0^\lambda {\left( {{{\left. {\frac{{\partial {u_T}}}{{\partial y}}} \right|}_{y = 1}} - {{\left. {\frac{{\partial {u_T}}}{{\partial y}}} \right|}_{y ={-} 1}}} \right)\,\textrm{d}x} ={-} {D_{s,T}},\end{gather}
where  ${D_{s,T}}$ stands for the shear drag force. Use of (4.10) in (4.8) leads to
 \begin{gather}{D_{s,T}}{Q_T}
= 2\int_0^\lambda {\left\{ {{{\left[ {{v_T}\left(
{\tfrac{1}{2}v_T^2 + {p_1}} \right)} \right]}_{y = 1}} -
{{\left[ {{v_T}\left( {\tfrac{1}{2}v_T^2 + {p_1}} \right)}
\right]}_{y ={-} 1}}} \right\}\,\textrm{d}x} + 2\;
DIS({u_T},{v_T}),\end{gather}
where the product  ${D_{s,T}}{Q_T}$ describes the external power required to maintain the modified flow. To determine the power required to maintain the unmodified flow, substitute
 \begin{gather}{u_T} = Re{u_0},\quad {v_T} = 0,\quad {Q_T} = {\textstyle{4 \over 3}}Re,\quad B ={-} 2\; Re,\quad {D_{s,T}} = 4\lambda \; Re,\quad {u_0} = 1 - {y^2},\end{gather}
into (4.11) to arrive at
 \begin{gather}{D_{s,un}}{Q_T}
= \tfrac{{16}}{3}\lambda \;
R{e^2},\end{gather}
where  ${D_{s,un}}$ stands for the drag of the unmodified flow and the flow rate remains the same in view of the fixed flow rate constraint. It is easy to verify (4.11) as
 $DIS(Re\; {u_0},0) = {\textstyle{8 \over 3}}\lambda \; R{e^2}$. The difference of power requirements associated with the modified and unmodified flows can be expressed as
 \begin{align}
({D_{s,T}} - {D_{s,un}}){Q_T} & = 2\displaystyle\int_0^\lambda {\left\{
{{{\left[ {{v_1}\left( {\tfrac{1}{2}v_1^2 + {p_1}} \right)}
\right]}_{y = 1}} - {{\left[ {{v_1}\left(
{\tfrac{1}{2}v_1^2 + {p_1}} \right)} \right]}_{y ={-} 1}}}
\right\}\,\textrm{d}x} \notag\\
& \quad + 2\; DIS({u_1},{v_1}),
\end{align}
and this expression can be further reduced to the following form:
 \begin{gather}-
\tfrac{4}{3}\lambda \; Re\; A - \int_0^\lambda {\left\{
{{{\left[ {{v_1}\left( {\tfrac{1}{2}v_1^2 + {p_1}} \right)}
\right]}_{y = 1}} - {{\left[ {{v_1}\left( {\tfrac{1}{2}v_1^2
+ {p_1}} \right)} \right]}_{y ={-} 1}}}
\right\}\,\textrm{d}x} =
DIS({u_1},{v_1}).\end{gather}
The additional dissipated energy  $DIS({u_1},{v_1})$ comes either from the increase of pressure losses or from the work done at the boundaries. When pressure losses are reduced
 $(A \gt 0)$, the work done at the boundaries must increase.
We now use (2.2) and (3.2) in (4.15), specialize the above relationship to the unimodal transpiration applied at the lower wall, carry out the required integration and express all components per unit channel length, which leads to
 \begin{gather}- {\textstyle{4 \over 3}}Re\; A + {\textstyle{1 \over 4}}R{e_L}(p_1^{(1)} + p_1^{( - 1)}){|_{y ={-} 1}} = {\lambda ^{ - 1}}DIS({u_1},{v_1}).\end{gather}
Typical distributions of  ${p_1}(x, - 1)$, illustrated in figure 11(a), demonstrate its strong dependence on Re, including changes of its amplitude as well as phase shift with respect to transpiration. Variations of the second term on the LHS, i.e. work done at the transpiration slots
 ${\lambda ^{ - 1}}{\wp _{per}}$ as a function of
 $\alpha $, illustrated in figure 11(b), show that the stream can assist with the transpiration as
 ${\wp _{per}}$ can be negative but only if Re is large enough (
 $Re \gt 30$ for the conditions used in this figure). The range of α's where pressure modifications promote transpiration rather than opposing it (negative
 ${\wp _{per}}$) expands quite rapidly with Re. Variations of the phase difference
 $\phi = \textrm{arctan(}Imag(p_1^{(1)})\textrm{/}Real(p_1^{(1)})\textrm{)}$ between the wall pressure and the transpiration as a function of
 $\alpha $, illustrated in figure 11(c), correlate well with changes of sign of
 ${\wp _{per}}$, which suggests that it is the phase shift that is responsible for the sign change.
(a) Distributions of the periodic pressure component  ${p_1}$ at the lower wall for Re = 10 (solid lines) and Re = 1000 (dashed lines). (b) Variations of the work at the slots
 ${\lambda ^{ - 1}}{\wp _{per}}$ as a function of α. (c) Variations of the phase difference
 $\phi $ between the wall transpiration and the periodic component of the wall pressure as a function of α. All results are for ReL = 20.

The most energetically effective configuration from the point of view of reduction of pressure losses corresponds to the minimization of dissipation  ${\lambda ^{ - 1}}DIS({u_1},{v_1})$ while maintaining
 $A \gt 0$. The variations of
 ${\lambda ^{ - 1}}DIS({u_1},{v_1})$ with α illustrated in figure 12 demonstrate that α's near αc's provide the largest reduction of pressure losses at the lowest energy cost.
Variations of dissipation increase  ${\lambda ^{ - 1}}DIS({u_1},{v_1})$ (see text for details) as a function of
 $\alpha $ for ReL = 20. Arrows show α’s which lead to the reduction of pressure losses.

5. Transpiration applied at both walls and pattern interaction effects
The discussion so far has focused on the use of transpiration on one wall only. We shall now inquire how adding transpiration to the other wall may affect the system response. The proper boundary conditions have the form
 \begin{gather}{u_1}(x, - 1) = 0,\quad {v_1}(x, - 1) = {\textstyle{1 \over 2}}R{e_L}\cos (\alpha x),\end{gather}
 \begin{gather}{u_1}(x, + 1) = 0,\quad {v_1}(x, + 1) = {\textstyle{1 \over 2}}R{e_U}\cos (\alpha x + \varOmega ),\end{gather}
which introduces two new parameters, i.e. the phase shift  $\varOmega $ between the upper and lower transpiration patterns and the amplitude
 $R{e_U}$ of the upper transpiration. We shall focus our attention on
 $R{e_L} = R{e_U}$, i.e. eliminate the effect of different transpiration amplitudes and study the effects of their spatial distributions. This problem can be viewed as a pattern interaction problem where the system response changes as a function of the relative position of both patterns. The flow topologies (not shown) display characteristics similar to the one-wall transpiration, i.e. deep penetration of the transpiration cushion into the channel for small α's, flow modulation constrained to very thin boundary layers for large α's and a transition region in-between where nonlinear streaming plays an important role. The relative position of both patterns is important for small α's, where the stream has either to squeeze in-between the two cushions for
 $\varOmega = {\rm \pi} $ or to meander between them for
 $\varOmega = 0$. This distinction is irrelevant for large α's as spatial modulations are constrained to the boundary layers, with the flow being rectilinear everywhere else. The situation is more complex for
 $\alpha = 0(1)$. Increase of Re reduces modulation with A marginally affected by
 $\varOmega $ (see the results for
 $Re = 1000$ in figure 13). Modulations are significant for small Re’s, and their character changes with
 $\varOmega $ resulting in larger A's in a smaller range of α's for
 $\varOmega = 0$ and smaller A's extending over a wider range of α's for
 $\varOmega = {\rm \pi} $.
Variations of  $100\ast A/(Re\ast Re_L^2)$ as a function of
 $\alpha $ and
 $\varOmega $ for
 $R{e_L} = R{e_U}$ are displayed in figure 13(a). Grey colours identify conditions leading to the reduction of pressure losses. Variations of
 $A/(Re\ast Re_L^2)$ as a function of
 $\alpha $ for selected
 $\varOmega \mathrm{^{\prime}}\textrm{s}$ for the same conditions are displayed in figure 13(b).
 $Re = 10$ – solid lines;
 $Re = 1000$ – dashed lines.

Figure 14 illustrates how  $\varOmega $ affects the nonlinear streaming. There is an almost 50 % reduction of
 $R{e_{L,crit}}$ at
 $Re = 0$ when
 $\varOmega $ decreases from
 $\varOmega = {\rm \pi} $ to
 $\varOmega = 0$, with most of this decrease taking place between
 $\varOmega = {\rm \pi} /2$ and
 $\varOmega = 0$. This means that streaming can produce a very wide range of flow rates for certain ReL’s, e.g.
 $R{e_L} = 45$. On the other hand, variations of
 $\varOmega $ have little effect on
 ${Q_1}$ when Re increases beyond
 $Re = 10$.
Variations of the flow rate correction  ${Q_1}$ for the unimodal transpiration applied at both walls (see (5.1)) as a function of
 $R{e_L} = R{e_U}$ for
 $\alpha = 2$ and
 $Re = 0$ (solid lines),
 $Re = 1$ (dashed lines),
 $Re = 10$ (dotted lines), determined using the fixed pressure gradient constraint (2.6). Dotted line illustrates the one-wall transpiration with
 $Re = 0$. Only the upper parts of the bifurcation diagrams are displayed.

To analyse the energy cost, we start with (4.15), insert (2.2), (3.2), (5.1), carry out integrations and express all quantities per unit channel length to arrive at
 \begin{align} &- {\textstyle{4 \over 3}}\; ReA + {\textstyle{1 \over 4}}R{e_L}(p_1^{(1)} + p_1^{( - 1)}){|_{y ={-} 1}} - {\textstyle{1 \over 4}}R{e_U}({\textrm{e}^{ - \textrm{i}\,\varOmega }}p_1^{(1)}\nonumber\\ &\quad + {\textrm{e}^{\textrm{i}\,\varOmega }}p_1^{( - 1)}){|_{y = 1}} = {\lambda ^{ - 1}}DIS({u_1},{v_1}).\end{align}
Variations of  ${\lambda ^{ - 1}}DIS({u_1},{v_1})$, illustrated in figure 15, demonstrate that the largest reduction of pressure losses (see figure 13) at the smallest energy cost can be achieved for
 $\varOmega = 0$ and α's slightly larger than
 ${\alpha _c}$. Comparisons of figures 3, 12, 13 and 15 show that transpiration applied at both walls under the most optimal conditions provides the potential for a larger reduction in pressure losses at a similar energy cost to the one-wall transpiration.
Variations of  ${10^{ - 3}}{\lambda ^{ - 1}}DIS({u_1},{v_1})$ for ReU = ReL = 20 and Re = 100 (solid lines) and Re = 1000 (dashed lines).

6. Multimodal transpiration and commensurability effects
The discussion in the previous section was focused on transpiration distributions characterized by a single wave number, which is a very special case. We shall now consider general distributions and focus our attention on distributions characterized by two distinct wave numbers  $\beta $ and
 $\gamma $. The wall-normal velocity distribution at the lower wall has the form
 \begin{gather} {v_1}(x, - 1) = R{e_L}{G_s}(x)\nonumber\\ \quad = R{e_L}[{V_\beta }\cos (\beta x) + {V_\gamma }\cos (\gamma x + \varOmega )]/\{ max[{V_\beta }\cos (\beta x) + {V_\gamma }\cos (\gamma x + \varOmega )]\\ \quad \quad - min\textrm{[}{V_\beta }\cos (\beta x) + {V_\gamma }\cos (\gamma x + \varOmega )\textrm{]}\}\nonumber , \end{gather}
where  ${G_s}(x)$ is the shape function describing transpiration distribution such that
 $max[{G_s}(x)] - min\textrm{[}{G_s}\textrm{(}x\textrm{)]} = 1$ in view of the scaling used in § 2,
 $\; {V_\beta }$ and
 ${V_\gamma }$ denote amplitudes of each mode and
 $\varOmega $ is the phase difference between them. We are interested in investigating the effects of spatial distributions rather than the effects of amplitudes of different modes, so accordingly, we assume that
 ${V_\beta } = {V_\gamma } = 1$. Define the commensurability index as
 \begin{gather}CI = {\lambda _\beta }/{\lambda _\gamma },\end{gather}
with  $CI = 1$ corresponding to the reference point where both modes have the same wavelength and their superposition reduces to the case discussed in the previous section (see § 5). In general, the flow system may be either periodic with periodicity defined by
 $CI$ (commensurable systems) or aperiodic when
 $CI$ is irrational (non-commensurable systems). If we assume that the wavelength
 ${\lambda _s}$ of the system is
 ${\lambda _s} = m{\lambda _\beta } = n{\lambda _\gamma }$, then F is a function of
 $\varOmega $ which varies in the range
 $0 \le \varOmega \le 2n{\rm \pi} $.
Figure 16 illustrates typical results obtained for  $\beta = 2$ with
 $\gamma $ being adjusted to provide the desired value of
 $CI$. Only the maximum of A over all values of
 $\varOmega $ is reported. The results clearly demonstrate that the largest effect is achieved when transpiration is concentrated in a single Fourier mode. Distribution of the transpiration mass flux among different modes rather than concentrating it in a single mode results in a decrease of the drag reducing effect. CI < 1 gives preference to the long wavelength modulations, which actually increases the losses, while CI > 1 gives preference to the short wavelength modulations, which decreases the drag reducing effect.
Variations of the pressure gradient correction A as a function of the commensurability index CI for  $\beta = 2$,
 $R{e_L} = 10$,
 $Re = 10$ (solid lines) and
 $Re = 1000$ (dashed lines).

7. Finite size suction/blowing slots
The discussion so far was focused on a continuous distribution of transpiration. Practical applications require the use of finite-size suction/blowing slots of various sizes and at various distances from each other. One possible arrangement is sketched in figure 17(a), where all slots have the same width. Velocity profiles at the outlets/inlets have parabolic forms as the relevant Reynolds number is small, and their maxima are ½ to conform with the scaling introduced in § 2. Distribution of the wall normal velocity at the wall is represented as a Fourier expansion with coefficients determined numerically using fast Fourier transform (FFT). Results displayed in figure 17(b) demonstrate a rapid convergence of the computed value of A as the number of Fourier modes  ${N_L}$ used to represent wall velocity increases. Two Fourier modes are enough to represent velocity for large Re's, while up to six modes are required for small Re's. These results demonstrate the existence of a reduced distribution model as details of velocity distribution captured by higher Fourier modes are irrelevant as far as the prediction of pressure losses is concerned.
Sketch of the transpiration system with finite size slots is displayed in figure 17(a). Variations of A as a function of the number of Fourier modes  ${N_L}$ used to represent this velocity for
 $Re = 10,\; 1000$,
 $\alpha = 2$,
 $R{e_L} = \; 10$,
 $R{e_U} = 0$,
 $K2 = K3 = 0.1\lambda $ are illustrated in figure 17(b).

One is interested in the determination of the slot configuration which produces the largest A. This problem can be solved as a nonlinear constrained optimization problem using the interior point optimization algorithm (Coleman & Li Reference Coleman and Li1994, Reference Bocquet and Lauga1996). Since such optimization methods can be trapped in a local maximum (Byrd, Hribar & Nocedal Reference Bewley1999; Byrd, Gilbert & Nocedal Reference Byrd, Gilbert and Nocedal2000; Waltz et al. Reference Min, Kang, Speyer and Kim2006), this problem was solved both as an optimization problem and directly for all possible parameter combinations. The results, displayed in figure 18, confirm the existence of both local and global maxima. They demonstrate that the pressure gradient correction varies widely with variations of slot geometry, with the best performance achieved when the distance between the slots is smallest. A very reasonable estimate of the best performance of such a system can be achieved by working with a continuous transpiration described by a single Fourier mode, with the wave number dictated by the wavelength of the slot system and the amplitude dictated by the transpiration Reynolds number. This technique can be easily adapted to more complex slot distributions.
Variations of A for the slotted transpiration system sketched in figure 17 as a function of the geometric parameters  ${K_2}$ and
 ${K_3}$ (see figure 17 for definitions) for (a)
 $R{e_L} = 1$,
 $R{e_U} = 0$,
 $\alpha = 2$,
 $Re = 10$ and (b)
 $Re = 1000$. The circle identifies the global maximum. The grey planes identify A for the sinusoidal transpiration with the same parameters as well as planes A = 0.

Figure 19 illustrates the formation of the nonlinear streaming. Slotted transpiration is more effective in its formation in the sense that the required critical  $R{e_L}$ is smaller than in the sinusoidal transpiration, and the resulting horizontal flow rate is larger. This is because ‘jets’ emanating/entering slots are more concentrated and thus less stable to transverse deflections.
Variations of the flow rate correction  ${Q_1}$ for the slotted transpiration applied at the lower wall as a function of
 $R{e_L} = R{e_U}$ for
 $\alpha = 2$ determined using the fixed pressure gradient constraint (2.6). Unimodal sinusoidal transpiration – dotted line.

8. Summary
We have carried out an analysis of pressure losses in transpiration-modified laminar channel flows. The flow Reynolds number Re was kept sufficiently small to guarantee the existence of stable flows. Transpiration was applied either at one or both walls, with their distributions described by Fourier expansions, which led to the characterization of their spatial patterns in terms of wave numbers and their intensity in terms of the lower  $(R{e_L})$ and upper
 $(R{e_U})$ transpiration Reynolds numbers.
It is shown that pressure losses of the modified flow are affected by: (i) the reduction of the effective flow cross-sectional area due to blockage by the bubbles formed by the injected fluid, (ii) the elimination of direct contact between the stream and the side walls and (iii) the formation of the nonlinear streaming effect. The first effect dominates for long wavelength transpiration, resulting in an increase of pressure losses. The second effect dominates for short wavelength transpiration where the stream lifts above the cushion formed by bubbles of injected fluid, resulting in a reduction of pressure losses. The third effect dominates for transpiration wavelengths of the order of the channel opening and results in the largest possible reduction of pressure losses.
The quantification of the drag reducing effect was posed as a question of determining the pressure gradient correction A required to maintain the same flow rate in the modified channel as in the original unmodified channel. The magnitude of the positive correction provides a measure of the drag reduction. It is shown that the transpiration wave number  $\alpha $ must be larger than a cut-off value
 ${\alpha _c}$ in order to achieve drag reduction;
 ${\alpha _c}$ changes marginally with Re. It is also shown that the wave number
 ${\alpha _m}$ resulting in the maximum reduction of pressure losses is not too dissimilar from
 ${\alpha _c}$ for small Re's but increases with Re for Re > 10. It is further shown that the magnitude of the drag reduction increases proportionally to
 $Re_L^2$ and that sufficiently strong transpiration leads to self-pumping, i.e. there is no need to apply an external pressure gradient to maintain the same flow rate as in the unmodified channel. It is shown that the drag reducing effect increases proportionally to Re for Re < 10, but it weakens with further increase of Re. Simultaneous use of transpiration at both walls leads to pattern interaction effects which can either increase or decrease the drag depending on the relative position of both patterns. It is shown that in-phase patterns are more effective than out-of-phase patterns, with the former being able to produce drag reduction about five times larger than the latter under the most optimal conditions. Comparisons of transpirations characterized by multiple spatial wave numbers are quantified in terms of the commensurability index CI. It is shown that transpirations with CI = 1 are most effective, i.e. it is best to concentrate transpiration in a single spatial wave number.
Practical implementations of transpiration require the use of finite-size slots. It is shown that the performance of such slot systems can be easily estimated using a reduced distribution model where the actual velocity at the wall is replaced by a few leading Fourier modes from its Fourier expansion. The best performance is achieved for the smallest distance between the suction and blowing slots, and a respectable prediction of the performance of such a system can be achieved using continuous transpiration described by a single Fourier mode with the same wave number as the wave number of the finite-slot system and the same transpiration Reynolds number.
Analysis of the energy costs shows that the overall energy cost of the modified flow is higher than the cost of the unmodified flow. Energy costs corresponding to drag reduction are of interest. These costs vary widely but are lowest for transpiration with α’s slightly above  ${\alpha _c}$. These conditions define the best performance for a propulsion augmentation system utilizing wall transpiration.
Funding
This work has been carried out with the support of NSERC of Canada and CSC (China Scholarship Council).
Declaration of interests
The authors report no conflict of interest.
Appendix A. Solution for the short-wavelength ( $\alpha \rightarrow \infty$) sinusoidal transpiration

The amount of fluid inserted/extracted from the channel per half transpiration wavelength decreases proportionally to 1/α, resulting in small flow modulations. Accordingly, assume that the solution can be represented as a power series in terms of a small parameter ε expressing the magnitude of the modulations of the form
 \begin{gather}{u_1} = \varepsilon {\hat{u}_1} + {\varepsilon ^2}{\hat{u}_2} + 0({\varepsilon ^3}),\quad {v_1} = \varepsilon {\hat{v}_1} + {\varepsilon ^2}{\hat{v}_2} + 0({\varepsilon ^3}),\quad {p_1} = \varepsilon {\hat{p}_1} + {\varepsilon ^2}{\hat{p}_2} + 0({\varepsilon ^3}).\end{gather}
Substitute (A1a–c) into (2.3)–(2.5) and extract the leading-order system
 \begin{gather}\; - \frac{{\partial {{\hat{p}}_1}}}{{\partial x}} + \frac{{{\partial ^2}{{\hat{u}}_1}}}{{\partial {x^2}}} + \frac{{{\partial ^2}{{\hat{u}}_1}}}{{\partial {y^2}}} - Re\; {u_0}\frac{{\partial {{\hat{u}}_1}}}{{\partial x}} - Re\; \frac{{\textrm{d}{u_0}}}{{\textrm{d}y}}{\hat{v}_1} = 0,\end{gather}
 \begin{gather}- \frac{{\partial {{\hat{p}}_1}}}{{\partial y}} + \frac{{{\partial ^2}{{\hat{v}}_1}}}{{\partial {x^2}}} + \frac{{{\partial ^2}{{\hat{v}}_1}}}{{\partial {y^2}}} - Re{u_0}\frac{{\partial {{\hat{v}}_1}}}{{\partial x}} = 0,\end{gather}
 \begin{gather}\frac{{\partial {{\hat{u}}_1}}}{{\partial x}} + \frac{{\partial {{\hat{v}}_1}}}{{\partial y}} = 0,\end{gather}
 \begin{gather}{\hat{u}_1}(1) = 0,\quad {\hat{u}_1}( - 1) = 0,\quad {\hat{v}_1}(1) = 0,\quad {\hat{v}_1}( - 1) = {\textstyle{1 \over 4}}R{e_L}({\textrm{e}^{\textrm{i}\alpha x}} + {\textrm{e}^{ - \textrm{i}\alpha x}}),\end{gather}
whose solution has the form
 \begin{gather}[{\hat{u}_1},{\hat{v}_1},{\hat{p}_1}](x,y) = [{\tilde{u}_1},{\tilde{v}_1},{\tilde{p}_1}](y)\,{\textrm{e}^{\textrm{i}\alpha x}} + [\tilde{u}_1^\ast ,\tilde{v}_1^\ast ,\tilde{p}_1^\ast ](y)\,{\textrm{e}^{ - \textrm{i}\alpha x}},\end{gather}
where stars denote complex conjugates. Substitution of (A6) into (A2)–(A5a–d) and elimination of  ${\tilde{u}_1}$ and
 ${\tilde{p}_1}$ result in the following problem:
 \begin{gather}[{({D^2} - {\alpha ^2})^2} - \textrm{i}\alpha Re{u_0}({D^2} - {\alpha ^2}) - \textrm{i}\alpha Re{D^2}{u_0}]{\tilde{v}_1} = 0,\end{gather}
 \begin{gather}{\tilde{v}_1}( - 1) = {\textstyle{1 \over 4}}R{e_L},\quad D{\tilde{v}_1}( - 1) = 0\quad {\tilde{v}_1}(1) = 0\quad D{\tilde{v}_1}(1) = 0,\end{gather}
where  $D = \textrm{d}/\textrm{d}y$. Problem (A7) and (A8a–d) has been solved numerically using Galerkin's method combined with Chebyshev expansion for
 ${\tilde{v}_1}$. The next order of approximation takes the following form:
 \begin{gather}- \frac{{\partial {{\hat{p}}_2}}}{{\partial x}} + \frac{{{\partial ^2}{{\hat{u}}_2}}}{{\partial {x^2}}} + \frac{{{\partial ^2}{{\hat{u}}_2}}}{{\partial {y^2}}} - Re\; {u_0}\frac{{\partial {{\hat{u}}_2}}}{{\partial x}} - Re\; \frac{{\textrm{d}{u_0}}}{{\textrm{d}y}}{\hat{v}_2} = {\hat{u}_1}\frac{{\partial {{\hat{u}}_1}}}{{\partial x}} + {\hat{v}_1}\frac{{\partial {{\hat{u}}_1}}}{{\partial y}},\end{gather}
 \begin{gather}- \frac{{\partial {{\hat{p}}_2}}}{{\partial y}} + \frac{{{\partial ^2}{{\hat{v}}_2}}}{{\partial {x^2}}} + \frac{{{\partial ^2}{{\hat{v}}_2}}}{{\partial {y^2}}} - Re\; {u_0}\frac{{\partial {{\hat{v}}_2}}}{{\partial x}} = {\hat{u}_1}\frac{{\partial {{\hat{v}}_1}}}{{\partial x}} + {\hat{v}_1}\frac{{\partial {{\hat{v}}_1}}}{{\partial y}},\end{gather}
 \begin{gather}\frac{{\partial {{\hat{u}}_2}}}{{\partial x}} + \frac{{\partial {{\hat{v}}_2}}}{{\partial y}} = 0,\end{gather}
 \begin{gather}{\hat{u}_2}(1) = 0,\quad {\hat{u}_2}( - 1) = 0,\quad {\hat{v}_2}(1) = 0,\quad {\hat{v}_2}( - 1) = 0.\end{gather}
Analysis of (A9)–(A12a–d) shows that its solution can be represented as
 \begin{gather}[{\hat{u}_2},{\hat{v}_2}](x,y) = [{\tilde{u}_{20}},{\tilde{v}_{20}}](y) + [{\tilde{u}_{22}},{\tilde{v}_{22}}](y)\,{\textrm{e}^{2\,\textrm{i}\alpha x}} + [\tilde{u}_{22}^\ast ,\tilde{v}_{22}^\ast ](y)\,{\textrm{e}^{ - 2\,\textrm{i}\alpha x}},\end{gather}
 \begin{gather}{\hat{p}_2}(x,y) = Ax + {\tilde{p}_{20}}(y) + {\tilde{p}_{22}}(y)\,{\textrm{e}^{2\,\textrm{i}\alpha x}} + \tilde{p}_{22}^\ast (y)\,{\textrm{e}^{ - 2\,\textrm{i}\alpha x}}.\end{gather}
Substitution of (A13) into (A9)–(A12a–d) and extraction of mode zero leads to the conclusion that  ${\tilde{v}_{20}} = 0$ and to the following equations for the remaining unknowns:
 \begin{gather}{D^2}{\tilde{u}_{20}} = A + f(y),\quad f(y) = {\tilde{v}_1}D\tilde{u}_1^\ast{+} \tilde{v}_1^\ast D{\tilde{u}_1},\end{gather}
 \begin{gather}{\tilde{u}_{20}}( - 1) = 0,\quad {\tilde{u}_{20}}(1) = 0,\quad \int_{ - 1}^1 {{{\tilde{u}}_{20}}\,\textrm{d}y} = 0,\end{gather}
 \begin{gather}D{\tilde{p}_{20}} = \textrm{i}\alpha ({\tilde{u}_1}\tilde{v}_1^\ast{-} \tilde{u}_1^\ast {\tilde{v}_1}).\end{gather}
Equation (A16) can be solved resulting in
 \begin{gather}{\tilde{p}_{20}} ={-} {\tilde{v}_1}\tilde{v}_1^\ast{+} C,\end{gather}
where C stands for an arbitrary constant. We are concerned only with solution of (A14a,b) and (A15a–c) as this determines the pressure gradient correction A. Double integration of (A14a,b) results in
 \begin{gather}{\tilde{u}_{20}} = \int_{ - 1}^y {\int_{ - 1}^y {f(\eta )\,\textrm{d}\eta \,\textrm{d}\gamma } } + A\frac{{{y^2}}}{2} + {C_1}y + {C_2},\end{gather}
where  ${C_1}$ and
 ${C_2}$ are the integration constants. Application of boundary conditions and the flow rate constraint lead to
 \begin{gather}A =
\tfrac{3}{2}\left[ {\int_{ - 1}^1 {\int_{ - 1}^y {\int_{ -
1}^y {f(\eta )\,\textrm{d}\eta \,\textrm{d}\gamma
\,\textrm{d}y} } } - \int_{ - 1}^1 {\int_{ - 1}^y {f(\eta
)\,\textrm{d}\eta \,\textrm{d}y} } }
\right],\end{gather}
 \begin{gather}{C_1}
={-} \tfrac{1}{2}\int_{ - 1}^1 {\int_{ - 1}^y {f(\eta
)\,\textrm{d}\eta \,\textrm{d}y} } ,\quad {C_2} ={-}
\tfrac{1}{2}\int_{ - 1}^1 {\int_{ - 1}^y {f(\eta
)\,\textrm{d}\eta \,\textrm{d}y} } -
\tfrac{1}{2}A.\end{gather}
If one defines ε as α −1, the above analysis shows that  $A = 0({\alpha ^{ - 2}})$ for
 $\alpha \to \infty $. It also shows that
 $A = 0(Re_L^2)$.



