Introduction
Recently, the interest in Unmanned Aircraft Systems (UAS) has increased, in particular their applications in precision agriculture. Both the cost and complexity of the systems have been reduced to the point where an individual can acquire a system and use it for production agriculture. Other benefits associated with UAS, as compared to larger manned aircraft or satellites, are rapid data collection coupled with high spatial resolution and a fast turnaround time (Berni et al., Reference Berni, Zarco-Tejada, Suárez, González-Ugo and Fereres2009). The ability to remotely detect field variability and relate it to plant disease could allow farmers to react to developing disease situations in a timely manner. Using precision crop management could therefore reduce potential yield loss to plant diseases and make more efficient use of input costs while also providing environmental protection through a potential reduction in pesticide usage (Moran et al., Reference Moran, Inoue and Barnes1997).
Since the 1970s research has shown that the use of remote sensed imagery can be utilized as a management tool in soybean production. Cui et al. (Reference Cui, Zhang, Li, Zhao and Hartman2009) demonstrated that multi-spectral imagery reflectance values do vary with increasing intensities of soybean rust (Phakopsora pachyrhizi). Additionally, they reported that it was the reflectance values of the Near-Infrared (NIR) band, in particular, that demonstrated a strong correlation with rust severity. By normalizing multi-spectral MSP imagery by using the NIR and Red bands, and generating a Normalized Difference Vegetation Index (NDVI), it becomes possible to measure green biomass, or plant greenness, and therefore map variability (Rouse et al., Reference Rouse, Haas, Schell and Deering1973). Jayroe et al. (Reference Jayroe, Baker and Greenwalt2005) showed that a correlation existed between yield data and NDVI imagery and concluded that by scheduling imagery collection throughout the growing season, it may be possible to adjust management decisions for factors that limit yield. However, Gitelson and Merzlyak (Reference Gitelson and Merzlyak1994) found that the application of NDVI does not perform well on leaves with high chlorophyll content or in areas with a high leaf area index. They suggested generating a normalized difference index using red edge (NDRE), the region between 705 and 750 nm for these applications.
There are many diseases that negatively affect soybean production in the United States, among them are soybean rust, Cercospora leaf blight (Cercospora kikuchii) and charcoal rot (Macrophomina phaseolina). Soybean rust is a major disease of soybeans in the United States and is considered one of the most destructive diseases of soybeans worldwide (Sikora et al., Reference Sikora, Allen, Wise, Bergstrom, Bradley and Bond2014). Soybean rust is a fungal disease that causes lesions to form on the lower leaves of infected plants with symptoms gradually moving up the plant canopy (Cui et al., Reference Cui, Zhang, Li, Zhao and Hartman2009). Soybean rust can cause leaf yellowing, premature defoliation and reduced yields. Yield reductions of over 50% have been reported in the USA (Sikora and Delaney, Reference Sikora and Delaney2016). Likewise, charcoal rot, a soil borne fungal disease of soybeans affects the root and stem of infected plants, reducing the water uptake capacity resulting in leaf discoloration (yellowing) and premature death (Smith et al., Reference Smith, Chilvers, Dorrance, Hughes, Mueller, Niblack and Wise2014). With both diseases, foliar discoloration occurs at some point during disease development indicating that detection by remote MSP should be possible.
In this preliminary study, the applicability of a small UAS outfitted with a lightweight MSP sensor was examined to determine if detecting soybean diseases early in the season is possible in order to make informed management decisions.
Materials and Methods
Experimental Setup
The experiments were conducted at the E. V. Smith Research Center near Tallassee, Alabama (USA). The two fields selected were both maintained under center-pivot irrigation. Experiment 1 was approximately 50 hectares in size while Experiment 2 covered approximately 5 hectares. Both fields were planted with soybeans, Pioneer P76T54R2, with each having a unique fungicide experiment consisting of two fungicide treatments and an untreated check, replicated three times in a randomized complete block design. Treatments 1 and 2 in Experiment 1 were sprayed with the fungicide Priaxor™ (active ingredients fluxapyroxad and pyraclostrobin) at 585 ml/ha, applied in two different methods. The fungicide was applied through the center-pivot irrigation in the form of chemigation for treatment 1, while treatment 2 was applied with a high clearance agricultural sprayer. The treatments were applied at the R3 (15 July) and R5 (28 July) growth stages. In Experiment 2, two different fungicides were applied using a conventional high clearance agricultural sprayer with Treatment 1 being 585 ml/ha of Priaxor and Treatment 2 being 1023 ml/ha of Quadris Top® SB (active ingredients azoxystrobin and difenoconazole). The treatments were only applied once at the R3 growth stage on 26 August.
UAS Flights, Equipment, and Image Processing
UAS flights were conducted every two weeks starting at the time of planting and continuing through crop maturity for Experiment 1. During each aerial data collection, a UAV (Sensefly eBee Ag) with a 1.2 MP MSP camera (Parrot Sequoia™) was flown. The multi-spectral camera collected images in the green (550 nm), red (660 nm), red-edge (735 nm), and NIR (790 nm) part of the light spectrum. The UAV was programmed for autonomous flight (Sensefly Emotion2), and the same flight plan was followed for each data collection. For Experiment 2, the same data collection procedure was followed except that the UAS data collection did not commence until the end of September and was repeated on a weekly basis. Due to the size of the fields, flight altitudes were adjusted allowing for the entire field to be imaged in a single flight. Experiment 1 was flown at 120 meters above ground level generating an 11.4 cm/pixel image, and Experiment 2 flown at 90 meters above ground level, which generated an 8.5 cm/pixel image. Prior to each flight an image was taken with the Sequoia camera of a radiometric target with known albedo values to aide in image calibration. Also, to reduce geospatial errors, six ground control targets, measuring 0.6 by 0.6 meters were installed and their position surveyed with a Trimble Geo7x GPS allowing for geospatial correction during image processing. During flight each UAS collected still images that were downloaded and stitched together with Pix4D Mapper (Pix4D Mapper Pro v2.2). At the time of processing, the ground control points and radiometric calibration values were utilized for image correction through Pix4D Mapper. The images were used to generate NDVI and NDRE (Equation 1) orthomosaics.
 $$NDRE\, {\equals}\, {{(R790{\minus}R735)} \over {(R790{\plus}R735)}}$$
Crop Scouting and Harvest
Test fields were monitored biweekly beginning at the R3 growth stage and continuing through crop maturity. A traditional visual approach was used to identify specific diseases and to rate for disease severity. Experiments 1 and 2 were harvested using a John Deere combine outfitted with an Ag Leader Insight yield monitor. Experiment 1 was harvested on 18 October and Experiment 2 on 7 November. Yield data and UAS imagery were analyzed using Zonal Statistics within ArcMap (ArcGIS v10.3) along with Microsoft Excel (Microsoft Office 2016).
Results
Experiment 1
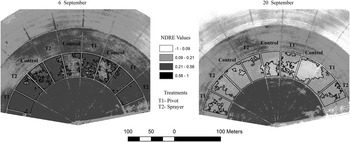
The UAS flights were occurring every two weeks beginning at planting; however, it was not until later in the growing season that variability in the soybean crop was noticed. Field scouting was initiated on 9 August, but there was visible disease damage and the NDVI and NDRE imagery collected three days later did not display any noticeable variability. The second scouting event occurred on 18 August and tap-root decline, a disease of unknown etiology, was observed, however symptoms were vague and scattered. The NDVI and NDRE imagery collected on 23 August did not indicate variability and the scattered symptoms of tap-root decline were not discernable in the imagery. On 6 September the field was scouted primarily for Cercospora leaf blight, but disease severity was negligible. Leaf discoloration was apparent on some plants, but the cause of the yellowing could not be confirmed at that time. On the same day, UAS imagery was collected with NDVI and NDRE indices being generated. Variability was not evident in the NDVI imagery but patterns were visible with NDRE imagery. To highlight these patterns, zones were generated based on NDRE reflectance values and areas of interest, potentially diseased plants, had an average NDRE value of 0.144, while areas with greener plants had values of 0.226. Scouting and UAS imagery was conducted on 20 September and areas of interest observed on 6 September were determined to be affected by charcoal rot. While some variability was detected in the NDVI imagery, the variability of charcoal rot distribution was more evident in the NDRE imagery. Once again, three zones were generated from equally spaced NDRE reflectance values that also followed the patterns observed in the field: areas with widespread defoliation had average NDRE values of 0.08; areas with patchy defoliation and some browning had average NDRE values of 0.104; and areas that were seemingly unaffected with average NDRE values of 0.143. Figure 1 illustrates the zones generated during the 6 September and 20 September flights and may be partially explained as the development of symptoms of charcoal rot. The final scouting and UAS flight occurred on 1 October and 6 October, respectively. At this point the fields were defoliated and ready for harvest, so no discernable differences were observed.
Charcoal rot, shown in lighter colored zones, delineated in Experiment 1 to demonstrate the development from 6 September to 20 September.

Harvest occurred on 18 October and yield averages for the treatments were calculated. The average for each treatment was 3,292 kg/ha with no significant differences noted in yield among treatments. No correlation could be made using the zones generated from the NDRE imagery between areas impacted by charcoal rot and yield.
Experiment 2
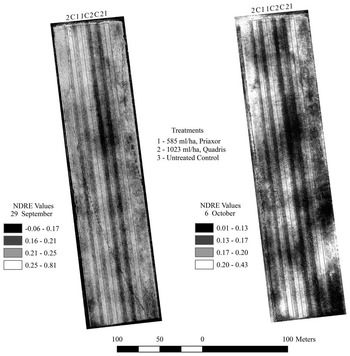
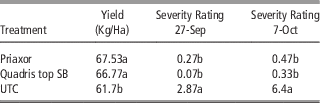
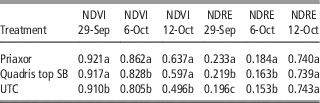
Experiment 2 was planted on 7 June and scouted initially on 27 September with a subsequent UAS flight on 29 September. Soybean rust was observed during the first scouting event in the mid-canopy of the untreated check plots, but was detected only in very low levels in the fungicide-treated plots. Both NDVI and NDRE indices were generated from the 29 September imagery and in both cases significant differences were identified between the untreated check and the fungicide-treated plots. While there was a discernable difference in the NDVI imagery, the visible difference in the NDRE imagery was most distinct. On 6 October UAS imagery was collected and the same process repeated. For the NDVI and NDRE imagery generated it was clear that soybean rust was widespread in the untreated plots while only at relatively low levels in the fungicide treated plots. Rust severity, rated on an 8-point scale, in the untreated check plots ranged from 2–3 and 5–6 on 27 September and 7 October, respectively, while it consistently remained below 1 for the fungicide treated plots (Table 1). The final UAS flight was conducted on 12 October and NDVI imagery did show significant differences in reflectance values between the two fungicide-treated plots and the untreated check. This was not observed in the NDRE reflectance values (Table 2 and Figure 2).
Symptoms of soybean rust appearing as dark strips on untreated plots and becoming more established from the 29 September to 6 October.

Yield values and soybean rust severity ratings (on an 8-pt scale) with respect to treatments. Significant differences (Least Significant differences for p<0.10) indicated by different letters within the column

Average NDVI and NDRE values with respect to treatments. Significant differences (Least Significant differences for p<0.10) indicated by different letters within the column

As opposed to the results in Experiment 1, Experiment 2 had significant differences in yield between the fungicide-treated and untreated plots (Table 1). Soybean rust reduced yield by approximately 8% in the unsprayed control treatment. For the orthomosaic’s comprising all three collection dates and both reflectance indices (NDVI and NDRE), zones were generated by separating reflectance values equally across their respective ranges. Average yields for each zone were calculated and plotted against one another to determine if there was a correlation between reflectance values and yield. For the six reflectance orthomosaics generated, NDVI and NDRE on 29 September, 6 October, and 12 October all had correlations with R² above 0.87 with the exceptions of NDVI on 29 September and NDRE on 12 October which were both below 0.33.
Discussion
Experiment 1
Weather conditions during the growing season were characterized by above average temperatures beginning in early June, and a severe drought starting in August. The hot, dry conditions were favorable for the development of charcoal rot, which was observed in Experiment 1 and detected in the NDRE imagery of 20 September. The differences in imagery on 6 September may have detected plant stress due to these unfavorable weather conditions as well as the beginning of charcoal rot, though symptoms of the disease were not yet identified during field scouting. The fact that the charcoal rot did not negatively impact yield may have been a result of the severe drought conditions which likely impacted yield over the entire field. As was observed here, charcoal rot can be observed over wide areas of an infested field near the end of the growing season when weather conditions are favorable for disease development and when implementation of a remedial control strategy is too late. However, Reynolds et al. (Reference Reynolds, Windels, MacRae and Laguette2012), while working with sugar beets, suggested that using remote sensing to map the distribution of the disease in a field would still be beneficial, particularly in large fields where ground scouting may not be practical, by allowing farmers to develop and implement management plans to reduce the potential of spread within a field or across a farm. Following this suggestion for soybeans would be a beneficial way to utilize UAS imagery at the field scale when the disease is detected too late, or a treatment is not available.
Experiment 2
Results indicate that the field used for Experiment 2 was exposed to soybean rust in late August or early September 2016. This resulted in significant differences in soybean rust severity and yield between the untreated control and the fungicide treated plots. Soybean rust damage was also visible in the MSP imagery, both in the NDVI and NDRE orthomosaics. This suggests that soybean growers could possibly use UAS to detect soybean rust early in the growing season, at a point where a late season application of a curative fungicide may be used to reduce potential yield loss from this disease. This could be significant to soybean producers in the southeastern USA and in other areas in the world where soybean rust is an economic problem. The use of UAS to detect soybean rust may be a more economically feasible method to scout for the disease in areas where ground-based scouting is expensive and may be unfeasible long term (Sikora and Delaney, Reference Sikora and Delaney2016).
Conclusion
This study demonstrated that UAS, used with a multi-spectral camera, could be used to detect disease in soybeans, and possibly supplement in-field scouting for soybean rust. While appearing uniquely different, in our study, both charcoal rot and soybean rust were detected. Disease detection was conducted by assessing variability and identifying either irregular patterns, or patterns that followed the treatments in the study. While much of the variability detected was due to disease, some of the variability could be attributed to rapid crop maturity as a result of the unusually hot, dry weather experienced during the growing season. While UAS is an excellent tool for generating vegetative indices to determine field variability, having a working knowledge of the field, weather patterns, crop stages and management practices is critical for understanding the observed variability. Finally, it is the combination of variability analysis, along with field scouting, that allow the patterns observed in the imagery to be identified as an area affected by disease as well as diagnose what disease it may be.
Acknowledgements
This study was funded by the Alabama Farmers Federation Soybean Division and the Auburn University College of Agriculture.