1. Introduction
General insurance reserving has for some time been based on a handful of heuristic methods. Chief among these methods has been the chain-ladder method (CL) which has proved to be surprisingly accurate. This method has been built on the premise that past patterns of insurance losses are strong predictors of future insurance losses. This is not an unreasonable assumption if insurance losses follow some underlying probability distribution. As discussed in this paper, we now understand that the CL method is effective because the CL development factors are maximum likelihood estimator (MLE) for the “true” development factors if one assumes the underlying distribution of the losses belong to an exponential dispersion family (EDF) (Taylor, Reference Taylor2015). More recently, advances in computing and statistical methods have introduced sophisticated techniques such as stochastic modelling and now statistical machine learning. These methods theoretically allow actuaries to perform more detailed projections and analysis of insurance losses across a broad spectrum of loss profiles. Machine learning methods and more specifically neural networks and deep learning have been shown to be effective in predicting losses for which granular data of the insured exists (Wüthrich Reference Wüthrich2018a,Reference Wüthrichb).
A natural gap has emerged for powerful machine learning techniques that use data that are not as personalised and granular as that used in neural network methodsFootnote 1 but that is more effective than the tried and tested CL method. Furthermore, the complexity, computational power required, and “black-box” nature of certain deep learning and neural network methods make these methods impractical from a practitioners perspectiveFootnote 2.
This paper explores support vector regression (SVR); a simpler, more accessible method that produces strong results with more flexibility than the CL method. The particular algorithm derived in this paper is suitable for data that would ordinarily appear in a loss triangle. Although the implementation explored is based on annual data, the method is theoretically applicable to higher frequency data (weekly, monthly and so on) as it is based on learning the underlying loss patterns based on an assumption about the statistical distribution of the data. We begin the paper in section 2 by defining notation and providing a background to loss triangles and the CL method. Section 3 discusses machine learning in a loss estimation context and justifies our chosen learning algorithm. In section 3.3, we explain the mathematics behind the SVR method, derive a bespoke kernel function designed to preserve the statistical features of the loss data and analyse the features of this new kernel function. Section 3.4 explains how the SVR parameters are identified and optimised. Finally, in section 4, we show an implementation of the method applied to homogeneous insurance loss data from three insurersFootnote 3. We analyse the results and compare the performance of the kernel function derived to results produced by the radial basis function (RBF; widely used kernel function for SVR) and the CL method. We discuss implications for actuaries.
We hope to provide a fully derived, practical, flexible implementation that can be immediately applied to insurance data without the requirement for computational power, granular or personalised loss information or a deep knowledge of sophisticated statistical machine learning methods.
2. Background
2.1 Insurance loss triangle
General insurance claims data are commonly recorded on a loss triangle which can be described as an upper  $n \times m$ matrix with entries
 $ c_{ij}=\sum_{k=1}^{j} x_{ik}$, where
 $x_{ij}$ is an incremental claim, the accident year i is the year in which the claim occurred and the insurer is notified of the claim in some development year j. We take for granted the usual actuarial assumptions around loss triangles, that is, each
 $x_{ij}$ is assumed to be independent of all other claims and there exists an ultimate development year n such that
 $ c_{ij}=c_{in}, \forall j > n$.
2.2 CL method
The CL method is a widely applied method for estimating insurance losses that relies on past data to predict the amounts of future claims. Development factors  $f_{j}$ are defined so as to produce a Markov chain in the cumulative claim amounts. The
 $f_{j}$ are assumed to be independent of the accident year i and assuming an ultimate development year n then
 $f_{j} \rightarrow 1$ as
 $j\rightarrow n$. The development factors are related to the expected cumulative loss as per Definition 2.1. For clarity of notation, we will distinguish the incremental and cumulative loss outcomes
 $x_{ij}$ and
 $c_{ij}$ from the random variables representing the incremental losses and cumulative losses
 $X_{ij}$ and
 $C_{ij}$.
Definition 2.1.  $E[C_{(i,j+1)}|c_{(i,1)},c_{(i,2)},...c_{ij}]=E[C_{(i,j+1)}|c_{ij}]=c_{ij}.f_{j}.$
Loss triangles are used to estimate development factors, and we will assume the usual method for doing this by taking a weighted average of the individual development factors  $c_{(i,j+1)}/c_{ij}$. This produces the widely used unbiased estimator
 $\bar{f_{j}}$ given by,
 \begin{equation}\bar{f_{j}}=\frac{\sum_{i=1}^{n-j} c_{(i,j+1)}}{\sum_{i=1}^{n-j} c_{ij}}\end{equation}
We apply these assumptions to estimate the ultimate claim amounts for the insurance risk in accident year i using the usual CL method formula,
 \begin{equation}\bar{c}_{(i,n)}=c_{(i,n-i-1)}\prod_{j=n-i-1}^{n-1}\bar{f_{j}}\end{equation}
The claims reserve is defined in the usual way as the difference between the total paid and notified claims to date and the ultimate loss. We denote the claims reserve for accident year i as $R_{i}$.
The total claims reserve estimate  $\bar{R}_{i}$ is then given by the expression,
 \begin{equation}\bar{R}_{i}=\bar{c}_{in}-c_{(i,n-i-1)}\end{equation}
We can quantify the level of uncertainty in the reserve estimate using the mean quadratic error (MQE) (Murphy, Reference Murphy2007). We apply the root mean squared error (RMSE= $\sqrt{\text{MQE}}$) as our measure of uncertainty in our estimate with the MQE defined as in Mack (Reference Mack1993).
2.3 CL, EDFs and generalised linear models
The CL method has been applied by actuaries over the last century, but it has only been recently that we have unpacked the statistical framework underlying the method. Recent work performed by Taylor (Reference Taylor2015) has shown that the CL development factors  $\bar{f}_{j}$ from (1) are MLEs for development factors from EDFs. That is, if one assumes
 $X_{ij}$ is distributed according to a parametric distribution model with probability density function given by the equation,
 \begin{equation}g(x;\ \theta,\varphi)=\exp\left({\frac{x\theta - b(\theta)}{a(\varphi)}+c(x,\varphi)}\right)\end{equation}
then  $\bar{f}_{j}$ is an unbiased estimator of the underlying
 ${f}_{j}$ implied by the EDFFootnote 4
In addition, Taylor also proved that  $\bar{f}_{j}$ are minimum variance unbiased estimators (MVUE) for
 $f_{j}$. This is quite remarkable given the CL method was based purely on an informal method of guessing the claims development. This gives some insight into why the method has been fairly reliable, especially for large data sets. If one assumes that the underlying claims follow some EDF then the CL method applies MLE and MVUE of an EDF to predict claims. The larger the data set, the more reliable the prediction. We will make use of this insight in developing a machine learning approach to claims prediction.
England and Verrall have shown in England & Verrall (Reference England and Verrall2002) that if one assumes  $X_{ij} \sim EDF (\theta_{ij}, \varphi_{ij})$ and
 $X_{ij}$ are independent then if we define parameters
 $\alpha_{i}>0$,
 $\beta_{j}>0$ so that
 $E[X_{ij}] = \alpha_{i}\beta_{j}$; then MLEs
 $\bar{\alpha}_{i}$ and
 $\bar{\beta}_{j}$ derived from a loss triangle produce identical estimates for
 $c_{(i,n)}$ as those given by the CL method. In this way, it is possible to show that there is a direct relationship between the CL method and EDFs. We make use of this insight to derive and test our machine learning methodology. For readers interested in the relationship between EDFs and the CL method, please see England & Verrall (Reference England and Verrall2002) for further details and derivations.
3. Machine Learning Loss Triangles
Machine learning has found wide applications in finance. This covers a broad range of machine learning techniques and applications. In the insurance sector, machine learning techniques are still in their infancy and most efforts have been focused around applying machine learning methods to improve the customer experience. Academic work on machine learning for insurance loss estimation has focused on application of neural networks and deep learning with some promising results. Look, for example, at the work done by Wüthrich (Reference Wüthrich2018a,Reference Wüthrichb), Lowe & Pryor (Reference Lowe and Pryor1996), Kuo (Reference Kuo2019) and Yunos et al. (Reference Yunos, Ali, Shamsuddin and Noriszura2016). The common thread linking these pieces of work is the deep learning approach adopted. This has been shown to have some benefits, for example, the ability to use data points specific to individuals to determine the likelihood of a claim being made and the claim amount. However, one of the major disadvantages of applying deep learning to the insurance loss estimation problem is the computational cost and complexity of using such a model. One could argue that the additional benefit derived from using these techniques may not be commensurate with the depth of understanding and computational power required. This is particularly relevant if these techniques are applied to thousands of data points, as would be the case with insurance claims. Actuaries using these methods would also have to consider their obligation to explain loss prediction methods and results with C-suite executives, regulators, peer reviewers and auditors. The nascent and somewhat “black-box” nature of some of these techniques makes them difficult to justify from a practitioners perspective. Given the success of neural networks in predicting insurance losses, other less opaque machine learning techniques may prove equally useful in this context. A method that we believe is suited to this task is SVR. This method is well suited to insurance loss estimation because SVR makes use of the structure of the data to identify patterns that may exist in the data and perform predictions based on these patterns. In addition to this, the mathematical framework underlying SVR shares some commonality with current actuarial techniques such as generalised linear models. This makes the technique more accessible to actuaries, and it allows us to develop the mathematical theory specifically applied to an actuarial problem. This helps overcome the auditability of a machine learning model by external parties. A detailed description of SVR can be found in Vapnik and Cortes (Reference Vapnik and Cortes1995).
It is our contention that encoded in a loss triangle is an n-dimensional loss pattern. This is implied by the success of the CL method in predicting insurance losses. Assuming this to be the case, performing a regression on the loss triangle data should result in a good estimate of future insurance losses. We would like our machine learning method to incorporate features we have discussed in section 2.3, specifically, the underlying EDF structure of the claims process as implied by the success of the CL method in predicting loss development. As a first step, we shall henceforth make the following assumption.
Assumption 3.1. Incremental claims are modelled by a random variable X derived from an  $EDF(\theta, \varphi:\ a, b, c)$.
A commonly applied distribution applied to model attritional insurance claims is the Gamma distribution as it is flexible enough to allow for a range of pdf shapes and it is a member of the EDFFootnote 5. This allows us to make the following assumption.
Assumption 3.2. The incremental claims X belong to a Gamma distribution with parameters  $\alpha$,
 $\lambda >0$;
 $X \sim \Gamma(\alpha,\lambda).$
We note that by making Assumption 3.2 we imply Assumption 3.1 since a Gamma distribution is a subset of the wider EDF. For most claims modelling exercises that use aggregated loss data a reasonable assumptionFootnote 6 is that  $x_{ij}<x_{ik}$ for
 $k>j$. This implies an exponentially decreasing pdf. Therefore for the Gamma distribution implied by our data (and most attritional claims triangles), we would expect to have
 $\alpha \leq 1$.
3.1 Claims notification pattern in general insurance
Claims notified to an insurer over the same calendar period are recorded in the loss triangle in diagonals running from the top-right corner to the bottom-left corner. That is, entries  $x_{ij}$ where
 $i+j=z, z\in \mathbb{Z}^{+}$ consist of claims notified to the insurer over the same calendar period.
We argue, qualitatively, that the claims development pattern across these “z’’ diagonals is a better predictor than the pattern implied by the CL development years. We base our argument on the rationale that the “z’’ diagonals carry the same information in terms of economic and demographic features driving the claims notification. This will have an impact on whether claims are made, when they are made and the claim amounts.
An additional feature of the claims process that we would like to capture is the relationship between claims made in the same development year but different calendar periods (claims along columns of the loss triangle). This information is captured by grouping claims into development years as is done with the CL method.
Capturing both these features can be very difficult using heuristic methods such as the CL method. However, SVR is well suited to learning complex non-linear patterns.
3.2 Loss triangle learning algorithm
Ideally, we would like our machine learning algorithm to capture the map:
 \begin{equation}Z\,{:}\,(c_{(i-1,j)},c_{(i,j-1)})\longmapsto c_{ij} \text{ where }i+j=z \in \mathbb{I}^{+}\end{equation}
We can apply SVR to a loss triangle to learn the mapping Z and project that forward to the missing entries of the loss matrix. This allows us to learn the non-linear pattern encoded in the loss triangle and the z diagonals. This may be achieved by slightly adapting our mapping in (5) to:
Definition 3.1.  $\hat{Z}\,:\,(c_{ij},x_{(i,j+1)},x_{(i+1,j)})\longmapsto c_{(i+1,j+1)}$
This mapping has the advantage of capturing the features discussed in section 3.1. We employ the domain of the map  $\hat{Z}$ as our learning data and its range as our target data for the upper triangle in the loss matrix. We then use three entries to predict the entry
 $c_{(i+1,j+1)}$ that belongs to diagonal
 $z+2$:
 $c_{ij}$, from diagonal $z = i+j$;
- $x_{(i,j+1)}$, from diagonal $z+1$;
- $x_{(i+1,j)}$, from diagonal $z+1$.


In this way, we predict all the entries for diagonal  $z+2$. These are then used alongside the entries in diagonal
 $z+1$ to predict the entries in
 $z+3$ and so on until the triangle is completed. The prediction process follows the pattern:
-
diagonals z and
$z+1$ predict $z+2$; -
diagonals
$z+1$ and $z+2$ predict $z+3$ …; -
diagonals
$z+k$ and $z+k+1$ predict $z+k+2$.


This algorithm is illustrated in Figure 1 below as applied to a simple  $4 \times 4$ loss matrix. The blue arrows represent the domain of the map
 $\hat{Z}$ vector as in Definition 3.1, and the green arrows point to the target learning data. The red arrows point to the empty entries to be predicted. The algorithm makes predictions along the diagonals running from top right to bottom left and uses the new entries predicted to complete the next diagonal until the loss matrix is completed. The sequence of predictions would follow the indexing of the
 $\text{predict}_{(m)}$ in Figure 1.
Learning and prediction algorithm.

To reduce overfitting that may result from using the same loss triangle for learning and prediction, we use loss triangles from years  $t-1$ and
 $t-2$ to learn the patterns that are relied upon to complete loss triangle for year t. We note with interest that each development and accident year projection is based on the previous z diagonal which results in a tension that holds the entire framework together. Changes in one point would eventually flow through to the other points resulting in a framework that can be used to investigate an evolution in the distributional features of the claims process. For example, if changes in consumer behaviour result in a change in
 $\alpha$, one can investigate what that might mean for the entire loss development process across development and accident years using the SVR framework described.
3.3 SVR for claims modelling
We set out in this section a high-level description of the SVR technique applied in this problem. We begin by briefly describing the intuition behind the SVR methodFootnote 7. The rationale underlying our SVR application is that it may be difficult to identify a useful pattern or regression that can be used to predict the development of a series in a lower dimensional space, especially where the regression in the lower dimensional space is non-linear. In our case, the lower dimensional spaces consist of compact subsets of  $\mathbb{R}^{3}$ and
 $\mathbb{R}$ as implied by our
 $\hat{Z}$ map. This problem may be solved by transforming the lower dimensional space and our map
 $\hat{Z}$ into a higher dimensional space and corresponding map, if, we can identify a hyperplane in the higher dimensional space that performs a useful regression. We can then transform the results of the higher dimensional regression back into the lower dimensional space. Thus, the regression performed in the higher dimensional space may be linear in that space but non-linear once transformed back to the lower dimensional space. This is a very powerful technique provided that the transformations and regression can be performed in a practical manner and a useful hyperplane can be identified.
We now apply the rationale above to our problem. Let  $G =(\hat{x}_{ij},c_{(i+1,j+1)})$ be our training set from a loss triangle. Let the vector
 $\hat{x}_{ij}=(c_{ij},f_{ij},d_{ij})$, and
 $i+j=z$ define the respective z diagonals where
 $z \in [2,n+1]$ for the ultimate development year n.
- $f_{ij}=c_{(i,j+1)}/c_{ij}$; we shall refer to this as the general development factor, not to be confused with the CL development factor $f_{j}$ as in Definition 2.1.
- $d_{ij}=c_{(i+1,j)}/c_{ij}$.


We introduce the factors  $f_{ij}$ and
 $d_{ij}$ as substitutes for the entries
 $x_{(i,j+1)}$ and
 $x_{(i+1,j)}$ in Definition 3.1. The factors
 $f_{ij}$ and
 $d_{ij}$ capture the development along development years (j) and accident years (i), respectively. Structuring the SVR in this way allows us to model the changes in the series
 $c_{ij}$, while minimising the impact of the differences between relative sizes of
 $c_{ij}$ compared to
 $x_{ij}$. These differences become material as
 $j \rightarrow n$ due to the difference in scaling in earlier development years j (when
 $c_{ij} \approx x_{ij}$) compared to later years (when
 $c_{ij} \not \approx x_{ij}$). This scaling issue will have an impact on the SVR performance as the SVR fits not only the underlying pattern in the data but also the differences in scaling of the vector constituents. Using ratios provides consistent scaling as
 $j \rightarrow n$.
In our case, the SVR method attempts to learn the loss pattern implied by our  $\hat{Z}$ map and achieves this by mapping the vectors
 $\hat{x}=\{\hat{x}_{ij}\}$ for
 $i+j=z \in [2,n+1]$, to a higher dimensional Hilbert space
 $\mathcal{H} \subseteq \mathbb{R}^{m}$, as described in the beginning of this section, where
 $m=\sum_{k=0}^{n-1}(n-k)=\frac{n(n-1)}{2}$. The Hilbert space
 $\mathcal{H}$ is known as the feature spac, and the transformation into
 $\mathcal{H}$ is done via some non-linear function
 $\phi\,:\,\mathbb{R}^{3} \to \mathcal{H}$. As described later in this paper and in Vapnik and Cortes (Reference Vapnik and Cortes1995), the exact form of the transformation function
 $\phi$ is not required due to the so-called kernel trick, and for now it is only worth keeping in mind that the function
 $\phi$ is directly related to some feature space
 $\mathcal{H}$ for which we try to identify a suitable regression hyperplane for our map
 $\hat{Z}$. We define a prediction function h that acts as an approximation for the true form of the higher dimensional transformation of the map
 $\hat{Z}$. In order to relate our prediction function h to hyperplanes in
 $\mathcal{H}$; we define our prediction function in the following terms:
 \begin{equation}h(\hat{x}_{ij})=\langle \phi(\hat{x}_{ij}),w\rangle_{\mathcal{H}}+b\end{equation}
where  $w\in \mathcal{H}, b\in \mathbb{R}$ and
 $\langle\cdot \cdot \cdot \rangle_{\mathcal{H}}$ is an inner product in
 $\mathcal{H}$. We note that (6) is the equation of a hyperplane perpendicular to w. Our task now becomes identifying an optimal vector
 $w \in \mathcal{H}$ and value
 $b \in \mathbb{R}$ that results in the best regression for our map
 $\hat{Z}$ (i.e., find a hyperplane of best fit), and we do this by maximising the distance between any known
 $c_{(i+1,j+1)}$ and the hyperplane. It is easy to show that the distance between a point
 $c_{(i+1,j+1)}$ and the hyperplane is given by the formula
 \begin{equation}D_{ij}=\frac{c_{(i+1,j+1)}(\langle \phi( \hat{x}_{ij}),w \rangle_{\mathcal{H}}+b)}{\langle w,w \rangle_{\mathcal{H}}}\end{equation}
This is maximised by minimising  $\langle w, w \rangle_{\mathcal{H}}$. The SVR method also defines a margin
 $\epsilon>0$ that controls how strict this maximisation is performed. This is applied through the constraint
 $|c_{(i+1,j+1)} - h(\hat{x}_{ij})|\leq {\epsilon}, \forall i,j$ s.t
 $ i+j=z$ and is optimised so that the balance between accuracy of prediction and overfitting is acceptable.
There may be no hyperplane that fits the conditions and constraints provided to the SVR machine so we introduce variables  $\eta_{ij}$ and
 $\bar{\eta}_{ij}$ to allow regression errors in the fitting. We capture all these features by setting up the following as the minimisation problem. Minimise the functional below relative to w and b:
 \begin{equation}C.\sum_{j}\sum_{i} (\eta_{ij}+\bar{\eta}_{ij}) + \frac{1}{2}\langle w,w \rangle_{\mathcal{H}} \text{ for } i+j=z \in[2,n+1]\end{equation}
 \begin{equation*} \text{where }C \in \mathbb{R} \text{ and subject to } \eta_{ij}, \bar{\eta}_{ij} \geq 0\end{equation*}
 \begin{equation*}[h(\hat{x}_{ij})- c_{(i+1,j+1)}]-\epsilon \leq \eta_{ij}\end{equation*}
 \begin{equation*}[c_{(i+1,j+1)} - h(\hat{x}_{ij})]-\epsilon \leq \bar{\eta}_{ij}\end{equation*}
C is a constant that penalises the regression errors in the minimisation (i.e., allowing us to ignore regression errors or otherwise).
We use Lagrangian multipliers to identify an optimal solution to the problem. We consider the dual problem and introduce a Lagrangian L
 \begin{equation*}L=\sum_{j} \sum_{i} l_{ij}([h(\hat{x}_{ij})- c_{(i+1,j+1)}]-\epsilon + \eta_{ij}) +\sum_{j}\sum_{i} \bar{l}_{ij}([c_{(i+1,j+1)} - h(\hat{x}_{ij})]-\epsilon + \bar{\eta}_{ij})\end{equation*}
 \begin{equation*}-\left[C.\sum_{j}\sum_{i}(\eta_{ij}+\bar{\eta}_{ij}) + \frac{1}{2}\langle w,w \rangle_{\mathcal{H}}\right] \text{ for } i+j=z \in[2,n+1]\end{equation*}
Taking partial derivatives of b and w in the Lagrangian and equating to 0 and applying the conditions in (8), we are left with the following equation that we look to maximise in the Lagrangian multipliers:
 \begin{equation}L = \sum_{j}\sum_{i} (\bar{l}_{ij}-l_{ij})c_{(i+1,j+1)}-\epsilon(l_{ij}+\bar{l}_{ij})-\frac{1}{2}\sum_{j}\sum_{i}\sum_{t}\sum_{s}(\bar{l}_{ij}-l_{ij})(\bar{l}_{st}-l_{st})\langle\phi(\hat{x}_{ij}),\phi(\hat{x}_{st})\rangle_{\mathcal{H}}\end{equation}
where the indices s,t for which  $s+t=z\in[2,n+1]$ are introduced to keep track of the permutations in the indexing within the final term. From the partial derivatives and conditions in (8);
 $l_{ij}\eta_{ij}-C.\eta_{ij} \leq 0$ and
 $\bar{l}_{ij}\bar{\eta}_{ij}-C.\bar{\eta}_{ij} \leq 0$ implies
 $0 \leq l_{ij}, \bar{l}_{ij} \leq C$. Also from the partial derivative of L with respect to b we get
 $\sum_{j} \sum_{i}( l_{ij} - \bar{l}_{ij}) = 0$.
Equation (9) is a convex quadratic problemFootnote 8 and hence has a unique global solution.
In summary, by maximising (9) in the Lagrangian multipliers  $l_{ij}, \bar{l}_{ij}$ within the constraints
 $0 \leq l_{ij}, \bar{l}_{ij} \leq C$ and
 $\sum_{j} \sum_{i}( l_{ij} - \bar{l}_{ij}) = 0$, we can identify a set of hyperplanes in the Hilbert feature space
 $\mathcal{H}$ that perform regressions that approximate our map
 $\hat{Z}$. We then use the hyperparameters C and
 $\epsilon$ to identify a hyperplane that is optimisedFootnote 9 relative to the known points
 $c_{(i+1,j+1)}$ (i.e., a hyperplane of best fit) given the vectors
 $\hat {x}_{ij}$ from a loss triangle. This is our learning step within the machine learning process. Once the hyperplane of best fit is identified (this hyperplane is characterised by w and b that are encoded in L), we use this to perform a regression for the unknown points in the loss triangle as described in section 3.2 and as illustrated in Figure 1. Since all we require to solve (9) is the inner product
 $\langle \phi(\hat{x}_{ij}),\phi(\hat{x}_{st}) \rangle_{\mathcal{H}}$, we can use the so-called kernel trick to substitute a kernel function for the inner product in
 $\mathcal{H}$.
Definition 3.2. A kernel function is a function  $k\,:\,\mathbb{R}^{m} \times \mathbb{R}^{m} \rightarrow \mathbb{R}$ such that
 \begin{equation*}k(u,v)=\langle\phi(u),\phi(v)\rangle_{\mathcal{H}} \text{ for } u,v \in \mathbb{R}^{m} \text{ and an inner product } \langle \cdot \cdot \cdot \rangle_{\mathcal{H}},\end{equation*}
where the inner product is defined in a Hilbert space  $\mathcal{H}$.
For our purposes, the kernel function is defined by  $k\,:\,\mathbb{R}^{3} \times \mathbb{R}^{3} \rightarrow \mathbb{R}$, where
 $k(\hat{x}_{ij},\hat{x}_{st})=\langle \phi(\hat{x}_{ij}),\phi(\hat{x}_{st}) \rangle_\mathcal{H}$.
This trick completely eliminates the need to explicitly compute  $\phi(\hat{x}_{ij})$ which circumvents the requirement to compute the inner product
 $\langle \phi(\hat{x}_{ij}),\phi(\hat{x}_{st}) \rangle_\mathcal{H}$ in great detail; a calculation which may be resource intensive or mathematically intractable in practice. It is clear that the choice of kernel function is important as it determines the Hilbert space
 $\mathcal{H}$ in which the SVR approximates the relationships between the vectors
 $\hat{x}_{ij}$ and the points
 $c_{(i+1,j+1)}$. Defining an appropriate kernel function becomes a critical task as it would dictate completely the manner in which the regression is performed.
3.3.1 Kernel function for general insurance claims
Taking into consideration Assumption 3.2, we seek to derive a kernel function that preserves the relationship between the vectors  $\hat{x}_{ij}$ and the points
 $c_{(i+1,j+1)}$, that is, a kernel function that preserves the Gamma distribution structure of the claims process. In order for a function
 $k(\hat{x}_{ij},\hat{x}_{st})$ to be a valid kernel in the sense described above, it must meet Mercer’s conditions, that is, the matrix G of entries
 $k(\hat{x}_{ij},\hat{x}_{st})$ is a Gram matrix which implies the following conditions;
Condition 1.  $a^{\intercal}Ga \geq0$
 $\forall a\in \mathbb{R}^{n}$
Condition 2.  $k(\hat{x}_{ij},\hat{x}_{st}) = k(\hat{x}_{st},\hat{x}_{ij}) $
We make use of certain results attributed to Bochner as well as some complex analysis (in particular, Residue theorem) to derive from first principles a new kernel function that meets Mercer’s conditions and preserves the Gamma distribution structure of the map  $\hat{Z}$. We call this kernel function the EDF kernel. We have included detailed analysis and derivations of the EDF kernel in Appendix A of this paper. Define the EDF
 $\mathcal{K}$:
Definition 3.3.
 \begin{equation*}\mathcal{K}(\hat{x}_{ij},\hat{x}_{st})=\frac{2\lambda^{\alpha}}{(\lambda+i\lVert \hat{x}_{ij}-\hat{x}_{st} \rVert)^{\alpha}}\end{equation*}
The EDF kernel derived here is the so-called reproducing kernel as discussed in Appendices A and B, and the corresponding Hilbert space  $\mathcal{H}$ implied by the EDF kernel is a reproducing kernel Hilbert space (RKHS). This is important as will be discussed in section 3.3.2. We note that the EDF kernel is also a complex kernel, and we show in Appendix A that due to Condition 1 the imaginary part of the EDF kernel is trivial for our purpose hence we are only interested in the real part of the EDF kernel. Further, we apply some algebra and analysis to derive the following expression for the real part of the EDF kernel denoted
 $Re(\mathcal{K})$ which we use as the kernel function for the inner product in equation (9). That is,
 $Re(\mathcal{K}(\hat{x}_{ij},\hat{x}_{st})) = \langle \phi(\hat{x}_{ij}),\phi(\hat{x}_{st}) \rangle_\mathcal{H}$. First we define a function
 $k^{*}$ as follows:
Definition 3.4.
 \begin{equation*}k^{*}(\hat{x}_{ij}, \hat{x}_{st})= \frac{1}{1+\frac{1}{\lambda^{2}}\lVert \hat{x}_{ij}-\hat{x}_{st} \rVert^{2}}\end{equation*}
This allows us to define the real part of  $\mathcal{K}$ as follows:
Definition 3.5. Let  $Re(\mathcal{K})$ be denoted,
 \begin{equation*} Re(\mathcal{K}(\hat{x}_{ij},\hat{x}_{st}))=2(k^{*})^{\frac{\alpha}{2}} \cos\left(\alpha\left(\arccos(\sqrt{k^{*}})\right)\right)\end{equation*}
where  $\alpha$ is as per Assumption 3.2.
We recall from the discussion immediately following Assumption 3.2 that our loss process should almost always have  $\alpha \leq 1$. We show in Appendix A that the EDF kernel can always be applied to losses for which
 $\alpha \leq 1$ which is an unexpectedly strong and important result.
3.3.2 Summary of the features of the EDF kernel
We show in Appendix B that the EDF kernel and by extension the non-trivial part of the EDF kernel (i.e., the real part of the EDF kernel) is the so-called characteristic kernel. Further, as discussed in Appendix B, kernel embedding theory tells us that if a Borel probability measure  $\mathbb{P}$ is kernel embedded using a characteristic kernel, then all the distributional features of the probability measure are preserved in the corresponding RKHS. In our case, this means that all the distributional features of the Gamma distribution are preserved in the RKHS
 $\mathcal{H}$ that corresponds to
 $Re(\mathcal{K})$ which is directly related to the Gamma distribution.
This is important because it means that the distributional relationships between the vectors  $\hat{x}_{ij}$ and the points
 $c_{(i+1,j+1)}$ are preserved which means any regression performed in
 $\mathcal{H}$ is based on the expected relationship between the vectors and points rather than using a relationship implied by the choice of kernel function (which implies a choice of Hilbert space and inner product). We would refer the reader to Appendix B for a detailed analysis of these results.
3.3.3 Limiting behaviour of the real part of the EDF kernel
We begin by noting that the parameter  $\lambda$ as in Assumption 3.2 is a scaling factor for the Gamma distribution. Our analysis as detailed in Appendix C shows that
 $\lambda$ performs a similar scaling function with respect to
 $Re(\mathcal{K})$ through the function
 $k^{*}$. This means the choice of
 $\lambda$ is only critical if it materially impacts the ratio
 $\lVert \hat{x}_{ij}-\hat{x}_{st} \rVert/\lambda$ or in other words if it applies a material scaling to the distances between elements.
We recall from section 3.3.1 that  $Re(\mathcal{K})$ is only a valid kernel in the Mercer sense if
 $\alpha \leq 1$. We note that when
 $\alpha = 0$,
 $Re(\mathcal{K})=2$ and all elements are mapped to a stretched
 $\mathcal{H}$ whereas when
 $\alpha = 1$,
 $Re(\mathcal{K})$ looks like the pdf of a Cauchy distribution multiplied by
 $\pi/2$ times the scaling parameter and centred at 0. Please see Appendix C for further details.
3.4 Exponential dispersion kernel parameter selection, hyperparameter tuning and feature scaling
Having derived a kernel function, it is necessary to convince ourselves that our choice of kernel does in fact outperform alternative more widely used kernels and identify appropriate parameters and hyperparameters for our kernel and Lagrangian L. Selection of hyperparameters can be done as a single-step process where all the hyperparameters are selected at the same time and optimised for the SVR task. This is an efficient and robust way of choosing hyperparameters as the impact of hyperparameters on each other is considered.
Our distributional parameters  $\alpha$ and
 $\lambda$ theoretically have true values implied by the data. That is, they are independent of our SVR process because they are a result of the true Gamma distribution that governs our insurance loss process. Hence, we estimate their values based on the loss data available to us.
Distributional parameter selection ( $\boldsymbol\alpha$ and
 $\boldsymbol\lambda$)
We apply the usual MLE for Gamma distribution parameters  $\hat{\alpha}$ and
 $\hat{\lambda}$ derived by computing maxima of the log likelihood function. If we consider m independent outcomes
 $x_{ij}$ from a Gamma distribution the MLE for
 $\lambda$ is given by the formula
 $\hat{\lambda} =\alpha/\bar{x}$ where
 $\bar{x} = \sum^{m}x_{ij}/m$. For the parameter
 $\alpha$, the MLE can be estimated from the formula:
 \begin{equation*}\frac{\Gamma'(\hat{\alpha})}{\Gamma(\hat{\alpha})}=\ln(\lambda)+\frac{\sum^{m}\ln(x_{ij})}{m}\end{equation*}
If we make the substitution  $\hat{\lambda} =\hat{\alpha}/\bar{x}$, then we can write
 \begin{equation*} \frac{\Gamma'(\hat{\alpha})}{\Gamma(\hat{\alpha})}-\ln(\hat{\alpha})=\frac{\sum^{m}\ln(x_{ij})}{m}-\ln(\bar{x}) \end{equation*}
where  $\Gamma'=\frac{\textrm{d}\Gamma}{\textrm{d}\alpha}$ and apply a Newton–Raphson approximation to estimate the values of the MLEs.
SVR hyperparameter selection (
C
and  $\epsilon$)
We deploy an automated Bayesian optimisation framework to tune the SVR hyperparameters. The optimisation is done based on the tree-structured Parzen estimator (Bergstra et al., Reference Bergstra, Bardenet, Bengio and Kegl2011) and assumes a uniform prior distribution of both hyperparameters.
3.4.1 Feature scaling
A key part of a standard SVR is feature scaling of data which is often necessary to correct for differences in the relative magnitudes of numbers which will have an impact on the SVR performance. One of the benefits of using the exponential dispersion kernel is it eliminates the need for traditional feature scaling in this problemFootnote 10. Feature scaling is especially important for SVR because SVR uses Euclidean distances between points. Data over a range of scales can distort the manner in which the SVR translates the Euclidean distances into the feature space leading to suboptimal results. However in our case, typical feature scaling would apply translations and transformations to our data which would in turn impact on the effectiveness of estimated parameters  $\hat{\alpha}$ and
 $\hat{\lambda}$. That is, we would have to apply equivalent transformations and translations to our kernel function in order to exploit our knowledge of the distributional structure of the data. Using the exponential dispersion kernel eliminates this issue as the feature space corresponds to the structure of the data. This saves on computational time and complexity of implementation of the algorithm compared to using alternative kernels.
4. SVR Reserving Results and Analysis
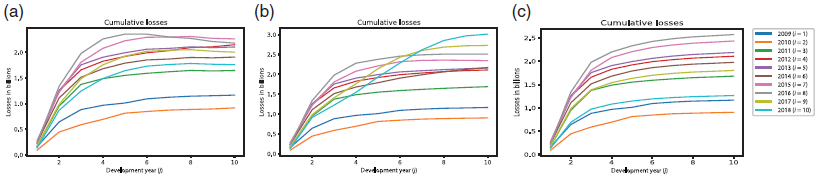
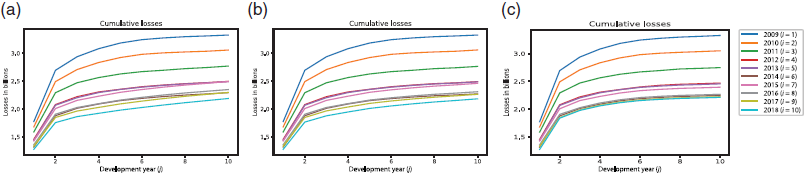
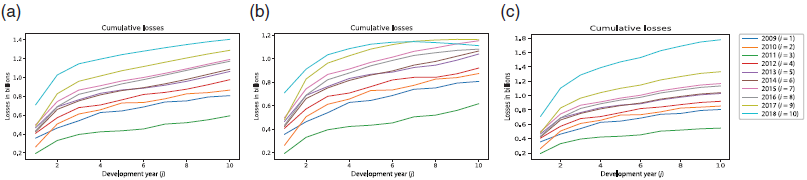
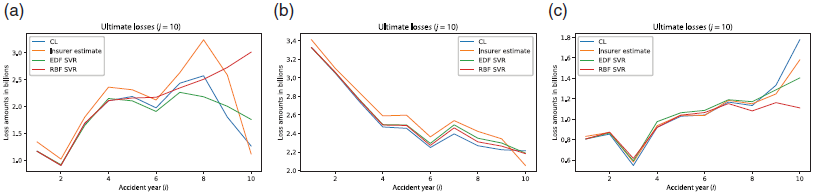
Having set up a framework, we now test and compare loss estimation results produced by: (1) the SVR method using the EDF kernel, (2) SVR using a commonly used kernel the RBF kernel also known as the Gaussian kernel and (3) the CL method. We compare results derived from triangles produced by three different insurers (Swiss Re, Zurich Insurance and Axis Capital). We have used homogeneous risksFootnote 11 in order to separate any risk diversification effects from the analysis. We have also restricted our projections and comparisons to case reserves for simplicity. All the data used in the illustration below are aggregated annually as this is the manner in which the data are reported by the three companies. The method explored in this paper should theoretically fit with data aggregated at higher frequencies; however, for illustration purposes, we will restrict our analysis to annual data as this is readily available. Figures 2–4 show the ultimate losses and cumulative claims development for each of the methods by insurer.
Swiss Re estimated cumulative losses;  $\hat{\alpha}=0.8724, \hat{\lambda}=3.24656$. (a) EDF kernel. (b) RBF kernel. (c) CL.

Zurich estimated cumulative losses;  $\hat{\alpha}=0.62365, \hat{\lambda}=1.46319$. (a) EDF kernel. (b) RBF kernel. (c) CL.

Axis Capital estimated cumulative losses;  $\hat{\alpha}=0.94299, \hat{\lambda}=6.46077$. (a) EDF kernel. (b) RBF kernel. (c) CL.

Comparison of ultimate losses by accident year. (a) Swiss Re. (b) Zurich. (c) Axis.

4.1 SVR versus CL
Both SVR methods produce different results from the CL method. There appears to be no consistent pattern in the differences between the SVR-based results and the CL method. We have also included the insurer’s best estimate of the losses. All three insurers confirm in their loss development reports (SWISSRE 2020; ZURICH 2020; AXIS 2020) that they use the CL method to determine insurance reserves albeit with adjustments to cater for past experience and actuarial judgment. Consequently, we would expect the insurer estimates to be similar to the CL results, and we see this in the general shape of the ultimate losses in Figure 5. However, the results that are closest to the insurer’s estimate consistently come from the SVR methods as in Table 1. If we focus on the EDF SVR results, we notice that, in these examples, the insurer is materially over-reserving relative to the EDF result in every case. It would appear that the SVR methods are performing some of the adjustments that the actuaries are doing to the CL result but not to the same extent. This is a notable result especially given the SVR method parameters may be refined and adjusted to reflect actuarial knowledge about the lossesFootnote 12. Alternatively, it may be that the insurers studied are indeed over-reserving for the losses based on the development pattern to date.
Comparison of results and SVR parameters (C and  $\epsilon$).

The cumulative loss patterns produced by the SVR methods are comparable to those produced by the CL method. We do have some results that may be adjusted for in practice, for example, the Swiss Re EDF result has a decreasing cumulative loss for accident year 2016. This is a result of the accident year beginning at a high initial point and the EDF SVR appears to be adjusting this downward to maintain the “tension” in the prediction model. This is easily adjusted for in the code by introducing a rule of the form  $c_{ij}\leq c_{(i,j+1)}$. We have not made these adjustments as our aim is to show the pure performance of the automated methods without any external intervention.
4.2 EDF kernel versus RBF kernel
The two methods produce similar results with some key differences. RBF appears to cluster results closer to each other in almost all cases, that is, the RBF pushes the development pattern to almost target an average ultimate loss when compared to the EDF kernel. Look, for example, at the cumulative loss pattern from the Swiss Re result where the RBF kernel produces counter-intuitive results for accident years 2017 and 2018 (years with the shortest loss history). The RBF result for axis is also counter-intuitive for the same accident years. As postulated, the EDF kernel is better able to predict results as the Hilbert space implied by the kernel appears to be more flexible and able to predict results across a wider range of starting points and development patterns. The RBF kernel appears to have less flexibility and so pushes certain results either higher or lower than would be expected. This can also be described using the tension analogy where the EDF Hilbert space has less tension between points in the framework implied by Figure 1 compared to the RBF Hilbert space. This is as a result of the EDF Hilbert space having the relationship between the vector  $\hat{x}_{ij}$ and the point
 $c_{(i+1,j+1)}$ encoded into the space which allows for a more accurate regression and projection of future points.
Overall the EDF kernel results are smoother than the RBF results and materially closer to the insurer’s estimate in each case apart from for Swiss Re. However, as described above, the Swiss Re result can be explained by the counterintuitive development of the years 2017 and 2018.
Results are as one would expect given the distribution parameters that are fed into the EDF kernel and the design of the kernel to reflect the statistical features of the claims data.
4.3 Measuring the level of uncertainty implied by each method
Having produced estimates based on two SVR and a CL method, we can quantify in some sense the volatility in the estimates produced using the RMSE measure discussed in section 2.2. We apply the definition for the MQE in Mack (Reference Mack1993) to produce the results in Table 1. We note that the EDF results consistently produce the middle RMSE in all cases. Unsurprisingly, the RMSE for the RBF results is an outlier (relative to the other two results) for two out of the three cases. This can be attributed to a combination of the counter-intuitive RBF cumulative loss development and generally less smooth results.
4.4 Backtesting the results
Unfortunately, the past data for Swiss Re and Zurich are not in a format that allows us to perform a reasonable like-for-like backtesting of results, so we have restricted our backtest to the Axis Capital data. We are able to perform a comparison of the different methods described for ultimate losses for years 2002–2008. We note the following issues with the past data for which we have had to make some adjustments:
-
1. The 2008 triangle has only seven development periods compared to the 10 development periods for the most recent data. This may have an impact on the performance of the SVR as this means there are 84 less data points available for teaching the SVR.
-
2. The 2009 triangle has eight development periods. This is a similar issue to one above.
-
3. The series
$c_{ij}$ is not monotonically increasing for the accident year 2002 and 2004. There are various reasons why this may be the case; however, this is likely to have an impact on the accuracy of the SVR. We point out that the most recent triangle containing these series (the triangle from 2012) is not monotonically increasing for the accident year 2002. This suggests that this is a peculiarity of that accident year that the insurer did not look to correct. -
4. The series for accident year 2005 is materially higher than any other series from 2002 up to 2017. The most credible explanation for this is a very large loss event leading to an accumulation of multiple normal losses or a series of extraordinarily large losses or a transaction that involved the insurer taking on liabilities of another insurer. Given the loss size is not reflected in subsequent accident years, the former explanation is the most credible one. Large losses tend to skew the loss profile of a CL triangle, and it is good practice to exclude such losses from CL analysis (Murphy & McLennan Reference Murphy and McLennan2006).

In order to account for the features of the data, we have adjusted the data as follows:
-
We have arranged the notification pattern for the series
$c_{ij}$ so that we have a monotonically increasing series for all years for which this is not the case (2002 and 2004). -
We have adjusted the first development year entry for accident year 2005 to account for the large loss by taking the average of the
$x_{(i,1)}$ from accident year 2004 and 2006 as the starting point of 2005.


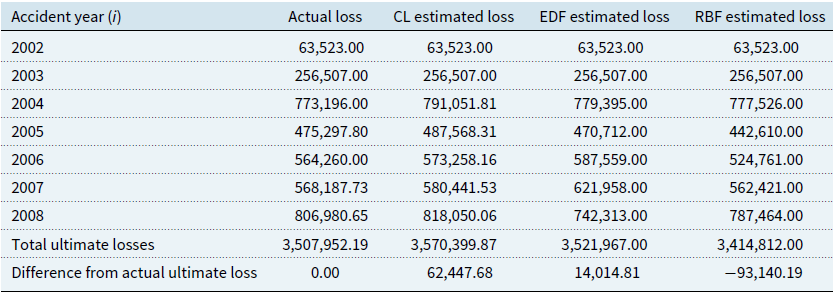
Our backtested approach involves teaching the SVR using the triangles from 2008 to 2011 and using this to complete the 2012 triangle. All parameters have been chosen using the same methods described in section 3.4. The results are summarised in Table 2Footnote 13.
Ultimate loss comparison in thousands;  $\hat{\alpha}=0.62008, \hat{\lambda}=5.33844$.

For individual accident years, the different methods show varying accuracy relative to the actual losses. In all but 2 years, the SVR results have the closest predictions. At an aggregated level across accident years, the EDF result produces the closest result to the true ultimate losses. The CL overestimates the result and the RBF quite markedly underestimates the result. This is a strong result given the entire process has been automated so there has been no external intervention into the algorithms. With more granular data, it may be possible to produce a far more accurate estimation.
5. Conclusions and Further Research
We have discussed and derived a bespoke algorithm and related kernel function for estimation of insurance losses using the SVR method. We have shown that the EDF kernel derived in this way appears to perform better than the RBF kernel and markedly different than the CL method. Although it is impossible to determine the true results from the most recent triangles used, we have backtested our model on available past data. Our fully automated EDF kernel function method appears to outperform both the EDF and CL methods in this context. We note the following benefits of using this method.
-
Performance of the SVR method is simpler to deconstruct relative to deep neural networks allowing for more accessible implementation and review.
-
The method is not reliant on granular individual data to be effective.
-
No complex and resource intensive feature scaling of the data points is required in order for the EDF kernel SVR method to be effective.
-
The EDF kernel function allows for better regression of the loss pattern (relative to the RBF kernel) due to the mapping into a related Hilbert space.
-
The EDF kernel allows users to directly reflect views of the distribution of the loss process in estimates unlike the CL method and the RBF kernel method.
-
The SVR method can be fully automated, thus requiring minimal direct external intervention in producing estimates.
There are some drawbacks to using the SVR method such as the occurrence of some counter-intuitive results. This appears to depend on the choice of kernel function with the EDF kernel appearing to be far less likely to produce curious results. The results in this paper may warrant more research with more granular data sets to determine the effectiveness of the method. It would also be worth investigating the EDF kernel performance relative to alternative widely used kernel functions such as the linear or polynomial kernel function. We have also limited ourselves to the Gamma distribution, but the same analysis may be done for losses following different distributional models which would require identification of a related kernel function. An investigation of the features of the Hilbert space implied by this methodology may also be useful.
We believe another strength of this method that we have not explored is the ability to analyse the evolution of a loss profile. For example, it may be possible to quantify the impact of a change in the shape parameter  $\alpha$ on the reserving philosophy by learning triangles and making projections based on adjusted values of
 $\alpha$.
We hope the work produced in this paper provides practitioners with a practical means of deploying machine learning to augment current methods in use.
Acknowledgements
We are most grateful to the Swiss Reinsurance Company Limited, Zurich Insurance Group Limited and Axis Capital Limited for the insurance loss data provided. We are also grateful to the University of Oxford Mathematical Institute for providing valuable feedback on the initial draft of this paper as well as our publication reviewers for the extremely helpful suggestions on making the paper accessible to the target audience.
A. Appendix
A.1 Derivation and analysis of the EDF kernel
We make use of the following results attributed to Bochner.
Theorem A.1. (Bochner’s Theorem) The Fourier transform of a probability measure  $\mu$ on
 $\mathbb{R}$ is a continuous positive definite function f such that
 $f(0) =1$.
 \begin{equation*}f(\lVert \hat{x}_{ij}-\hat{x}_{st} \rVert)=\int_{\mathbb{R}}e^{-iv\lVert \hat{x}_{ij}-\hat{x}_{st} \rVert} d\mu(v)\end{equation*}
A further implication of Bochner’s theorem is the following lemma.
Applying Bochner’s theorem to determine the characteristic function for X, we can encode the underlying structure of the claims process in our machine learning algorithm because a characteristic kernel will preserve the statistical features of our distribution (Smola et al., Reference Smola, Gretton, Song and Schölkopf2007). This allows us to take advantage of the features of the claims process to project the claims. It may also allow us to work backwards and make conclusions about the distributional family implied by the learned claims process. We derive the kernel function implied by Bochner’s theorem as follows:
Let  $v\subset \mathbb{R}$ and
 $\mu$ a Borel measure on
 $\mathbb{R}$ such that
 $\mu(v) = \int_{v}g(x)d\rho(x)$, where g(x) is the Lebesgue integrable probability density function for the Gamma distribution and
 $\rho$ is the one-dimensional Lebesgue measure.
Since  $x>0\implies \mu(v)=0$ for all
 $v \subseteq\mathbb{R}^{-}$, then
 \begin{align*}\int_{\mathbb{R}}e^{-iv\lVert \hat{x}_{ij}-\hat{x}_{st} \rVert} d\mu(v)&=\int_{\mathbb{R}^{-}}e^{-iv\lVert \hat{x}_{ij}-\hat{x}_{st} \rVert} d\mu(v)+\int_{\mathbb{R}^{+}}e^{-iv\lVert \hat{x}_{ij}-\hat{x}_{st} \rVert} d\mu(v)\\[3pt]&= \int_{\mathbb{R}^{+}}e^{-ix\lVert \hat{x}_{ij}-\hat{x}_{st} \rVert} g(x)d\rho(x)\\[3pt]&=\int_{0}^{\infty} \frac{\lambda^{\alpha}}{\Gamma(\alpha)}x^{\alpha-1}e^{-x(\lambda +i\lVert \hat{x}_{ij}-\hat{x}_{st} \rVert)}dx\end{align*}
Making the substitution  $u=x(\lambda +i\lVert \hat{x}_{ij}-\hat{x}_{st} \rVert)$ and since
 $\frac{du}{dx}=\lambda +i\lVert \hat{x}_{ij}-\hat{x}_{st} \rVert$,
 \begin{equation*}= \int_{0}^{\mathcal{A}} \frac{\lambda^{\alpha}}{\Gamma(\alpha)}\left(\frac{u}{\lambda +i\lVert \hat{x}_{ij}-\hat{x}_{st} \rVert}\right)^{\alpha-1}e^{-u}\frac{1}{\lambda +i\lVert \hat{x}_{ij}-\hat{x}_{st} \rVert}du, \text{ where } \mathcal{A}=\lim_{x\to\infty}x(\lambda +i\lVert \hat{x}_{ij}-\hat{x}_{st} \rVert)\end{equation*}
If we denote the contour traced by the path  $u=x(\lambda +i\lVert \hat{x}_{ij}-\hat{x}_{st} \rVert)$ as
 $x \to \infty$ in the complex plane as
 $A_{1}$, then the integral becomes
 \begin{equation}=\frac{\lambda^{\alpha}}{(\lambda +i\lVert \hat{x}_{ij}-\hat{x}_{st} \rVert)^{\alpha}}\frac{1}{\Gamma(\alpha)}\lim_{\lvert u\rvert \to \infty} \oint_{A_{1}}u^{(\alpha-1)}e^{-u}du\end{equation}
Equation (A.1) is a complex contour integral; hence, we apply Cauchy’s integral theorem to solve the equation. We begin by identifying suitable closed contours as illustrated in Figure A.1.
Contour integral.

If we define the integral along the contour  $\mathcal{C}_{1}= A_{1}+A_{2}+A_{3}$ and equivalently
 $\mathcal{C}_{2}= A_{1}+A_{4}+A_{5}$, we can conclude that the integral along the contour
 $A_{1}=\mathcal{C}_{1}-A_{2}-A_{3}$ and
 $A_{1}=\mathcal{C}_{2}-A_{4}-A_{5}$. Since the integral along the contour
 $A_{1} - A_{1}$ will be 0, then the integral along the contour,
 \begin{align}&\mathcal{C}_{1}-\mathcal{C}_{2}+A_{4}- A_{2}+A_{5}-A_{3}=0\nonumber\\[2pt] &\quad = \mathcal{C}_{1}-\mathcal{C}_{2}+A_{4}- A_{3}+A_{5}-A_{2}=0\end{align}
and from the symmetry of Figure A.1, we can conclude that the integral along  $A_{4}=A_{3}$, the integral along
 $A_{5}=A_{2}$ and the same for
 $\mathcal{C}_{1}=\mathcal{C}_{2}$. Now consider the integrals along the contours
 $-A_{3}$ and
 $-A_{5}$ as
 $\lvert u \rvert \to \infty$. We begin with the integral along the contour
 $-A_{5}$, and for ease of notation, we will deal only with the actual integral and multiply results by the constants later.
Notice that the contour  $-A_{5}$ as
 $\lvert u\rvert \to \infty$ is actually the positive real axis. Hence,
 \begin{equation}\lim_{\lvert u\rvert \to \infty}\oint_{-A_{5}}u^{(\alpha-1)}e^{-u}du=\int_{0}^{\infty}u^{(\alpha-1)}e^{- u}du=\Gamma(\alpha)\end{equation}
Now we work with the contour  $-A_{3}$ and notice that
 $-A_{3}$ as
 $\lvert u\rvert \to \infty$ is the imaginary axis with positive scalars. Hence,
 \begin{equation}\lim_{\lvert u\rvert \to \infty}\oint_{-A_{3}}u^{(\alpha-1)}e^{-u}du=\int_{0}^{i\infty}u^{(\alpha-1)}e^{- u}du\end{equation}
To solve (A.4) we employ another contour consisting of the quarter circle in the top-right quadrant of the complex plane, the positive real axis and the imaginary axis (our desired integral).
Cauchy’s integral theorem tells us that the integral along this closed contour is either 0 if the function is holomorphic in the open set enclosed by the contour or the sum of the residues within the contour otherwise. Consider the equation,
 \begin{equation}u^{(\alpha-1)}e^{- u}\end{equation}
We notice that (A.5) clearly has no poles for  $\alpha \geq 1$ and a pole at the origin for
 $\alpha <1$. Hence, it is holomorphic within the contours in Figures A.1 and A.2, and the integrals enclosed by the contours are all equal to 0. We can evaluate the integral along the quarter circle by parameterising u using its exponential representation
 $u=\lvert u\rvert e^{i\theta_{u}}$. The integral along the quarter circle can then be represented by the parameterisation,
 \begin{equation*}\int_{0}^{\frac{\pi}{2}} \left(\lvert u\rvert e^{i\theta_{u}} \right)^{(\alpha-1)}e^{-\lvert u\rvert e^{i\theta_{u}}} d\theta_{u}\end{equation*}
Since we are interested in the limit as  $\lvert u\rvert \to \infty$, this integral becomes
 \begin{equation}\lim_{\lvert u\rvert \to \infty} \int_{0}^{\frac{\pi}{2}} \left(\lvert u\rvert e^{i\theta_{u}} \right)^{(\alpha-1)}e^{-\lvert u\rvert e^{i\theta_{u}}} d\theta_{u}\end{equation}
and recalling that the function is holomorphic within the contour and taking the result from equation (A.3),
 \begin{equation}\implies -\lim_{\lvert u\rvert \to \infty}\oint_{A_{3}}u^{(\alpha-1)}e^{-u}du=\Gamma(\alpha)+\lim_{\lvert u\rvert \to \infty} \int_{0}^{\frac{\pi}{2}} \left(\lvert u\rvert e^{i\theta_{u}} \right)^{(\alpha-1)}e^{-\lvert u\rvert e^{i\theta_{u}}} d\theta_{u}\end{equation}
 \begin{equation*}=\Gamma(\alpha)+\lim_{\lvert u\rvert \to \infty} \int_{0}^{\frac{\pi}{2}} \lvert u\rvert^{(\alpha-1)}e^{i\theta_{u}(\alpha-1)} e^{-\lvert u\rvert\cos(\theta_{u})-i\lvert u\rvert\sin(\theta_{u})}d\theta_{u}\end{equation*}
 \begin{equation}=\Gamma(\alpha)+\lim_{\lvert u\rvert \to \infty} \int_{0}^{\frac{\pi}{2}} \lvert u\rvert^{(\alpha-1)} e^{-\lvert u\rvert\cos(\theta_{u})} e^{i\left(\theta_{u}(\alpha-1)-\lvert u\rvert \sin(\theta_{u})\right)}d\theta_{u}\end{equation}
Notice the following features of the integrand,
-
since Re
$(u)>0$ then $\cos(\theta_{u})>0$, - $\cos(\theta_{u})\neq0$ because the point lying on the imaginary axis is included in the contour $A_{3}$,
-
the preceding bullets imply
$\lim_{\lvert u\rvert \to \infty} \lvert u\rvert^{(\alpha-1)} e^{-\lvert u\rvert\cos(\theta_{u})}=0$, $\forall \alpha>0$, - $\lvert e^{i\left(\theta_{u}(\alpha-1)-\lvert u\rvert \sin(\theta_{u})\right)}\rvert\equiv1$.


Contour integral – quarter circle.

This implies that
 \begin{align*} &\lim_{\lvert u\rvert \to \infty} \int_{0}^{\frac{\pi}{2}} \lvert u\rvert^{(\alpha-1)} e^{-\lvert u\rvert\cos(\theta_{u})} e^{i\left(\theta_{u}(\alpha-1)-\lvert u\rvert \sin(\theta_{u})\right)}d\theta_{u}=0\nonumber\\[3pt] &\implies -\lim_{\lvert u\rvert \to \infty}\oint_{A_{3}}u^{(\alpha-1)}e^{-u}du = \lim_{\lvert u\rvert\to\infty}\oint_{-A_{3}}u^{(\alpha-1)}e^{-u}du=\Gamma(\alpha)\end{align*}
Going back to  $A_{1}$, we know from Cauchy’s integral theorem that the integral along
 $C_{1}$ is 0, and since the integral along
 $-A_{2}$ is equal to the integral along
 $-A_{5}$, which is
 $\Gamma(\alpha)$ as
 $\lvert u\rvert \to \infty$, then the integral along the path
 $A_{1}=C_{1}-A_{2}-A_{3}=C_{1}-A_{5}-A_{3}$ becomes
 \begin{align}\lim_{\lvert u\rvert \to \infty}\oint_{A_{1}}u^{(\alpha-1)}e^{-u}du&=\lim_{\lvert u \rvert \to \infty}\oint_{-A_{5}}u^{(\alpha-1)}e^{-u}du+\lim_{\lvert u\rvert \to \infty}\oint_{-A_{3}}u^{(\alpha-1)}e^{-u}du\nonumber\\[3pt] &=2\Gamma(\alpha)\end{align}
This means equation (A.1) becomes
 \begin{equation}=\frac{\lambda^{\alpha}}{(\lambda +i\lVert \hat{x}_{ij}-\hat{x}_{st} \rVert)^{\alpha}}\frac{1}{\Gamma(\alpha)}\cdot 2\Gamma(\alpha)\end{equation}
This gives us an expression for our kernel k which we will assume is characteristic (we show later that k implies a characteristic kernel in its real part).
Definition A.1. Define the exponential dispersion kernel  $\mathcal{K}$,
 \begin{equation*}\mathcal{K}(\hat{x}_{ij},\hat{x}_{st})=\frac{2\lambda^{\alpha}}{(\lambda+i\lVert \hat{x}_{ij}-\hat{x}_{st} \rVert)^{\alpha}}\end{equation*}
It is clear that the exponential dispersion kernel meets Mercer’s Condition 2 as discussed in section 3.3.1. We note that this is a complex kernel and in order for it to meet Mercer’s Condition 1 we need to show that it is Gram matrix is at least Hermitian. We rely on the following results from Mercer’s theorem to derive a version of the exponential dispersion kernel that meets the valid kernel conditions (Horn, Reference Horn1967).
Lemma A.3. The set of kernel functions is closed under positive scalar multiplication. That is  $sk(\hat{x}_{ij},\hat{x}_{st})$ is a kernel for any
 $s \in \mathbb{R}^{+}$.
Lemma A.4. The set of infinitely divisible characteristic kernel functions derived from infinitely divisible distributions is closed under multiplication by positive real powers. That is,  $k(\hat{x}_{ij},\hat{x}_{st})^{\tau}$ is a kernel for any
 $\tau \in \mathbb{R}^{+}$.
For an arbitrary complex kernel  $k(\hat{x}_{ij},\hat{x}_{st})=Re(k)+iIm(k)$. The Gram matrix of k is Hermitian;
 \begin{align}&\implies i\sum_{j}\sum_{i}\sum_{t}\sum_{s}a_{ij}a_{st}Im(k(\hat{x}_{ij},\hat{x}_{st}))=0 \text{ where } a_{ij}, a_{st}\in \mathbb{R}\nonumber\\[3pt] &\implies \sum_{j}\sum_{i}\sum_{t}\sum_{s}a_{ij}a_{st}k(\hat{x}_{ij},\hat{x}_{st})=\sum_{j}\sum_{i}\sum_{t}\sum_{s}a_{ij}a_{st}Re(k(\hat{x}_{ij},\hat{x}_{st}))\end{align}
Hence, our maximisation problem in the Lagrangian in equation (9) tells us that we are only interested in the real part of k as the imaginary part would vanish in (9). As long as the real part of k is a valid kernel, then we have a theoretically suitable kernel with which to perform the kernel trick.
We proceed by simplifying the terms of the exponential dispersion kernel inside the power (the expression  $\mathcal{K}^{\frac{1}{\alpha}}$) as follows:
 \begin{align}\frac{\lambda}{(\lambda+i\lVert \hat{x}_{ij}-\hat{x}_{st} \rVert)}&=\frac{\lambda}{(\lambda+i\lVert \hat{x}_{ij}-\hat{x}_{st} \rVert)}\frac{(\lambda-i\lVert \hat{x}_{ij}-\hat{x}_{st} \rVert)}{(\lambda-i\lVert \hat{x}_{ij}-\hat{x}_{st} \rVert)}\nonumber\\[3pt]&=\frac{\lambda^{2}-i\lambda \lVert \hat{x}_{ij}-\hat{x}_{st} \rVert}{\lambda^{2}+\lVert \hat{x}_{ij}-\hat{x}_{st} \rVert^{2}}\nonumber\\[3pt]&=\frac{1}{1+\frac{1}{\lambda^{2}}\lVert \hat{x}_{ij}-\hat{x}_{st} \rVert^{2}}-i\frac{\lVert \hat{x}_{ij}-\hat{x}_{st} \rVert}{\lambda}\left(\frac{1}{1+\frac{1}{\lambda^{2}}\lVert \hat{x}_{ij}-\hat{x}_{st} \rVert^{2}}\right)\nonumber\\[3pt]&=k^{*}-i\frac{\lVert \hat{x}_{ij}-\hat{x}_{st} \rVert}{\lambda}k^{*}\end{align}
where we define  $k^{*}$ to be the function,
Definition A.2.
 \begin{equation*}k^{*}(\hat{x}_{ij}, \hat{x}_{st})= \frac{1}{1+\frac{1}{\lambda^{2}}\lVert \hat{x}_{ij}-\hat{x}_{st} \rVert^{2}}\end{equation*}
Now notice the expression  $k^{*}$ is in fact the so-called Cauchy kernel. This is an infinitely divisible kernel derived from the infinitely divisible Laplace distributionFootnote 14 (Applebaum, Reference Applebaum2009; Sato, Reference Sato1999; Steutel & van Harn Reference Steutel and van Harn2003). This means that the exponential dispersion kernel reduces to the following:
 \begin{align*}\mathcal{K}&=2\left(k^{*}-i\frac{\lVert \hat{x}_{ij}-\hat{x}_{st} \rVert}{\lambda}k^{*}\right)^{\alpha}\nonumber\\[3pt]&=2(k^{*})^{\alpha}\left(1-i\frac{\lVert \hat{x}_{ij}-\hat{x}_{st} \rVert}{\lambda}\right)^{\alpha}\nonumber\\[3pt]&\quad \implies Re(\mathcal{K})=2(k^{*})^{\alpha} \cos(\Theta_{(i,j,s,t)}^{\alpha}) \left(\frac{\lambda^{2}+\lVert \hat{x}_{ij}-\hat{x}_{st} \rVert^{2}}{\lambda^{2}}\right)^{\frac{\alpha}{2}},\nonumber\\&\quad \text{where } \Theta_{(i,j,s,t)}^{\alpha} = \text{arg}\left[\left(1-i\frac{\lVert \hat{x}_{ij}-\hat{x}_{st} \rVert}{\lambda}\right)^{\alpha}\right]\\[3pt]&\quad \implies Re(\mathcal{K})=2(k^{*})^{\alpha} \cos(\Theta_{(i,j,s,t)}^{\alpha}) \left(\frac{1}{k^{*}}\right)^{\frac{\alpha}{2}}\\[3pt]&= 2(k^{*})^{\frac{\alpha}{2}} \cos(\Theta_{(i,j,s,t)}^{\alpha})\end{align*}
It is clear that the exponential dispersion kernel is bounded and decays to 0 as the distance between points in the inner product tends to infinity since this distance is the reciprocal of  $k^{*}$. The distributional parameters merely scale and transform this basic shape along the x-axis.
Since the Cauchy kernel is infinitely divisible and  $\alpha>0$, then the power in
 $k^{*}$ is a valid kernel by Lemma A.4. We can rely on Lemma A.3 to show that
 $\cos(\Theta_{(i,j,s,t)}^{\alpha})$ is a valid kernel under certain conditions.
Lemma A.5. Let  $Re_{(i,j,s,t)}^{\alpha}$ denote the real part of
 $\left(1-i\frac{\lVert \hat{x}_{ij}-\hat{x}_{st} \rVert}{\lambda}\right)^{\alpha}$ then
 $\cos\left(\Theta_{(i,j,s,t)}^{\alpha}\right)$ is a kernel if
 $\text{sgn}\left(Re_{(i,j,s,t)}^{\alpha}\right) = 1$.
Proof.
 \begin{align*}\text{Let } \left(1-i\frac{\lVert \hat{x}_{ij}-\hat{x}_{st} \rVert}{\lambda}\right)^{\alpha} &= Re_{(i,j,s,t)}^{\alpha}+iIm_{(i,j,s,t)}^{\alpha} \implies \cos\left(\Theta_{(i,j,s,t)}^{\alpha}\right)=\frac{Re_{(i,j,s,t)}^{\alpha}}{\sqrt{\left(Re_{(i,j,s,t)}^{\alpha}\right)^{2}+\left(Im_{(i,j,s,t)}^{\alpha}\right)^{2}}}\\[3pt] &=\text{sgn}\left(Re_{(i,j,s,t)}^\alpha\right)\frac{1}{\sqrt{1+\left(\tan(\Theta_{(i,j,s,t)}^{\alpha})\right)^{2} }}\end{align*}
Notice  $ \frac{1}{\sqrt{1+\left(\tan(\Theta_{i,j,s,t)}^{\alpha})\right)^{2}}}$ is the so-called inverse multiquadratic kernel and by Lemma A.4,
 \begin{align*}\text{sgn}\left(Re_{(i,j,s,t)}^{\alpha}\right) = 1 \implies \text{sgn}\left(Re_{(i,j,s,t)}^\alpha\right)\frac{1}{\sqrt{1+\left(\tan(\Theta_{(i,j,s,t)}^{\alpha})\right)^{2}}} \text{ is a valid kernel}\\[-30pt]\end{align*}
☐
We can observe Lemma A.5 directly, for example, when  $\alpha = 1$ the inverse multiquadratic kernel takes the more familiar form
 $\frac{\lambda}{\sqrt{\lVert \hat{x}_{ij}-\hat{x}_{st} \rVert^{2}+\lambda^{2}}}$.
Mercer’s theorem tells us that the set of valid kernels is closed under pointwise multiplication. This implies  $Re(\mathcal{K})$ is a valid kernel so long as
 $\alpha$ is such that
 $\cos(\Theta_{(i,j,s,t)}^{\alpha})$ is a valid kernel. Since the parameter
 $\alpha$ determines the shape of our Gamma distribution, our kernel will only be valid for certain shapes of the Gamma distribution. We can identify the range of
 $\alpha$ for which
 $Re(\mathcal{K})$ is a valid kernel. We do this by first simplifying (A.14) into a function of only
 $k^{*}$ as follows. Notice,
 \begin{align*}&\left \lvert1-i\frac{\lVert \hat{x}_{ij}-\hat{x}_{st} \rVert}{\lambda}\right\rvert=\frac{1}{(k^{*})^{0.5}}\\[3pt]&\quad\implies \cos\left(\Theta_{(i,j,s,t)}^{1}\right)= \sqrt{k^{*}}\\[3pt]&\quad\implies \Theta_{(i,j,s,t)}^{1}=\arccos\left(\sqrt{k^{*}}\right)\\[3pt]&\quad\implies \Theta_{(i,j,s,t)}^{\alpha}=\alpha\left(\arccos\left(\sqrt{k^{*}}\right)\right)\end{align*}
This allows us to define (A.14) as follows:
Definition A.3. Let  $Re(\mathcal{K})$ be denoted,
 \begin{equation*} Re(\mathcal{K}(\hat{x}_{ij},\hat{x}_{st}))=2(k^{*})^{\frac{\alpha}{2}} \cos\left(\alpha\left(\arccos\left(\sqrt{k^{*}}\right)\right)\right)\end{equation*}
We can identify conditions under which  $Re(\mathcal{K})$ is a valid kernel. We know that
 $\text{sgn}\left(Re_{(i,j,s,t)}^\alpha\right)=\text{sgn}\left(\cos(\Theta_{(i,j,s,t)}^{\alpha})\right)$ so
 $Re(\mathcal{K}(\hat{x}_{ij},\hat{x}_{st}))$ is a valid kernel for all
 $\alpha$ s.t,
 \begin{equation} \cos\left(\Theta_{(i,j,s,t)}^{\alpha}\right)>0 \implies -\left(2\pi n+\frac{\pi}{2}\right)<\Theta_{(i,j,s,t)}^{\alpha}<\left(2\pi n +\frac{\pi}{2}\right) \text{ for } n\in \mathbb{Z}\end{equation}
However,
 \begin{equation*} \Theta_{(i,j,s,t)}^{\alpha}=\alpha\left(\arccos(\sqrt{k^{*}})\right) \implies \cos\left(\frac{\Theta_{(i,j,s,t)}^{\alpha}}{\alpha}\right)=\sqrt{k^{*}}=\left(\left \lvert1-i\frac{\lVert \hat{x}_{ij}-\hat{x}_{st} \rVert}{\lambda}\right\rvert\right)^{-1}>0\end{equation*}
 \begin{equation}\implies - \left(2\pi n+\frac{\pi}{2}\right)<\frac{\Theta_{(i,j,s,t)}^{\alpha}}{\alpha}<\left(2\pi n +\frac{\pi}{2}\right) \text{ for } n\in \mathbb{Z}\end{equation}
 \begin{equation*}\implies \text{for } \alpha\leq1, - \left(2\pi n+\frac{\pi}{2}\right)<\Theta_{(i,j,s,t)}^{\alpha}<\left(2\pi n +\frac{\pi}{2}\right) \text{ and } Re(\mathcal{K}(\hat{x}_{ij},\hat{x}_{st})) \text{ is always a valid kernel.}\end{equation*}
For  $\alpha>1$,
 $Re(\mathcal{K}(\hat{x}_{ij},\hat{x}_{st}))$ is a valid kernel in a Mercer sense only if
 $\Theta_{(i,j,s,t)}^{\alpha}$ is s.t.(A.15) is true.
Thus our kernel is always valid for  $\alpha\leq1$. We recall from the discussion immediately following from Assumption 3.2 that our incremental losses should almost always have
 $\mathbf{\alpha} \leq \mathbf{1}$, which means that the exponential dispersion kernel can always be applied to these types of incremental claims. This is an unexpectedly strong result.
B. Appendix
B.1 Features of the real part of the exponential dispersion kernel
Kernel embedding theory tells us that given a r.v. X with co-domain  $\Omega$ and the RKHS
 $\mathcal{H}$ linked to a reproducing kernel k, a Borel probability measure
 $\mathbb{P}$ is kernel embedded as
 \begin{equation}\mathbb{P} \mapsto \int_{\Omega}k(\cdot,x)d\mathbb{P}(x)\end{equation}
There are two features of this map that are relevant to our study (Sriperumbudur et al., Reference Sriperumbudur, Gretton, Fukumizu, Schölkopf and Lanckriet2010):
-
1. When the map is injective, the reproducing kernel k is known as a characteristic kernel.
-
2. All the distributional features of
$\mathbb{P}$ are preserved in $\mathcal{H}$ if the embedding is performed using a characteristic kernel.


Therefore, if k is characteristic it would allow us to preserve the features of the claims distribution in  $\mathcal{H}$. We hypothesise that this would result in better performance of the SVR as we would be performing the learning and projections based on a
 $\mathcal{H}$ that preserves the statistical structure of the data.
A further implication of 1 and 2 above is that our choice of parameters  $\alpha$ and
 $\lambda$ specific to the exponential dispersion kernel will be important as they would determine the conditions in
 $\mathcal{H}$ under which the regression is performed. Since (B.1) is injective if
 $\mathcal{K}$ is characteristic, a choice of parameters that are materially different from the true parameters would result in a map (B.1) based on a
 $\mathbb{P}$ that has a statistical structure that is materially different from the true distribution. We hypothesise that this would result in poor performance of the SVR. Our analysis has shown that for the Gamma distribution, the choice of
 $\alpha$ is critical in determining the shape, hence it will be of importance in our SVR.
Suppose we have a pair of Borel probability measures  $\mathbb{P}$,
 $\mathbb{Q}$ with co-domain
 $\Omega$ and the RKHS
 $\mathcal{H}$ is linked to the reproducing kernel
 $\mathcal{K}$. Let us denote the similarity measure between the distributions as
 $\mathbb{D}$ (informally, we say
 $\mathbb{D} = \mathbb{P}-\mathbb{Q}$). The kernel embedding map of the similarity measure
 $\mathbb{D}$ is given by
 \begin{equation}\mathbb{D} \mapsto \int_{\Omega}\mathcal{K}(\cdot,x)d(\mathbb{D})(x)\end{equation}
We recall that  $\mathcal{K}$ is the Fourier transform of the Borel measure
 $\mu(v)$ on
 $\mathbb{R}$. Restricting ourselves to
 $\mathbb{R}^{+}$ because the Gamma distribution is defined only in the positive real line;
 $\mathcal{K}$ becomes the Laplace transform of
 $\mu(v)$. We will denote the Laplace transform of
 $\mu(v)$ by
 $\hat{\mu}(v)$ and note that (B.2) maps to 0 means,
 \begin{equation}\int_{\Omega}\hat{\mu}(v)d(\mathbb{D})(x)=0\end{equation}
which implies that either;
- $d(\mathbb{D})(x)=0 \implies \mathbb{D}=0$ (i.e., the distributions are identical) or…
- $\hat{\mu}(v)=0$ (if this is true we are unable to determine if the distributions are identical based on (B.3) alone).


Preserving the distributional features following the mapping into the Hilbert space  $\mathcal{H}$ requires
 $\mathcal{K}$ to be characteristic which is the case if the first bullet point is true (i.e., if the kernel embedding map is injective). To ensure this is the case, we require the following condition:
Condition 3.  $\hat{\mu}(v)>0, \forall v \subseteq \mathbb{R}^{+}$
Lerch’s theorem tells us that,  $\hat{\mu}(v)=0 \iff \mu(v)=0$ which means Condition 3 is met iff
 $\mu(v)>0, \forall v \in \mathbb{R}^{+}$. This tells us that in order for Condition 3 to be met; the support of
 $\mu$, Supp(
 $\mu$) =
 $\mathbb{R}^{+}$. For
 $v \subseteq (\!-\infty,0]$,
 $\mu(v)=0$ since x is defined in the domain
 $(0,\infty)$ which means
 $\text{Supp}(\mu) \subseteq (0,\infty]$. If we take an arbitrary
 $x \in (0,\infty]$;
 \begin{equation*} \mu((x-\epsilon,x+\epsilon))>0, \forall \epsilon \text{ such that } 0<\epsilon<x\end{equation*}
and  $\forall \epsilon >x$,
 \begin{align}\mu((x-\epsilon,x+\epsilon)) &= \mu((x-\epsilon,0])+ \mu((0,x+\epsilon))\nonumber\\[3pt]&=0+\mu((0,x+\epsilon))\nonumber\\[3pt]&=\mu((0,x+\epsilon))>0\nonumber\\[3pt]\implies \text{Supp}(\mu)&=(0,\max(x+\epsilon))=\mathbb{R}^{+}\end{align}
The result in (B.4) tells us that equation (B.3) is 0 iff  $\mathbb{D} = 0$ (informally, we say
 $(\mathbb{P}-\mathbb{Q})\,{=}\,0$), which means (B.2) is injective for the EDF kernel and the EDF kernel is characteristic. Thus applying
 $\mathcal{K}$ as our kernel means we preserve the statistical features of the Gamma distribution in
 $\mathcal{H}$, and hence the regression performed in (9) is performed in this appropriately structured high-dimensional space.
Muandet et al. provide a comprehensive summary of the applications and importance of kernel embedding theory, and we would refer the reader to Muandet et al. (Reference Muandet, Fukuzima, Sriperumbudur and Schölkopf2017) for further details. In our case, the importance of preserving the statistical features of the distribution lies in facilitating an optimal regression in  $\mathcal{H}$. The EDF kernel allows us to use the parameters
 $\alpha$ and
 $\lambda$ to inform our regression without having to adjust these values to account for the transformation from the Gamma distribution in
 $\mathbb{R}$ into the
 $\mathcal{H}$ version of the Gamma distribution or ignoring these completely in performing the regression as is the case with the RBF kernel. It also allows us to perform the regression without having to make any adjustments to the original dataFootnote 15 to make the data ready before performing a regression.
C. Appendix
C.1 Limiting behaviour of the real part of the exponential dispersion kernel in $\alpha$ and $\lambda$


Since  $Re(\mathcal{K})$ is a function of
 $k^{*}$, we begin our investigation by considering the limits of
 $k^{*}$ in
 $\lambda>0$.
 \begin{equation*}\lim_{\lambda \to \infty}k^{*}= \lim_{\lambda \to \infty}\frac{1}{1+\frac{1}{\lambda^{2}}\lVert \hat{x}_{ij}-\hat{x}_{st} \rVert^{2}}=1 \text{ and } \lim_{\lambda \to 0}k^{*}=0\end{equation*}
It is clear that  $0<k^{*}<1$. Intuitively, we can describe
 $\lambda$ as scaling the distance
 $\lVert \hat{x}_{ij}-\hat{x}_{st} \rVert$ in
 $\mathcal{H}$. As
 $\lambda \to \infty$, the space
 $\mathcal{H}$ is stretched so wide that the distances between elements in
 $\mathcal{H}$ are the same and equal to the maximum distance the space allows (this can be thought of as stretching so wide so as to create an infinite distance between the closest points). As
 $\lambda \to 0$,
 $\mathcal{H}$ is shrunk to the point of putting 0 distance between the furthest points. We can see this in the limits of
 $Re(\mathcal{K})$,
 \begin{equation}\lim_{\lambda \to \infty} Re(\mathcal{K})=2\cdot(1)\cdot \cos(\alpha(\arccos(1)))=2\end{equation}
and
 \begin{equation}\lim_{\lambda \to 0} Re(\mathcal{K})=2\cdot (0)\cdot \cos(\alpha(\arccos(0)))=0\end{equation}
Therefore, the behaviour of  $Re(\mathcal{K})$ as
 $\lambda$ varies is as expected given the scaling property of
 $\lambda$. This means that our choice of
 $\lambda$ is only critical if it materially impacts the ratio
 $\lVert \hat{x}_{ij}-\hat{x}_{st} \rVert/\lambda$ or in other words if it applies a material scaling to the distances between elements.
We recall from Appendix A that  $Re(\mathcal{K})$ is a valid kernel only if
 $\alpha\leq1$. When
 $\alpha =0$,
 $Re(\mathcal{K})=2$ and the elements are mapped to the same stretched
 $\mathcal{H}$ as
 $\lambda$ at its upper limit.
Setting  $\alpha=1$ gives us
 $Re(\mathcal{K})=2(k^{*})^{0.5}\sqrt{k^{*}}=2k^{*}$
 \begin{equation}=\left(\frac{2\lambda^2}{\lambda^2+\lVert \hat{x}_{ij}-\hat{x}_{st} \rVert^{2}}\right)\end{equation}
This result is clear from looking at the real part of the exponential dispersion kernel when  $\alpha=1$. We note that (C.3) can be described as the pdf of the Cauchy distribution multiplied by
 $\pi/2$ times the scale parameter and centred at 0.