INTRODUCTION
Owing to unprecedented loss of tropical forests and ensuing biotic extinctions (Castelletta et al. Reference Castelletta, Sodhi and Subaraj2000; Brook et al. Reference Brook, Sodhi and Ng2003), protected areas (PAs) are vital for the conservation of residual biodiversity (Kramer et al. Reference Kramer, van Schaik and Johnson1997). However, human-driven loss and degradation of tropical forests both within and outside their borders are compromising the ecological integrity of PAs (Curran et al. Reference Curran, Trigg, McDonald, Astiani, Hardiono, Siregar, Caniago and Kasischke2004; DeFries et al. Reference DeFries, Hansen, Newton and Hansen2005; Bickford et al. Reference Bickford, Supriatna, Andayani, Iskandar, Evans, Brown, Townsend, Umilaela, Azhari, McGuire, Sodhi, Acciaioli, Erb and Tan2008). In addition to habitat loss in PAs (Kinnaird et al. Reference Kinnaird, Sanderson, O'Brien, Wibisono and Woolmer2003), illegal resource extraction such as hunting (Milner-Gulland et al. 2003) is exacerbating the ongoing biodiversity crisis. Burgeoning human populations will further escalate conflicts between biodiversity conservation and rural livelihoods (Adams et al. Reference Adams, Aveling, Brockington, Dickson, Elliott, Hutton, Roe, Vira and Wolmer2004; Sodhi et al. Reference Sodhi, Koh, Brook and Ng2004); the probability of wildlife extinction and wildlife-human conflicts appears to be positively associated with human densities fringing PAs (Newmark et al. Reference Newmark, Manyanza, Gamassa and Sariko1994; Brashares et al. Reference Brashares, Arcese and Sam2001; Wittemyer et al. Reference Wittemyer, Elsen, Bean, Coleman, Burton and Brashares2008). It is therefore critical to determine the underlying cause(s) of resource extraction in PAs in order to develop tangible conservation strategies.
Previous studies have revealed that conservation attitudes, perspectives on conservation and the extent of natural resource extraction may be influenced by demographic and socioeconomic factors such as ethnicity and wealth (Gillingham & Lee Reference Gillingham and Lee1999; Weladji & Tchamba, Reference Weladji and Tchamba2003; Davidar et al. Reference Davidar, Arjunan and Puyravaud2008). This suggests that conflicts between conservation and people could be minimized if planners had considered social issues during conservation planning (Terborgh et al. Reference Terborgh, van Schaik, Davenport and Rao2002; Sodhi et al. Reference Sodhi, Brooks, Koh, Acciaioli, Erb, Tan, Curran, Brosius, Lee, Patlis, Gumal and Lee2006, Reference Sodhi, Acciaioli, Erb and Tan2008). Thus, understanding conservation attitudes (and related resource harvesting behaviour) is crucial for developing and implementing conservation strategies (Gillingham & Lee Reference Gillingham and Lee2003; Holmes Reference Holmes2003; Allendorf et al. Reference Allendorf, Swe, Oo, Htut, Aung, Aung, Allendorf, Hayek, Leimgruber and Wemmer2006).
However, few attitudinal studies towards PAs have been carried out in South-east Asia (Walpole & Goodwin Reference Walpole and Goodwin2001; Allendorf et al. Reference Allendorf, Swe, Oo, Htut, Aung, Aung, Allendorf, Hayek, Leimgruber and Wemmer2006), although the region overlaps four biodiversity hotspots (Indo-Burma, Sundaland, the Philippines and Wallacea) that contain exceptionally high levels of biotic endemism (Myers et al. Reference Myers, Mittermeier, Mittermeier, da Fonseca and Kent2000) and are currently experiencing the highest deforestation rates worldwide (Achard et al. Reference Achard, Eva, Stibig, Mayaux, Gallego, Richards and Malingreau2002; Sodhi & Brook Reference Sodhi and Brook2006).
In South-east Asia, the Republic of Indonesia epitomizes one of the worst-case scenarios of seemingly irreconcilable PA-human conflict (Bickford et al. Reference Bickford, Supriatna, Andayani, Iskandar, Evans, Brown, Townsend, Umilaela, Azhari, McGuire, Sodhi, Acciaioli, Erb and Tan2008). Even though the national PA network was established by adopting the best principles of conservation biology (Pressey et al. Reference Pressey, Humphries, Margules, Vane-Wright and Williams1993; Jepson et al. Reference Jepson, Jarvie, MacKinnon and Monk2001), an ambitious national-scale transmigration project resettled large human populations from overcrowded areas such as Java to the edges of PAs on less populous islands such as Sulawesi. This inevitably facilitated human encroachment of PAs (van Schaik et al. Reference van Schaik, Terborgh, Dugelby, Kramer, van Schaik and Johnson1997). Therefore, it is critical to examine the repercussions of this prominent land-use conflict in this ‘mega-diverse’ country, particularly on Sulawesi where there is high vertebrate endemicity (61% and 34% of mammals and birds are endemic, respectively; Whitten et al. Reference Whitten, Mustafa and Henderson2002).
Furthermore, for PAs to be successful in biodiversity conservation there is a need to build local legitimacy (for example see McCarthy Reference McCarthy2006; Acciaioli Reference Acciaioli, Sodhi, Acciaioli, Erb and Tan2008) and/or to provide economic interest and linkages for the local communities (i.e. Biodiversity Conservation Network; Salafsky & Wollenberg Reference Salafsky and Wollenberg2000). The former is particularly pertinent for Indonesia where customary land was involuntarily taken from local people with little or insufficient compensation when the PAs were first established (World Bank 2001; Suyanto et al. Reference Suyanto, Permana, Khususiyah and Joshi2005). As a result, social resentment toward PAs may have been generated, potentially jeopardizing effective biodiversity conservation.
Here, we provide a first assessment of the effects of negative PA interactions due to past land-use conflict on conservation attitude and illegal forest resource harvesting across multiple PAs in Indonesia. Our study has two primary objectives. First, we examine the relative importance of determinants of level of support for PAs (a measure of conservation attitude). Since sociodemographic variables such as education level may also be good predictors of conservation attitude (Mehta & Heinen Reference Mehta and Heinen2001), we test the hypothesis that sociodemographic variables, as well as the incidence of land-use conflict, are important in determining the level of support for PAs. Second, we investigate the effects of conservation attitude, perceptions of and interactions (i.e. management and conflict) with PAs, and sociodemographic variables on illegal forest resource harvesting (such as wildlife hunting) in the PAs. Because conservation attitudes could influence the degree of individual resource use (Newmark et al. Reference Newmark, Leonard, Sariko and Gamassa1993), we test the hypothesis that the level of PA support affects the extent of resource extraction. Our study may provide insights into creating viable PAs in increasingly human-dominated landscapes.
MATERIALS AND METHODS
Study sites
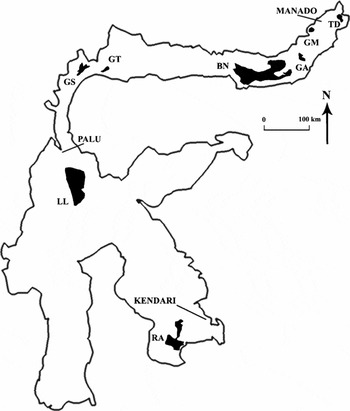
The eight PAs studied are on the main island of Sulawesi (118–126°E and 2°N–6°S; Table 1, Fig. 1). They include Gunung Ambang Nature Reserve (GA), Gunung Manembo-nembo Wildlife Reserve (GM), Tangkoko-Batu Angus and Dua Saudara Nature Reserves (TD), Bogani Nani Wartabone National Park (BN), Gunung Sojol Nature Reserve (GS), Gunung Tinombala Nature Reserve (GT), Lore Lindu National Park (LL) and Rawa Aopa Watumohai National Park (RA) (see Lee et al. Reference Lee, Sodhi and Prawiradilaga2007 for further details on PAs). The definitions of nature reserve, national park and wildlife reserve closely follow the World Conservation Union (IUCN) categories I, II and IV, respectively, where the exploitation of natural resources is illegal. Local inhabitants from 33 different villages distributed among the PAs were interviewed during October 2003–August 2004. The villages per PA were opportunistically selected and ranged from three to six depending on the size of the associated PA (Table 1). Adjacent villages were at least five km apart and all sampled villages bordered the PAs (located <5 km from PA boundaries). The number of park rangers varied across villages and PAs, with most areas under-staffed. Even in areas where they are present, the rangers are under-resourced in both training and equipment, often resulting in poor law enforcement. Overall, there appears to be slightly stronger enforcement capacity in national parks (for example LL) than in nature reserves (such as GM) (T.M. Lee, unpublished data Reference Lee, Gorog, Dwiyahreni, Siwu, Riley, Alexander, Paoli and Ramono2005).
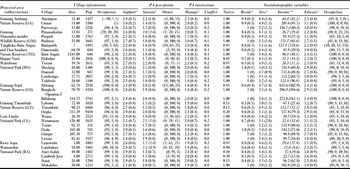
Summary information of 33 villages from eight different protected areas (PAs) including village information, conservation attitude, perceptions of PAs, interactions with PAs, and sociodemographic variables. Village information includes village name, area (km2) and population (as of 2003–2004: ‘Pop’), and % population with three main types of occupation (Farm, Skill, Fish). Conservation attitude is represented by mean scores of the level of support for established PAs (‘Support’ higher score indicates greater support). PA perceptions include the mean scores of the perceived level of resource sustainability (‘Sustain’; higher score indicates higher expected level of sustainability) and % households selecting three perceived owners of PAs (‘Owner’: nobody, government/country, everybody)]. PA interactions include the mean scores of the degree of management (‘Manage’; higher score represents higher degree of participation) and the proportion of households experiencing conflict with PAs (‘Conflict’). Sociodemographic variables include the proportion of households native to Sulawesi (‘Native’), mean proportional length of residency in the village (‘Reside’), mean family size (‘Size’), mean monthly income in US dollars (‘Income’), mean education level (‘Educate’; higher score indicates higher education level), and % households with four main types of occupation (Farm, Labour, Skill, Fish). ∧Numbers in parentheses represent standard deviation. ? = missing data. Italicized numbers indicate that some interviewees did not provide an answer. *Conversion rate of 9000 Indonesian Rupiah = US$ 1 (average during 2003–2004). §Significant difference in sampled and actual village proportions of occupational categories.

Location of eight PAs on the main island of Sulawesi: Gunung Ambang Nature Reserve (GA), Gunung Manembo-nembo Wildlife Reserve (GM), Tangkoko-Batu Angus and Dua Saudara Nature Reserves (TD), Bogani Nani Wartabone National Park (BN), Gunung Sojol Nature Reserve (GS), Gunung Tinombala Nature Reserve (GT), Lore Lindu National Park (LL) and Rawa Aopa Watumohai National Park (RA).

Data collection
Interviews were carried out at the household level. We assumed that a household comprised the basic unit of shared economic production and resource use (Casley & Lury Reference Casley and Lury1981). Household interviews were conducted with a proportional haphazard sampling design stratified by major occupational typologies (farmer, labourer, skilled and fisher). This is because previous work from GM suggested that forest resource use might be influenced by income source category (Lee et al. Reference Lee, Riley and Suyatno1999). While the household head was targeted, either the household head's wife or another permanently resident adult was interviewed if the former was unavailable and if he/she was able to provide accurate information about the household. Interviews were administered orally in Bahasa Indonesia (national language) by two local field assistants. Equal numbers of interviews were conducted across all villages to minimize sampling bias between the assistants. Because we did not know the proportion of household sampled per village, we caution against interpreting our results based on sampling rate of household numbers. Despite the small sample size of interviews per village, we ensured that the sampled proportions adequately represented actual proportions of occupational categories across all villages so that our results may be generalized. Nevertheless, we report that there are nine (including two with unknown occupational breakdown) villages that have significantly different actual than sampled occupational proportions (χ2 goodness of fit test > 3.81; p < 0.05; Table 1). We did not explicitly consider whether a chosen village had ongoing or past conservation projects as they were opportunistically selected. Although we cannot test if conservation education may be an important predictor of support for PAs, based on more recent surveys we have some evidence that this is the case in some parks in South-east Asia (N.S. Sodhi & T.M. Lee, unpublished data 2009). Overall, a total of 660 households from 33 villages were interviewed.
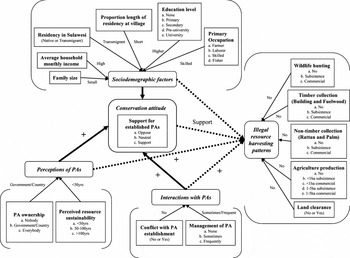
The interview included a mixture of open-ended and fixed-response questions encompassing the respondent's sociodemographic characteristics, conservation attitude, perceptions of PAs, interactions with PAs and extent of resource harvesting activities (Appendix 1, see Supplementary material at URL http://www.ncl.ac.uk/icef/EC_Supplement.htm). We did not explicitly record the ethnicity of each household, which may be an important predictor for PA support or extent of resource harvesting (see Weladji & Tchamba Reference Weladji and Tchamba2003). Instead, we attempted to account for this influence indirectly by noting whether each household was native (or not) to Sulawesi and the length of residency of the household in each village. Responses to the extent of support for adjacent PAs were categorized with a symmetric three-point Likert scale. Responses to the degree of participation in PA management and conflict with established PAs were categorized using a three-point rank scale and dichotomous choices, respectively (Fig. 2). The conflict here is related to the displacement from the interior of PAs to the fringe and/or land seizure within PAs. We were not looking at the influence of the types of management activity, and we did not collect management activity data. We were primarily interested in determining whether involvement in management activity influenced the household's conservation attitude and resource harvesting patterns. Reponses to questions on perceived forest resource sustainability and ownership of PAs were categorized using a three-point rank scale and polychotomous choices, respectively (Fig. 2). The timescale for perceived forest resource sustainability should not be a concern (i.e. too long for rural communities) because we were only interested in the relative, not exact, perception. Following Newmark et al. (Reference Newmark, Leonard, Sariko and Gamassa1993), a ‘don't know’ or ‘no comment’ response was re-coded as negative for all opinion questions except those on perceptions, on the assumption that such a response could indicate a potentially negative attitude. We first tested the questions with village heads to improve their relevancy and clarity. Although our interview questions are relatively simple (Appendix 1, see Supplementary material at URL http://www.ncl.ac.uk/icef/EC_Supplement.htm), the current study may promote interest in much needed in-depth studies in South-east Asia.
Hypothesized relationships between the sociodemographic factors, perceptions of and interactions with protected areas, and conservation attitude and illegal resource harvesting patterns of households living adjacent to reserves in Sulawesi. The sociodemographic factors selected included residency in Sulawesi, proportional length of residency at village, family size (number of people living in each household), primary occupation, average household monthly income (US$) and education level. Thick arrows indicate the potential predictors of local support for PAs; dashed arrows indicate the potential correlates of illegal resource use in PAs. Each rectangle represents a predictor with its associated levels. ‘+’ by the thick (or dashed) arrow indicates positive association between a variable and conservation attitude (or illegal resource harvesting patterns). Level by the arrow represents the selected level for each hypothesized relationship, for example ‘Higher’ indicates post-‘Secondary’ education level. Examples of the hypothesized relationship include the following: households with no conflict are hypothesized (1) to support the established PAs and (2) to have reduced illegal resource harvesting intensities.

We identified seven main types of illegal harvesting activities and exploitation commonly observed within PAs by resident park rangers. These included wildlife hunting, timber extraction (fuelwood and building) and non-timber collection (rattan, for example Calamus zollingeri and palm, for example Livistona rotundifolia). Responses concerning resources harvested were recorded on a three-point rank scale (Fig. 2). The ascending rank scales on harvesting activities represented increasing level of resource extraction. We assumed that commercial (defined as for trade), as opposed to subsistence (defined as for own use), extraction could potentially be more intensive and hence more ecologically unsustainable. The responses on the degree of agricultural production in ‘forest garden’ were categorized on a five-point rank scale, while the degree of land clearing for agriculture was recorded using a two-point rank scale (Fig. 2). Although we attempted to collect data on the harvesting frequency and amount of resource harvested, the sample size was too small for any meaningful analysis. Nevertheless, we acknowledge the potential impact of such data on overall harvesting intensities.
Despite generally being a cost-effective method, one of the major shortcomings of interviews is that respondents may not provide negative opinions to a third party and may hide illegal exploitation practices (such as hunting), thus possibly introducing potential bias (de Boer & Baquete Reference de Boer and Baquete1998). We tried to minimize this bias by (1) assuring respondent's anonymity and stating our autonomy from official PA management, and (2) determining actual harvest intensities within the PA in the vicinity of each village to validate reported resource use. Specifically, we assessed the relative resource harvesting patterns across villages. However, if possible, we recommend that future studies also determine actual and reported resource use at the level of the household for more reliable assessment. We presumed that any forest resources extracted within PAs was by local people. We quantified the densities of harvested resources by estimating the number (such as signs of traps/snares and collection) and area (size of ‘forest garden’ and land clearing) of resources extracted per km along survey transects (mean transect length ± SD 5.7 ± 1.2 km; n = 33) in PAs. To make the estimates comparable, we included both inactive and active signs of resource harvested in our actual estimates, as the reported estimates given by the respondents were not within a stipulated period. Our ecological surveys revealed some degree of correspondence between reported harvesting scores and observed densities of harvested resources across villages (i.e. hunting, fuelwood and rattan collection and land clearing; Spearman rank correlations ρ = 0.34 – 0.59, df = 33, p ≤ 0.05). This suggests that reported responses were to some extent unbiased (Appendix 2, see Supplementary material at URL http://www.ncl.ac.uk/icef/EC_Supplement.htm). Nonetheless, we believe that it is reasonable to assume that reported harvesting responses are conservative estimates of actual harvesting intensities.
Statistical analyses
To determine the relative importance of perceptions of PAs, interactions with PAs and sociodemographic variables on level of support for adjacent PAs, mixed-effects ordinal regression models were performed between each predictor (fixed effect) and ordered categorical (ordinal) support responses (complementary log-log; Agresti Reference Agresti2002) (Fig. 2). The mixed-effects model assumes that households nested within villages (two-level analysis) are likely to be non-independent. In essence, the mixed-effects ordinal regression analysis assumes the threshold concept when modelling the response link function. The degree of dependency from clustered data is incorporated into the estimation of model parameters by using the maximum marginal likelihood estimation and a Fisher-scoring solution (Hedeker & Gibbons Reference Hedeker and Gibbons1994). To evaluate the influence of intra-village correlation, we compared the fit of mixed-effects model to a model that ignored the random village effect using a likelihood-ratio χ2 test. All regression analyses were performed with MIXOR (see URL http://tigger.uic.edu/~hedeker/mix.html).
We adopted a four-step procedure to generate a final model of probability for levels of conservation attitude. First, to satisfy the assumption for multiple regression analyses, we checked for multicollinearity among our continuous and categorical variables (Menard Reference Menard2001). Second, to investigate potential complex interactions between predictors, we fitted the classification tree model and considered only significant interactions for the final model selection (‘tree’ package in R statistical package version 2.2.0; see URL http://cran.r-project.org/). Third, to produce a pool of candidate subset multiple regression models, we sequentially removed the variable with the smallest contribution to model adequacy from the full (global) model, based on the decrease in log-likelihood value when each independent variable was removed. Fourth, we assessed the relative strength of support (Akaike weights) for each of the candidate models with the second order model selection Akaike's Information Criterion (AICc; Burnham & Anderson Reference Burnham and Anderson1998; Anderson et al. Reference Anderson, Link, Johnson and Burnham2001). The AICc process selects the most parsimonious final model, allowing for the trade-off between minimizing bias and maximizing precision. This is done using a model's log-likelihood and imposing a penalty for the number of parameters used in the fitted regression models.
To examine the effects of conservation attitude, perceptions of PAs, interactions with PAs and sociodemographic variables on household pattern of seven different illegal resource harvesting activities, we performed multivariate analyses on reported responses with the statistical software PRIMER (Plymouth Routines in Multivariate Environmental Research; Clarke & Warwick Reference Clarke and Warwick2001) (Fig. 2). We tested for interdependency among resource harvesting responses using a simple permutation procedure (RELATE; Clarke & Warwick Reference Clarke and Warwick2001, cf. Mantel test) and we did not find any spatial autocorrelation (RELATE sample statistic ρ = −0.03, p = 0.99). As such, we retained household responses as our sampling units for further analyses. Differences in resource harvesting pattern by households among villages were tested for significance with the analysis of similarity (ANOSIM) procedure after creating a similarity matrix using Euclidean distance measures.
Next, we assessed the relationship between the similarity among household responses on resource harvesting and conservation attitude, PA perception and interaction, and sociodemographic variables, by invoking the BIOENV program using normalized Euclidean distance measures (Clarke & Warwick Reference Clarke and Warwick2001). This program sequentially tests for a single variable or a combination of variables that most strongly correlates with the similarity among household responses. All variables for perceptions of PAs and interaction with PAs were included for BIOENV analysis. The sociodemographic variables selected for BIOENV analysis were length of residency in Sulawesi, proportion length of residency at village, family size, primary occupation, average household income, education level and current village (Table 1; Fig. 2). Based on previous studies (Lee et al. Reference Lee, Gorog, Dwiyahreni, Siwu, Riley, Alexander, Paoli and Ramono2005), religious beliefs appeared to affect the extent of wildlife hunting and trade; Christians (largely in North Sulawesi province), as opposed to Muslims, are not against hunting and consumption of wildlife. To account for possible effect of hunting due to religious beliefs, we repeated all the multivariate analyses by excluding the hunting responses. However, since both analyses were qualitatively similar, we present results from all harvesting responses.
All other statistical analyses were performed in SPSS (Statistical Package for Social Sciences version 12; SPSS 2003).
RESULTS
Conservation attitude, PA perceptions and interactions with PA
Because strong within-PA differences in opinions (Table 1) and resource use patterns (Appendix 2, see Supplementary material at URL http://www.ncl.ac.uk/icef/EC_Supplement.htm) existed, we tested for differences at the village level. Of the 660 household interviews, 7%, 23% and 70% expressed opposition, neutrality and support towards the adjacent PAs, respectively. Across 33 villages, we found differences in conservation attitude in five (Pearson χ2 test = 146.30, df = 64, p < 0.001); more households than expected in Batuputih and Batu Angus (TD), Siboang (GS) and Mokaleleo (RA) opposed the establishment of PAs. Further, 44%, 32% and 23% of the households thought that the forest resources in PAs would run out in less than 50 years, between 50 and 100 years, and more than 100 years, respectively. We observed differences in perceived sustainability in almost half (n = 15) of the villages (Pearson χ2 test = 196.82, df = 64, p < 0.001). With respect to PA ownership, 2%, 90% and 6% of the households perceived nobody, government/country and everybody to be owners of the PA, respectively. Across 33 villages, we found differences in the perception on the ownership of PAs in four of them (Pearson χ2 test = 160.32, df = 64, p < 0.001); more households than expected in Batuputih (TD), Siboang (GS), Wuasa (LL) and Lanowulu (RA) perceived the owners of the PA to be nobody and/or everybody. About 12% of the households experienced conflicts with the establishment of PAs, whereas the remaining 88% did not. Across all villages, we found differences in presence/absence of conflict with the establishment of PAs in six of them (Pearson χ2 test = 158.19, df = 32, p < 0.001); more households than expected in Pinasunkulan (GM), Batuputih and Batu Angus (TD), Doloduo (DB), Siboang (GS) and Wuasa (LL) experienced conflicts. Over 83% of the households claimed to sometimes (73%) or frequently (11%) participate in the management of PAs, whereas 16% were never involved in such activity. We observed differences in the extent of participation in PA management in four of the villages (Pearson χ2 test = 160.32, df = 64, p < 0.001). More households than expected in Batuputih (TD) and Siboang (GS) were never involved in management; whereas more households than expected in Batuputih (TD), Doloduo (DB) and Wuasa (LL) were frequently involved in PA management (Table 1).
Resource harvesting patterns
Of the 40 households (6% of total) that hunted wildlife, only nine (23%) were involved in commercial hunting. Reported hunted wildlife included birds, rodents, bats and wild pigs. We found differences in hunting pattern across all villages. More households than expected hunted for subsistence or commercial purposes (Pearson χ2 test = 133.34, df = 64, p < 0.001) in five villages (four are in Northern Sulawesi). Of the households that extracted timber products (15% and 12% for fuelwood and building, respectively), 13% (n = 13) and 70% (n = 54) were collecting fuelwood and timber for building, respectively, for commercial purposes. Of the 16% (rattan) and 3% (palm) of all households that harvested non-timber products, 63% (n = 67) and 28% (n = 5) were trading rattans and palm products, respectively. We observed differences in the collection of timber (Pearson χ2 test > 181.83, df = 64, p < 0.001) and non-timber products (Pearson χ2 test > 218.75, df = 64, p < 0.001) villages, respectively. More households harvested timber and non-timber products than expected in 11 villages, nine of which are located outside Northern Sulawesi. Of the 60 households (9% of total) that had ‘forest gardens’ in the PAs, 8% had land < 1 ha for subsistence farming, 35% had < 1 ha for commercial farming, 2% had 1–5 ha for subsistence farming and 55% had 1–5 ha for commercial farming. Reported crops cultivated included bananas, cocoa, coconut, coffee, cotton, clove, maize, peanut, potato and rice. We recorded differences in having forest gardens or not across all villages (Pearson χ2 test = 257.66, df = 128, p < 0.001); more households have forest gardens than expected in 12 villages (nine within Northern Sulawesi). Seven per cent of all households (n = 46) cleared land for agriculture in the PAs. We found differences in clearing land for agriculture or not among the villages (Pearson χ2 test = 127.92, df = 32, p < 0.001); more households than expected cleared land in seven villages (five in Northern Sulawesi) (Appendix 2, see Supplementary material at URL http://www.ncl.ac.uk/icef/EC_Supplement.htm).
Predictors of local support for PAs
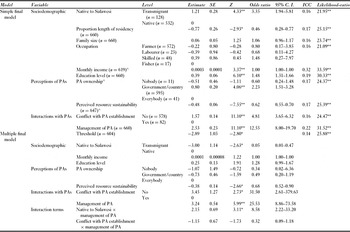
There was an intra-village correlation observed for each predictor ranging from 0.16 (residency in Sulawesi) to 0.32 (average household income per month) (likelihood-ratio χ2 test > 21.09; p < 0.001; Table 2). Single predictor mixed-effects regression analyses showed that residency in Sulawesi, proportional length of residency, average household income per month, education level, perception of the ownership of PAs, perceived forest resource sustainability, presence/absence of conflict with the establishment of PAs and degree of management of PAs were all significant (p < 0.001) determinants of support for adjacent PAs. Households that had higher levels of support for PAs were transmigrants, had higher education level, had higher monthly household income, perceived government/country as owners of PAs, had no conflict with adjacent PAs and were more involved in the management of PAs. Conversely, households that had low levels of support for PAs were those with longer residency in Sulawesi and that perceived forest resources to be more sustainable (Table 2).
Results of the simple and multiple final (see text for model selection procedure) mixed-effects ordinal regression models, of sociodemographic variables, perceptions of PAs and interactions with PAs against the levels of support for the established PAs. Numbers in parentheses represent sample size. SE and 95% CI represent standard error and 95% confidence interval of odds ratio, respectively. ICC represents the intra-cluster (intra-village) correlation. The likelihood-ratio χ2 test indicates whether the random village (i.e. clustering) effect is significant in the model. *p < 0.01; **p < 0.001. ∧ indicates missing data.

Multicollinearity was not detected (tolerance statistic > 0.69) among the 10 variables. The classification tree analysis revealed that possible complex interactions included residency in Sulawesi, average household income per month and the degree of management of PAs. The most parsimonious and optimal model selected by AICc was one that included residency in Sulawesi, average household income per month, education level, perception of PA ownership, perceived forest resource sustainability, presence/absence of conflict with adjacent PAs and degree of management of PAs, as well as two two-way interaction terms (AICc = 633.51; AIC weight = 59.1%; Table 3). Therefore, in our final model, households that supported PAs were those that were native, showed higher level of management of PAs, had no conflict with the PAs and perceived shorter resource sustainability (Table 2). The presence of a significant interaction term suggested that the effects of residency in Sulawesi and degree of PA management on level of support for PAs were interdependent. Specifically, transmigrants with higher level of PA management were more supportive of adjacent PA than natives (Table 2).
Multiple mixed-effects ordinal regression models where Δ AICc < 10. Models are listed in ascending order of AICc and Δ AICc values. Each model has a sample size (N), the number of estimated parameters (K), the log-likelihood function (Log-likelihood), AICc, the difference with the model with the lowest AICc (Δ AICc), and the normalized value based on its Δ AICc (AIC weight). Variables in models include Residency in Sulawesi (N), Proportion length of residency (R), Family size (Z), Occupation (Oc), Monthly income (I), Education level (E), PA ownership (Ow), Perceived resource sustainability (S), Conflict with PA establishment (C) and Management of PA (M), as well as interaction term(s) (indicated by asterisks).

Correlates of illegal resource harvesting
Reported multivariate responses on resource harvesting made by different households showed significant differences among villages (p < 0.01). This indicates that households within each village had similar resource harvesting pattern, but households from one village had distinct harvesting levels compared to households of other villages. Pairwise comparisons among households from different villages revealed that about 36% (n = 12) of all villages had significantly different harvesting responses with at least half of the other villages (ANOSIM pairwise tests; p < 0.05). The BIOENV analysis revealed that the level of support for adjacent PA and the presence/absence of conflict with PA provided the strongest Spearman rank correlation (ρ = 0.40), and hence the greatest combined influence in explaining the intensities of resources extraction.
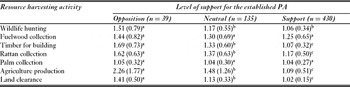
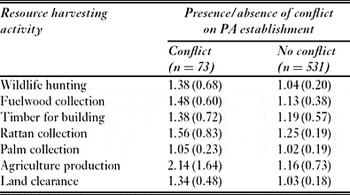
Following up on the above findings, we observed statistically significant differences across support levels in all illegal resource harvesting activities, except fuelwood and palm collection (Table 4; Kruskal-Wallis ANOVA analysis; p < 0.05). Overall, the reported intensities of resource extraction increased with the decrease in the extent of support for PAs. However, households that were neutral and supportive of the adjacent PAs did not appear to have different hunting intensities (Table 4). Dissimilarities between conflict levels were also evident in all types of illegal resources harvesting, except palm collection (Table 5; Mann-Whitney U analysis; p < 0.05). The intensities of resource extraction were also significantly greater with the presence of conflict with the establishment of PAs as compared to absence of conflict (Table 5).
Extent of resource harvesting activities among the three levels of support for the established PAs. Numbers are average score (standard deviation in parentheses). Pairwise differences were tested using Tukey-type test (Zar Reference Zar1999). Levels of support that are not significantly different share the same letter.

Extent of resource harvesting activities between the presence/absence of conflict for PA establishment. Numbers are average score (standard deviation in parentheses).

DISCUSSION
Predictors of conservation attitudes
Mixed-effects ordinal regression is appropriate for the analysis of clustered data, which frequently demonstrates heterogeneity of responses to treatment (Demidenko Reference Demidenko2004). Given that behavioural or sociological data are usually multilevel or hierarchical, consideration of clustering effects is paramount, such as households nested within villages in attitudinal analyses (Table 2). Furthermore, our results on the multiple as well as the single predictor regression analyses, show the significance of simultaneously considering the influence of multiple predictors on the dependent variable. For instance, sociodemographic variables such as education level were considered important predictors of conservation attitude in single predictor regression (Table 2). Conversely, the important predictors of conservation attitude in the final multiple regression model included factors related to PA perceptions and interactions, but not most sociodemographic variables (Table 2). The single predictor regression approach can be misleading, particularly when variables have complex interactions (Table 2).
While sociodemographic variables have conventionally been important predictors of conservation attitudes, other factors, such as interactions with PAs, may also be crucial. For example, recent studies have recorded negative effects on support for PAs owing to perceived ineffectiveness of PA staff (Newmark et al. Reference Newmark, Leonard, Sariko and Gamassa1993), wildlife crop-damage conflicts (Gillingham & Lee Reference Gillingham and Lee2003) and disputes over land rights (Ite Reference Ite1996), among others. Similarly, our findings revealed that there were strong associations between conservation attitude, and perceptions of and interactions with PAs (Table 2). We found that households that expressed support for adjacent PAs also had higher levels of participation in PA management (for example Batuputih, TD). Studies have shown that community management of PAs could create positive effects on the conservation attitudes of local people (Weladji et al. Reference Weladji, Moe and Vedeld2003; Acciaioli Reference Acciaioli, Sodhi, Acciaioli, Erb and Tan2008). This is possibly due to the benefits derived from community resource management where only sustainable resource harvesting is permitted (Adams & Hulme Reference Adams and Hulme2001). For instance, local people living in Rompo and Watumaeta villages adjacent to LL have created local institutions to co-manage the customary land in the park. As a result, some local people from Rompo have been participating in the law enforcement and monitoring of illegal and unsustainable resource harvesting in those areas (Burkard Reference Burkard2002). Locals may show positive conservation attitudes because they feel that forest resources are declining probably due to unregulated harvesting. By being supportive, they apparently recognize the importance of PAs in protecting and sustaining the limited forest resources.
Perhaps more substantially, we find that the presence of conflicts with the establishment of PAs appeared to have strong negative impact on the extent of support for PAs (Table 2). Previous studies have reported on the negative impact of wildlife-related conflicts between PAs and humans, such as crop damage and livestock depredation by wildlife (Oli et al. Reference Oli, Taylor and Rogers1994; Mehta & Heinen Reference Mehta and Heinen2001). But few have documented negative conservation attitudes consequent of issues related to conflicts over land rights (but see Adams & Infield Reference Adams, Infield, Hulme and Murphree2001). Based on our results, disapproval towards PAs in Sulawesi is largely a consequence of the resentment experienced during establishment of the national PA system about 20 years ago, where the affected households (mostly native) had their customary land seized with little or no compensation (World Bank 2001; Suyanto et al. Reference Suyanto, Permana, Khususiyah and Joshi2005). This is particularly the case in Siboang village (GS) where more households than expected did not support PAs and had experienced land-rights conflicts (Table 1). The loss of their customary territory meant that these households no longer have access to the forest resources (such as rattans and timber) which for some families are important sources of materials and income as in Lore Lindu National Park (Burkard Reference Burkard2002; The Nature Conservancy 2002). To make matters worse, with decentralization of state control over forest zones following the post-Reformasi era, there appears to be a surge in the number of unofficial PA forest land claims aimed at challenging the current authority throughout the Indonesian archipelago (World Bank 2001; Contreras-Hermosilla & Fay Reference Contreras-Hermosilla and Fay2005). Owing to the pervasive impact of the past national PA policy, our empirical findings will be particularly relevant in developing measures to resolve land-rights conflicts (see Sodhi et al. Reference Sodhi, Acciaioli, Erb and Tan2008).
Interestingly, there was also a significant positive interaction between residency in Sulawesi and PA management and extent of support for PAs (Table 2). This suggests the importance of complex interactions among variables otherwise undetected in single predictor regression models. Transmigrants who claimed frequent participation in PA management tended to be supportive of the PA. Given their non-native status, transmigrants probably have more restricted access to forest resource than native people (Sah & Heinen Reference Sah and Heinen2001). However, through increasing involvement in managing the PAs, transmigrants could claim legitimacy and have stakes in the forest resources, and in the process generate positive conservation attitudes (Mehta & Kellert Reference Mehta and Kellert1998). More significantly, given that the influx of inmigrants is primarily to seek agricultural lands and work, their resettlement to villages bordering PAs has placed immeasurable pressure on the PAs (for example LL; The Nature Conservancy 2002). Therefore, it will be critical to encourage transmigrants to participate in park management more actively to form more pro-conservation attitudes, particularly in areas with large transmigrant populations. Above all, weak management plans are compromising the effectiveness of PAs across Sulawesi (Lee et al. Reference Lee, Riley and Suyatno1999, Reference Lee, Riley and Teguh2000). Thus, the potential role of local institutions in resource management and conservation education is pivotal.
Predictors of resource harvesting patterns
Contrasting opinions on, relations with and conservation attitudes toward PAs, and resource use among villages has prompted the formulation of different management strategies. Based on our analyses, almost 40% of all villages have distinct resource harvesting trends with at least half of the others. As with other studies elsewhere (Weladji et al. Reference Weladji, Moe and Vedeld2003), we find that village-specific management will likely be effective in Sulawesi.
Despite the significance of studies on how conservation attitude and PA interactions influence resource-use patterns, such critical information is often lacking during the formulation of conservation strategies. Nonetheless, as with previous studies (Newmark et al. Reference Newmark, Leonard, Sariko and Gamassa1993; Holmes Reference Holmes2003), we documented an association between conservation attitude and PA interactions, and reported intensities of resource extractions. The level of support for PAs and the presence/absence of conflict with the establishment of PAs appeared to be the most influential factors in explaining the differences in the extent of resource harvesting among households.
There is an inverse relationship between extent of support for PAs and reported intensities of resource harvest for most illegal anthropogenic activities (Table 4). The presence of conflict seems to have a positive association with the degree of illegal forest resource extraction (Table 5). Owing to the resentment toward perceived unjustified forest management policies, households with conflicts appear to disregard authority. It is possible that the increase in illegal resource harvesting is a form of retaliation that indirectly challenges the state's conservation efforts (Barber Reference Barber1998). As discussed above, the relative importance of these two factors in determining illegal forest resource extraction would have considerable implications in resolving one of Indonesia's most noted conservation conflicts.
Among the cryptic human disturbances, the direct loss of wildlife through hunting indisputably represents one of the most severe threats to wildlife populations in Sulawesi (O'Brien & Kinnaird Reference O'Brien and Kinnaird1996). Worse yet, with an extensive network across the whole island, the wildlife trade in unprotected and protected species in Northern Sulawesi is becoming notoriously prevalent (Lee et al. Reference Lee, Gorog, Dwiyahreni, Siwu, Riley, Alexander, Paoli and Ramono2005). Although there appears to be a significant correlation between reported and observed hunting intensities among the villages, more than 90% of the households claimed to have never hunted. This is contrary to the findings from other studies that subsistence wildlife hunting is widespread in the PAs situated in Northern Sulawesi (i.e. GA and GM; Lee et al. Reference Lee, Riley and Suyatno1999, Reference Lee, Riley and Teguh2000). Similarly, in this study, of the five villages that reported significantly different hunting patterns, four are located in the Northern region of Sulawesi where more households than expected hunted for subsistence or commercial purposes (Appendix 2, see Supplementary material at URL http://www.ncl.ac.uk/icef/EC_Supplement.htm). The low reported local hunting pressure is possibly a consequence of the bias of responses, particularly when concealing illegal exploitation practices (de Boer & Baquete Reference de Boer and Baquete1998). Although hunting activities are reported (and observed) to be relatively more common in PAs in the northern peninsula of the island (Appendix 2, see Supplementary material at URL http://www.ncl.ac.uk/icef/EC_Supplement.htm), religious beliefs cannot explain the disparity in hunting levels among villages. Again, this may be attributed to the inaccurate responses made by households to hide illegal hunting activities. Given the extreme threat of unsustainable hunting pressure in Sulawesi (Lee et al. Reference Lee, Gorog, Dwiyahreni, Siwu, Riley, Alexander, Paoli and Ramono2005), it is pertinent to monitor and understand the dynamics of subsistence/commercial hunting by local communities bordering PAs, especially in Northern Sulawesi.
Agricultural encroachment such as ‘forest garden’ and land clearing can also have dire impacts on the biodiversity in PAs due to habitat loss and degradation. Densities of forest dependent birds have been observed to be negatively affected by reduction in natural habitats (i.e. primary forest) outside PAs in Sulawesi (Sodhi et al. Reference Sodhi, Koh, Prawiradilaga, Darjono, Tinulele, Putra and Tan2005; Lee et al. Reference Lee, Sodhi and Prawiradilaga2007). Furthermore, the escalating and prevalent claims to forest land rights within PAs may also isolate and reduce the area of intact natural forests (Contreras-Hermosilla & Fay Reference Contreras-Hermosilla and Fay2005). The trend of intensive and unsustainable non-commercial selective logging (Lee et al. Reference Lee, Riley and Teguh2000) and commercial rattan harvesting (for example in LL; Siebert Reference Siebert2004) are emerging threats to the ecological intactness of the PAs. Non-timber resource extraction could also indirectly cause declines in wildlife populations by increasing the accessibility of remote areas in PAs to hunters (Peres & Lake Reference Peres and Lake2003). In our study, ‘forest garden’ and land clearing seemed to be more widespread in PAs in the Northern region of the island, while the harvesting of timber and non-timber products appeared to be more common outside the Northern region of Sulawesi (Appendix 2, see Supplementary material at URL http://www.ncl.ac.uk/icef/EC_Supplement.htm). Together, it becomes apparent that for management strategies to be effective they would need to be context and site dependent. Overall, more studies are needed to investigate the ecological effects of unsustainable cryptic human disturbances on tropical biodiversity and ecosystem services.
CONCLUSIONS
Using a simple yet effective questionnaire, we provide a first evaluation of how attitudinal surveys are particularly useful for effective conservation of biodiversity across multiple PAs in Sulawesi. Despite some limitations, several implications regarding the importance of such surveys for biodiversity protection may be drawn from our study. First, the degree of participation in PA management seems to be a relatively strong determinant of conservation attitude (Table 2), implying that encouraging frequent participation in community management may be a promising approach in fostering positive local attitudes towards conservation, particularly for transmigrants. Second, resolving existing land-rights conflicts, which are widespread in Indonesia, will improve overall conservation attitudes, particularly those of the natives. Third, the intensities of illegal cryptic resource harvesting activities (such as wildlife hunting and selective logging) are significantly influenced by negative conservation attitudes and past conflict with PAs (Tables 4 and 5). Actively improving the conservation attitudes of local households and reconciling land-rights conflicts may ease resource extraction pressures. Fourth, the inconsistency in the resource extraction patterns among the villages across all PAs emphasizes the significance of adopting site-specific management strategies for effective governance of natural resources.
While PAs have generally been effective in protecting biodiversity (Bruner et al. Reference Bruner, Gullison, Rice and de Fonseca2001), the ecological intactness of PAs are increasingly being eroded by cryptic anthropogenic disturbances from local communities. Unless the livelihood, values, and attitudes of local people are considered during conservation planning and/or formulation of management strategies, the long-term survival of PAs will be undermined (MacKinnon et al. Reference MacKinnon, MacKinnon and Thorsell1986; Adams et al. Reference Adams, Aveling, Brockington, Dickson, Elliott, Hutton, Roe, Vira and Wolmer2004; Struhsaker et al. Reference Struhsaker, Struhsaker and Siex2005; Sodhi et al. Reference Sodhi, Brooks, Koh, Acciaioli, Erb, Tan, Curran, Brosius, Lee, Patlis, Gumal and Lee2006). We believe that our findings provide valuable insights into developing more effective management plans for PAs and the conservation of globally important tropical biodiversity across the biologically diverse yet critically threatened Indonesian Archipelago.
ACKNOWLEDGEMENTS
We thank Indonesian Institute of Sciences (LIPI) and the Directorate General of Forest Protection and Nature Conservation (PHKA; Ministry of Forestry) for providing the research permit to work in the protected areas of Sulawesi. We also thank David Bickford, Lian Pin Koh, Mary Rose C. Posa, Michaela Zint and three anonymous reviewers for comments on earlier drafts. We are grateful to D. Dwi-Putra and I. Tinulele from the Celebes Bird Club for their assistance in the field. TML thanks Walter Jetz for his support while this manuscript was prepared. This study was supported by the National University of Singapore (R-154-000-210-112). NSS thanks the Sarah and Daniel Hrdy Fellowship for support while this paper was prepared.