Hospital staff, especially infection preventionists (IPs) and nurses, play crucial roles in patient safety and quality improvement efforts, but quantitative assessments of the correlation between staffing levels and rates of healthcare associated infections (HAIs) are scarce. In fact, 2 systematic reviews Reference Stone, Pogorzelska, Kunches and Hirschhorn1,Reference Mitchell, Gardner, Stone, Hall and Pogorzelska-Maziarz2 evaluated >1,000 publications on hospital staffing levels and HAIs and found only 3 studies that evaluated the effect of IP staffing levels on HAI rates. Reference Geubbels, Wille, Nagelkerke, Vandenbroucke-Grauls, Grobbee and de Boer3–5 Furthermore, one of these studies by Richet et al Reference Richet, Bengachir and Brown4 was a survey, and the results of the other 2 were conflicting. Additionally, most of the studies involving correlations of staffing levels and HAIs examined only 1 type of HAI. Reference Stone, Pogorzelska, Kunches and Hirschhorn1,Reference Mitchell, Gardner, Stone, Hall and Pogorzelska-Maziarz2 Whether increases in IP or nurse staffing correlate with decreases in HAI has not been quantitatively evaluated, and the threshold at which these 2 relate is not known. Reference Vassallo and Boston6,Reference Bartles, Dickson and Babade7 Finally, although an excellent review of the necessary infrastructure for infection prevention and healthcare epidemiology projects provides helpful insight on specific hospital epidemiologist staffing levels and reimbursement, it made no specific recommendations regarding IP-to-patient ratios. Reference Bryant, Harris and Gould8
Many hospital epidemiology and infection prevention departments are underresourced, Reference Wright, Ostrowsky, Fishman, Deloney, Mermel and Perl9–Reference Hessels, Kelly, Chen, Cohen, Zachariah and Larson12 and the issue of staffing levels was the most urgent and common concern expressed by IPs in a recent survey. Reference Landers, Davis, Crist and Malik13 Furthermore, the current shortage of IPs is expected to worsen; >50% of IPs are nearing retirement age, with no indication of a similar number of younger replacements. Reference Vassallo and Boston6 Additionally, the nature of their work and interactions may increase the risk of burnout among IPs and epidemiologists. Reference Bearman, Hota and Haessler14
The relationships among staffing levels likely exist across a spectrum, with more or fewer staff being associated with fewer or more HAIs depending on many confounding factors. IP impact and HAI rates are influenced by the complex interplay between nurse staffing, limited and competing resources, IP experience, nonsurveillance workload, mandatory HAI reporting burden, and executive-level support and priorities.
We evaluated the relationships among IP staffing levels and 10 different HAIs over a 9-year period, during which IP-to-patient staffing ratios fluctuated widely. Because nursing levels additionally influence the incidences of HAIs, we also evaluated this relationship.
Setting and patients
Rochester General Hospital is a 528-bed teaching hospital in Rochester, New York. Here, 42% of the rooms are semiprivate, resulting in 59% patients in shared rooms. The hospital has 60 adult intensive care unit (ICU) beds, 14 special nursery or neonatal ICU beds, the nation’s eleventh busiest emergency department, and its second largest destination-therapy ventricular-assistance device center.
With the exception of ending contact precautions for methicillin-resistant Staphylococcus aureus (MRSA) and vancomycin-resistant enterococci (VRE) in 2017, and a 4-month CAUTI reduction campaign in 2018, the IP department had been unable to complete major initiatives or projects. This situation was due to frequent staff turnover and shortages, increased mandatory reporting burden, and competing priorities. Therefore, HAI-related infection control policies and practices remained stable and essentially unchanged over the study period.
Notably, the nationally recommended staffing level for IPs is between 1 IP to 70 inpatient beds and 1 IP to 100 inpatient beds. Reference Bartles, Dickson and Babade7,Reference Pogorzelska-Maziarz, Gilmartin and Reese15 Over the complete observation period (2012–2021), the IP to patient ratios ranged from 7–8 full-time equivalents (FTE), corresponding to a ratio of 1:75 (referred to as the “recommended level”) to ≤2 FTEs, corresponding to a ratio of 1:264 (referred to as “critically low”). The degree of experience among the IPs also varied substantially over the observation period. For example, for most of 2015 and 2016, only 2 nurses were designated as acting IPs, and neither had past experience or certifications in infection control. Similarly, in that same period, no dedicated healthcare epidemiologist was present. Instead, the chief of the infectious diseases unit provided ad hoc assistance during severe HAI clusters or outbreaks. In August 2016, a highly experienced IP with infection control certification and a designated healthcare epidemiologist, who was also a fellow of the Society of Healthcare Epidemiologists of America, joined the staff.
Methods
HAI surveillance was conducted for all patients admitted from July 1, 2012, to February 1, 2021, during their entire hospital admission. We used the Centers for Disease Control and Prevention (CDC) standardized National Health Safety Network (NHSN) definitions for 10 HAIs and laboratory events. 16 These included CAUTI, CLABSI, MRSA bloodstream infection, hospital-onset carbapenem-resistant Enterobacteriaceae (CRE), and hospital-onset Clostridioides difficile (HO-CDI). Surgical site infections (SSIs) included those following coronary artery bypass grafting (CABG), abdominal hysterectomy (H0YST), colon surgery (COLO), prosthetic hip replacement (HPRO), and prosthetic knee replacement (KPRO). According to the NHSN, raw rates were reported as number of infections divided by the number of device days ×1,000 for CAUTI and CLABSI. For CABG, COLO, HPRO, HYST and KPRO, raw rates were reported as infections per 100 procedures. For laboratory events such as CRE infection, HO-CDI, and MRSA infection, raw rates were calculated as cases per 1,000 patient days.
When available, standardized infection ratios (SIRs) were also used. The SIR compares the actual number of HAIs at each hospital to the predicted number of infections. SIRs are not calculated when the number of predicted infections is <1.0.
For IP staffing levels, we used the number of FTE positions filled during the reporting periods. For nurse staffing levels, we used total person hours submitted to the payroll division.
Assessments of the relationship between staffing levels and HAI rate were performed using 2 separate approaches by 2 independent statisticians. First, data were analyzed using Shewhart control charts and rules for calculating upper and lower control limits. Reference Koutras, Bersimis and Maravelakis17 Staffing changes were superimposed on these control charts. General linear regression was performed using Minitab software.
Second, we sought to determine whether there was a threshold effect at a particular IP staffing level using methods similar to those of Hugonnet et al. Reference Hugonnet, Uçkay and Pittet18,Reference Hugonnet, Chevrolet and Pittet19 Because stratifying by consecutive integer of FTE IP (ie, 1, 2, 3 …) would not cover sufficiently long durations to generate statistically analyzable quantities of infections or minimize effects of seasonal bias, staffing levels were stratified into 3 groups: critically low (2–3 FTE), below recommendations (4–6 FTE), and at recommended staffing levels (7–8 FTE). SIRs in those categories were compared using the t test. Raw infection rates were compared using the Poisson test, a statistical test more appropriate for rare events. Tests were performed in the R computing environment. 20 P values for HAIs and monthly mean nursing FTE hours were calculated by performing regression analysis with the R glm module. For regression analysis, the P values (ie, significance) of the associations between FTE hours and infections were examined using t tests and Poisson tests. For this analysis, the data during the coronavirus disease 2019 (COVID-19) pandemic (March 1, 2020, onward) were not included.
Results
Patient census and staffing levels
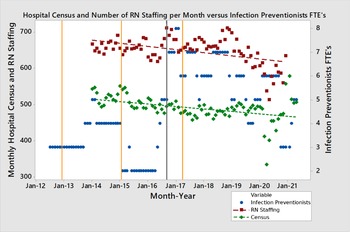
The observation period encompassed periods of non-outbreaks as well as 3 outbreaks (Candida auris, scabies, and Legionella). Periods of critically low and recommended IP staffing levels had durations of 28 and 48 mostly consecutive months, respectively (Fig. 1). Both encompassed all 4 seasons. The remaining 32 months were characterized by medium staffing levels.
Hospital census and the number of RN staffing per month versus infection preventionists FTEs. Note. For infection preventionists, green diamonds represent the hospital census and red squares indicate RN staffing. From left to right, orange lines indicate outbreaks of scabies, Legionella, and Candida auris respectively. Green blue dots indicate FTEs. RN, registered nurse; FTE, full-time equivalent.

The average daily inpatient census across the entire observation period was 490 inpatients, resulting in a total of 1,609,650 million patient days of surveillance. The census decreased slightly, but not significantly, over the study period. The mean daily census was 504.5 inpatients (SD, 10.7) during the first 24 months and was 492.2 inpatients (SD, 31.3) during the last 24 months of the study (P = .07).
The mean monthly nursing hours decreased from 661 hours (SD, 14.2) at the beginning to 580.7 hours (SD 33.2) at the end of the study period (Fig. 1). That decrease, unlike the reduced inpatient census, was statistically significant (P < .001).
Relationship between HAIs and infection preventionist staffing
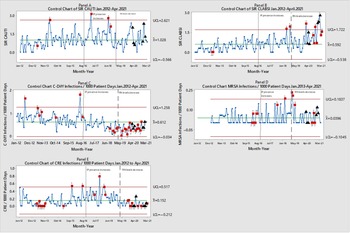
The highest CAUTI SIR coincided with a period of lowest IP staffing levels and experience. The SIR did not trend downward following the addition of a certified IP and a healthcare epidemiologist (Fig. 2, panel A). Similarly, increased IP staffing was not associated with sustained downward time trends in CLABSI or MRSA (Fig. 2, panels B and D). Mean HO-CDI and CRE rates were 0.61 and 0.15 infections per 1,000 patient days, respectively, and these rates trended downward with increased IP presence (Fig. 2, panels C and E).
Panels A–E depict the control charts for CAUTI and CLABSI SIRs, and the rates of HO-CDI, MRSA infections, and CRE infections. The mean SIR or rate for each is shown in the middle of the y-axis. For example, the mean SIR for CAUTI was 1.028 over the entire observation period. Note. CAUTI, catheter-associated urinary tract infection; CLABSI, central-line–associated bloodstream infection; MRSA, methicillin-resistant Staphylococcus aureus; HO-CDI, hospital-onset Clostridium difficile infection; CRE, carbapenem-resistant Enterobacteriaceae; SIR, standardized infection ratio. Black triangles indicate data points from COVID-19 surges removed from control limit calculations; red squares with numeric labels represent violation of control chart rules and Nelson rule number.

Supplementary Figure 1 depicts regression analysis of the IP levels versus HAI SIRs or rates and corroborates the trends and relationships for HO-CDI and CRE observed on the control charts in Figure 2. However, the CLABSI SIR regression slope continued to increase despite increased IP presence (Fig. 2, panel B).
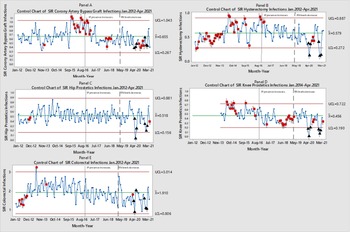
We also examined the relationship between IP staffing and 5 types of SSI (Fig. 3 and Supplementary Fig. 2 online). The highest SIRs for CABG and HYST coincided with periods of lowest IP staffing and least experience. Lower SIRs of 4 SSIs (CABG, HYST, KNEE, and COLO) coincided with increased IP presence (Fig. 2, panels A, B, D, and E), and these SIRs trended downward despite the reduced presence of nurses.
Panels A–E depict the control charts for CABG, HYST, HPRO, KPRO, and COLO SIRs. The mean SIR or rate for each is shown in the middle of the y-axis. For example, the mean SIR for CABG was 0.655 over the entire observation period. Note. CABG, coronary artery bypass graft; COLO, colonoscopy; HPRO, hip prosthesis; HYST, hysterectomy; KPRO, knee prosthesis; SIR, standardized infection ratio. Black triangles indicate data points from COVID-19 surges removed from control limit calculations; red squares with numeric labels represent violation of control chart rules and Nelson rule number.

Subgroup stratification and threshold effect
Stratification of IP staffing levels into critically low, below recommended staffing levels, and at recommended staffing levels to evaluate for a potential threshold effect did not reveal a distinct cutoff or threshold for any SIR except CLABSI. Higher IP levels were associated with lower CLABSI SIRs during the nonpandemic period (P value for 2-tailed t test = .01) (Supplementary Table 1A online). The rates of 6 types of HAI (HO-CDI, MRSA, CABG, HPRO, KPRO, and HYST) are shown in Supplementary Table 1B (online). HO-CDI rates were significantly lower when there were recommended IP staffing levels compared to critically low levels. For both HO-CDI and CLABSI, pre-COVID-19 rates were ∼40% lower during periods of high IP staffing compared to periods of low IP staffing. The effect persisted whether no directional correlation was assumed, as in the 2-tailed test, or whether a negative correlation between staffing level and infections was examined, as in the 1-tailed test.
Considering nursing separately, lower rates of 3 types of HAI (CLABSI, HO-CDI, and CAUTI) and 1 type of SSI (HYST) were associated with increased nursing staff (measured as full-time employee hours), with CAUTI most affected (Supplementary Table 2 online). However, when data from the pandemic months were included, that effect was also lost as nursing shortages developed.
Discussion
No recent studies have correlated the increases in IP staffing with decreases in HAIs; therefore, the threshold at which these 2 factors correlate is not known. Reference Vassallo and Boston6,Reference Bartles, Dickson and Babade7 Older determinations of optimum IP-to-patient ratios were based on surveys, a Delphi method, or combinations of surveys and task analysis. Reference Vassallo and Boston6,Reference Bartles, Dickson and Babade7,Reference Wright, Ostrowsky, Fishman, Deloney, Mermel and Perl9,Reference Haley, Quade, Freeman and Bennett21–Reference van den Broek, Kluytmans, Ummels, Voss and Vandenbroucke-Grauls24 Our study is notable for its size and duration and because it begins to quantitatively inform this knowledge gap for all 10 major types of HAI using standardized definitions. Increased presence and experience of an IP and presence of a hospital epidemiologist coincided with lower rates or SIRs of 3 of 5 types of HAI and 4 of 5 types of SSI. However, as of November 18, 2021, rates of 8 of these 10 HAIs and SSIs continued to climb amid the presence of experienced IPs, suggesting that the effects of the pandemic (eg, increased workload, hospital overcapacity, and nursing shortages) could have been overshadowing any positive effect of increased IP presence. These HAI trends are consistent with a recent report from the NHSN showing that HAI rates increased during the pandemic, especially CLABSI rates. Reference Weiner-Lastinger, Pattabiraman and Konnor25
Having lower SSIs when there are more IPs, certified IPs, and a hospital epidemiologist is biologically plausible for several reasons. First, lowering SSIs involves compliance with increasingly complex multicomponent prevention bundles. These bundles require expertise and considerable time for IPs to disseminate, emphasize, and monitor for compliance. Second, SSIs are one of the most subjective and labor-intensive NHSN definitions for surveillance; they require extensive chart review and interpretation of operative and clinical notes to determine whether criteria are met. With more time to thoroughly investigate cases, more accurate case detection can result. When IPs began to meet weekly with the certified IP directors and the epidemiologist to review each SSI case in detail, reductions in SSIs followed. Third, most SSIs originate in the operating theater; thus, ambient nursing levels or IP presence on the inpatient wards are less likely to influence SSI rates. Last, SSI is one of the most labor-intensive and subjective NHSN definitions. During periods of critical understaffing, IPs may focus on less labor-intensive definitions, leading to apparent reductions of those less labor-intensive determinations. SSIs can artifactually increase if IPs do not have time to review all exclusion criteria and remove cases that are present at the time of surgery.
One explanation for why higher IP staffing levels coincided with fewer CRE infections, HO-CDIs, and CLABSIs, compared to other HAIs may be in the methodology of preventing these infection types. Whereas the modifiable risk factors for SSIs may remain predominantly in periprocedure bundles, the operating room, and often prior to hospitalization, the risk mitigation for CLABSIs, HO-CDIs, and CRE infections may rely on routine IP inpatient engagement with frontline healthcare providers. Accurate CRE surveillance requires additional time and expertise, and having more IPs enabled us to prioritize CRE surveillance for one of the FTEs. Notably, in US national point-prevalence studies, HO-CDI was one of the few types of HAI that did not decrease during the surveillance period of 2011 to 2015. Reference Magill, Edwards and Bamberg26,Reference Magill, O’Leary and Janelle27 Therefore, experts have advocated for increased focus on reducing HO-CDIs. Reference Magill, Edwards and Bamberg26,Reference Magill, O’Leary and Janelle27 Nevertheless, no studies considered the relationship between HO-CDI and IP staffing levels, and the only 2 systemic reviews that exist on the topic of HAI and staffing levels did not find any IP HO-CDI investigations. Reference Stone, Pogorzelska, Kunches and Hirschhorn1,Reference Mitchell, Gardner, Stone, Hall and Pogorzelska-Maziarz2 Our study may be the first to quantify that relationship.
Only 3 studies (all >14 years old) looked at IP levels and HAI rates, and each must be considered separately due to their mixed results. The UK group found that higher IP staffing levels were associated with lower rates of hospital onset neonatal bacteremia. 5 Our findings were similar. Geubbels et al Reference Geubbels, Wille, Nagelkerke, Vandenbroucke-Grauls, Grobbee and de Boer3 found that having more IPs was associated with lower risk for HPRO, but the difference was not statistically significant. The only variable that correlated with a lower risk of HPRO in their study was the volume of procedures performed at the facility. Similarly, we found that the frequency of HPRO infections was inversely correlated with IP levels, but not significantly. Richet et al Reference Richet, Bengachir and Brown4 found that the isolation of MRSA increased when fewer IPs were present. Conversely, we found that MRSA rates remained unchanged despite fluctuations in IP levels.
Furthermore, 19 studies examined the relationship between nurse staffing levels and HAIs, but only 2 used HAI definitions were consistent with recent CDC/NHSN definitions. Of those, one found statistically significant reductions in CLABSI when there were more nurses but not for CAUTI. Reference Stone, Mooney-Kane and Larson28 Another did not find a statistically significant association between nursing levels and either CLABSI or CAUTI. Reference Tauntoun, Kleinbeck, Stafford, Woods and Bott29 We found that rates of HO-CDI were lower when there were more nurses, but the effect did not attain significance. However, CAUTI was significantly lower when there were more nurses, but after the pandemic started the effect was lost.
Our study had several limitations. No causal relationships can be inferred due to its quasi-experimental design and lack of confounder control. Similarly, it is difficult to differentiate the effect of staffing levels from other influences and confounders. Only a single institution was included, but using SIRs helped adjust for facility-level factors and increased generalizability. The presence of semiprivate rooms limits the generalizability of our findings to hospitals with all private rooms. Surgical decolonization and prophylaxis practices were not standardized across each surgical subspecialty. These results could have been influenced by other factors such as level or administrative support, amount of IP time spent on initiatives, external reporting requirements, and increased reliance on nonpermanent nursing staff in the final months of observation. However, with the exception of reporting requirements, which tended to increase over the observation period, administrative support and time spent of initiatives remained fairly constant. Last, 2015–2016 can be considered an atypical period given that no true IPs (only acting IPs) were present nor was a hospital epidemiologist on staff. However, in real-world scenarios atypical periods are likely to occur. We believe that the inclusion of these atypical periods is more reflective of real-world scenarios may make our findings more generalizable.
Despite these limitations, this study provides useful information for resource allocation and patient safety. These data are pertinent given the ongoing shortages of IPs and nurses. The dearth of IPs may be more severe in other countries in addition to the United States. Reference Zingg, Mutters, Harbarth and Friedrich30 Recognizing these shortages, some have launched certifications for traditionally non-IP staff (eg, environmental services or surgical staff) as infection prevention extenders. Reference Vassallo and Boston6,31,Reference Knighton, Gilmartin and Reese32 Going forward, the most effective infection prevention programs will likely require involvement from all types of hospital staff.
Supplementary material
To view supplementary material for this article, please visit https://doi.org/10.1017/ice.2021.507
Acknowledgments
Financial support
No financial support was provided relevant to this article.
Conflicts of interest
All authors report no conflicts of interest relevant to this article.