Summations
• There is no significant association between HTR2A–1354C/T and schizophrenia (SCZ) in the overall population using five genetic models.
• There is no significant association between HTR2A–1354C/T polymorphism and SCZ in the subgroups of Caucasian population and Asian population using five genetic models.
• There is no significant association between the HTR2A–1354C/T polymorphism and bipolar disorder using five genetic models.
Considerations
• We may have lost the opportunity to obtain a larger sample size and increase statistical power because of the exclusion of all studies published in other languages.
• The SCZ and BD diagnostic standard, as well as the source of controls, were not found to be similar in our study, suggesting selection bias in our study.
• There is only one article concerning the Asian population and SCZ, and all of the researches of BP are Caucasian. This might imply that the representation of our results was not prominent enough. More research on other ethnicities and different countries should be added into future studies.
Introduction
Since Kraepelin first proposed the dichotomy in 1917, SCZ and bipolar disorder (BD) have been divided into two groups of psychosis. This classification was found to be useful to resolve some questions in clinical, epidemiological and treatment research about the two psychiatric disorders. The lifetime prevalence of SCZ and point prevalence of BD were ∼0.3–0.7% (Reference Van Os and Kapur1) and 4% (Reference Ketter2), respectively. However, in recent decades, researchers have found some overlap between these two psychoses with regard to clinical symptoms (Reference Kravariti, Dixon, Frith, Murray and McGuire3–Reference Van Os, Gilvarry and Bale6) and genetic aetiology research, which have challenged the strict dichotomy between these two diseases (Reference Cardno, Rijsdijk, Sham, Murray and McGuffin7,Reference Craddock, O'Donovan and Owen8). Both twin and family-based data shared genetic susceptibility loci for SCZ and BD (Reference Shih, Belmonte and Zandi9–Reference Maier, Lichtermann and Minges14). Moreover, linkage and association studies also indicated some overlaps in the genetic aetiology of these disorders (Reference Craddock, O'Donovan and Owen8,Reference Craddock, O'Donovan and Owen15–Reference Olgiati, Mandelli and Lorenzi17). Recently, GWAS researches also identified many of the risk alleles of SCZ, which have also been implicated in BD (Reference Williams, Craddock and Russo18).
Serotonin (5-hydroxytryptamine; 5-HT) is a neurotransmitter that affects a wide variety of sensory and motor cortical functions. Disturbances of the serotonergic pathways have been identified in many psychiatric disorders (Reference Veenstra-VanderWeele, Anderson and Cook19–Reference Hansenne, Pitchot and Ansseau21). Researchers have hypothesised that abnormalities in serotonergic neural transmission is a susceptibility factor for SCZ (Reference Meltzer, Li, Kaneda and Ichikawa22,Reference Geyer and Vollenweider23). Among the numerous serotonergic candidates, the serotonin 2A receptor (HTR2A, also known as 5-HT2A) has been extensively studied as a functional candidate in the pathogenesis of neuropsychiatric disorders (Reference Hoyer, Clarke and Fozard24). An increased number of 5-HT2A receptors were found in the frontal cortex of depressed patients upon post-mortem analysis of the brain (Reference Yates, Leake, Candy, Fairbairn, McKeith and Ferrier25), and 5-HT2A receptors were extensively investigated as important sites of action for atypical antipsychotic agents (Reference Meltzer, Massey and Horiguchi26).
The HTR2A gene, encoding the HTR2A receptor, is located on chromosome 13q14–21 (Reference Hsieh, Bowcock and Farrer27). Several polymorphisms in the 5-HT2A gene have been identified, and 1354C/T is one of the most extensively studied polymorphisms. However, in accordance with the statistical result from the meta-analysis of 1354C/T data provided in the Schizophrenia Gene Database of Schizophrenia Research Forum (SzGene; http://www.schizophreniaforum.org/res/sczgene/default.asp), there is no evidence to show any association between the HTR2A–1354C/T polymorphism and SCZ. Moreover, researchers also found no association between HTR2A–1354C/T and BP (Reference Arranz, Erdmann and Kirov28–Reference Ghosh, Sanjeev, Kiran Kumar, Nithin Krishna and Purushottam31). In contrast, other studies (Reference Ranade, Hader and Joel32,Reference Kumar, Purushottam and Kubendran33) have reported that the 1354C/T polymorphism in the HTR2A gene is associated with BD. Therefore, these research results are either inconclusive or inconsistent. Considering the relatively small sample size of most studies, the fact that there has not yet been a systematic review or meta-analysis on the association between HTR2A–1354C/T and BD, and that more studies were found regarding the effects of HTR2A–1354C/T on SCZ, a meta-analysis of the association between HTR2A–1354C/T and BD and SCZ was deemed necessary. To determine whether there is an association between the HTR2A–1354C/T polymorphism and BD or between such polymorphism and SCZ, and whether the HTR2A–1354C/T polymorphism was the common risk factor of BPD and SCZ, we performed the current meta-analysis.
Methods
Search strategy
PubMed, Embase, HuGENet and SzGene were searched up to July 2012 using the following keywords: ‘HTR2A’, ‘5-HT2a’, ‘1354C/T’, ‘His452Tyr’, ‘rs6314’, ‘schizophrenia’, ‘bipolar’, ‘polymorphism’ and ‘SNP’. References from the retrieved articles were further searched to identify any potentially missed articles.
Inclusion and exclusion criteria
The studies included met the following criteria: (a) focused on the association between HTR2A–1354C/T polymorphism and SCZ or between that polymorphism and BD; (b) presented original data; (c) published case–control studies; (d) provided enough data to calculate the results; (e) control subjects were obtained from a healthy population or people without any diseases relevant to psychiatric disorders; and (f) if there was an overlap with another study, the most recently described sample and/or the most comprehensive research was selected.
Exclusion criteria: (a) studies not written in English; or (b) genotype distribution of the control subjects was not found in Hardy–Weinberg equilibrium (HWE).
Data extraction
Two independent reviewers extracted the following information from each eligible study: author's name, year of publication, nationality, ethnicity, sample size of cases and controls, diagnostic criteria of cases, source of controls, disease type and genotyping methods. In addition, allele frequencies and genotype distributions were determined for cases and controls. If there were no data about allele frequencies, they were calculated from the genotype distributions. Any disagreements were resolved by consensus.
Statistical analysis
Hardy–Weinberg equilibrium (HWE) of genotype distribution in control subjects was calculated by Pearson's Square (Reference Egger, Davey Smith, Schneider and Minder34). To have a complete comparison to assess the strength of the relationship, pooled odds ratios (ORs) with the corresponding 95% confidence intervals (CIs) were calculated from the data given in the eligible studies. The five following genetic models of analysis were used: allele frequencies model (T vs. C), dominant genotype model (TT + TC vs. CC), recessive genotype model (TT vs. TC + CC), co-dominant genotype model (TC vs. CC) and homozygote genotype model (TT vs. CC). The pooled OR was estimated using either the fixed-effects (FE) model or the random-effects (RE) model, according to the level of heterogeneity. Subgroup analysis was performed by ethnicity, comparing Asians and Caucasians.
The Cochrane Q test and the inconsistency index (I 2) were used to assess the heterogeneity. If p < 0.10 or I 2 > 50% denoted heterogeneity across studies, the RE model was used. Otherwise, the Mantel–Haenszel method in the FE model was chosen. The possible publication bias was investigated using the funnel Begg's plot and further assessed by the method of Egger's linear regression test and Z-test. A p-value below 0.05 for both tests was deemed evident of publication bias. For sensitivity analysis, the summary ORs (95% CIs) were recalculated by removing any of the studies, respectively. STATA 11.1 was used to process all data in the study.
Results
Selection process and study characteristics
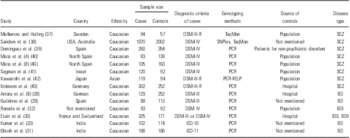
A total of 15 relevant publications (including 17 studies) were retrieved for further identification. Among these, one publication (Reference Arranz, Li and Munro35) was excluded because it included data that overlapped with another study (Reference Arranz, Collier and Munro36), and it could not provide complete information by itself. After calculating HWE in control subjects of each potential study, two studies (Reference Arranz, Erdmann and Kirov28,Reference Arranz, Collier and Munro36) were excluded as a result of departure from HWE. Therefore, this meta-analysis included data reported in 13 articles that consisted of 6106 subjects (2953 patients and 3153 controls) about SCZ, and 1851 subjects (923 patients and 928 controls) about BD (Table 1) (Reference Arranz, Erdmann and Kirov28–Reference Kumar, Purushottam and Kubendran33,Reference Melkersson and Hulting37–Reference Erdmann, Shimron-Abarbanell and Rietschel43).
Characteristics of the studies included in the meta-analysis

BD, bipolar disorder; DSM-III-R, the Diagnostic and Statistical Manual of Mental Disorders, Third Edition, Revised; DSM-IV, fourth edition of the Diagnostic and Statistical Manual of Mental Disorders; ICD-9, International Classification of Diseases-9; ICD-10, International Classification of Diseases-10; PCR–RELP, polymerase chain reaction–restriction fragment length polymorphism; SCZ, schizophrenia.
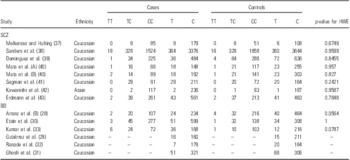
The source of controls in each study was different. There were six population-based and four hospital-based studies, although the four studies did not contain any information about the basis. SCZ and BD were determined by using standardised diagnostic criteria, including the Diagnostic and Statistical Manual of Mental Disorders, Third Edition, Revised (DSM-III-R); Diagnostic and Statistical Manual of Mental Disorders, Fourth Edition (DSM-IV); International Classification of Diseases-10 (ICD-10); and International Classification of Diseases-9 (ICD-9). The genotype and allele distributions of each case–control study are shown in Table 2. Among these 13 articles, one article (Reference Mata, Arranz and Patino40) contained two independent studies, and therefore the data of genotype and allele distributions were extracted into two separate studies.
Distribution of HTR2A–1354C/T genotype and allele between cases and controls

BD, bipolar disorder; HWE, Hardy–Weinberg equilibrium; SCZ, schizophrenia.
Quantitative synthesis
Meta-analysis results of the association between the HTR2A–1354C/T polymorphism and SCZ
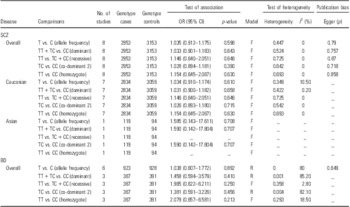
When all of the extracted data were pooled, a total of 2953 SCZ cases and 3153 controls from eight studies had genotyping results (Table 3). No association could be found between the HTR2A–1354C/T polymorphism and SCZ (T vs. C, OR = 1.035, 95% CI = 0.912–1.175, p = 0.596; TT + TC vs. CC, OR = 1.033, 95% CI = 0.901–1.183, p = 0.643; TT vs. TC + CC, OR = 1.146, 95% CI = 0.64–2.051, p = 0.646; TC vs. CC, OR = 1.028, 95% CI = 0.894–1.181, p = 0.390; and TT vs. CC, OR =1.154, 95% CI = 0.645–2.067, p = 0.630, respectively; Fig. 1).
Meta-analysis of HTR2A–1354C/T and the risk of SCZ and BD with the five genetic models, testing for heterogeneity and publication bias

BD, bipolar disorder; F, fixed-effects model; R, random-effects model; SCZ, schizophrenia.
The forest plot of the association between the HTR2A–1354C/T polymorphism and schizophrenia by ethnicity under the Allele frequency model (T vs. C) with fixed-effects model for each of the published studies.

The meta-analysis included seven studies (2834 cases and 3059 controls) on Caucasian populations. The results revealed that there was no association between the HTR2A–1354C/T polymorphism and SCZ in the Caucasian population (T vs. C, OR = 1.034, 95% CI = 0.910–1.174, p = 0.61; TT + TC vs. CC, OR = 1.031, 95% CI = 0.900–1.182, p = 0.658; TT vs. TC + CC, OR = 1.146, 95% CI = 0.64–2.051, p = 0.646; TT vs. TC + CC, OR = 1.026, 95% CI = 0.893–1.180, p = 0.715; and TT vs. CC, OR = 1.154, 95% CI = 0.645–2.067, p = 0.630, respectively).
Only one study (Reference Kawanishi, Hanihara and Shimoda42) (119 cases and 94 controls) in the Asian population was identified, which showed that there was no association between the HTR2A–1354C/T polymorphism and SCZ. In view of that the TT genotype was not present in the study, ORs with CI were calculated with the following models: T vs. C, TT + TC vs. CC, and TC vs. CC. (T vs. C, OR = 1.585, 95% CI = 0.143–17.611, p = 0.708; TT + TC vs. CC, OR = 1.590, 95% CI = 0.142–17.804, p = 0.707; and TC vs. CC, OR = 1.590, 95% CI = 0.142–17.804, p = 0.707, respectively).
Meta-analysis results of the association between the HTR2A–1354C/T polymorphism and BD
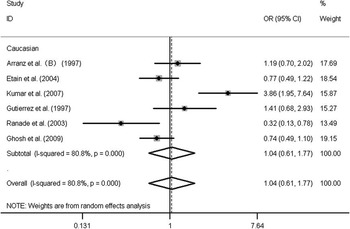
Six articles reported data on the association between BD and the HTR2A–1354C/T polymorphism (Table 3), three of which simply provided the allele frequency without the corresponding genotype frequency (Reference Gutiérrez, Bertranpetit and Collier29,Reference Ghosh, Sanjeev, Kiran Kumar, Nithin Krishna and Purushottam31,Reference Ranade, Hader and Joel32). Therefore, for the allele-based analysis of the HTR2A–1354C/T polymorphism, the meta-analysis was performed with six studies (923 cases and 928 controls), using the T allele versus C allele model, whereas for genotype-based analysis of the HTR2A–1354C/T polymorphism the meta-analysis was performed with three (Reference Arranz, Erdmann and Kirov28,Reference Etain, Angela and Isabelle Roy30,Reference Kumar, Purushottam and Kubendran33) studies (367 cases and 391 controls), using the other four models (dominant model, co-dominant model, recessive genotype model and homozygote genotype model). We did not detect an association between the HTR2A–1354C/T polymorphism and BD (T vs. C, OR = 1.038, 95% CI = 0.607–1.772, p = 0.892; I 2 = 80% for heterogeneity; RE model; TT + TC vs. CC, OR = 1.458, 95% CI = 0.594–3.579, p = 0.41; I 2 = 85.2% for heterogeneity; RE model; TT vs. TC + CC, OR = 1.965, 95% CI = 0.622–6.211, p = 0.25; I 2 = 2.8% for heterogeneity; FE model; TC vs. CC, OR = 1.381, 95% CI = 0.591–3.226, p = 0.456; I 2 = 82.1% for heterogeneity; RE model; and TT vs. CC, OR = 2.079, 95% CI = 0.657–6.581, p = 0.213; I 2 = 18.5% for heterogeneity; FE model; Fig. 2).
The forest plot of the association between the HTR2A–1354C/T polymorphism and bipolar disorder by ethnicity under the Allele frequency model (T vs. C) with random-effects mode for each of the published studies.

Test of heterogeneity and sensitivity analysis
For the overall analysis of the association between the HTR2A–1354C/T polymorphism and SCZ, there was no evidence to confirm heterogeneity in the included studies, as the outcome of the inconsistency index (I 2) in any of the five models was 0%. I 2 for heterogeneity was also not significant under all comparisons in the subgroup analyses of the Caucasian population. For the analysis of the association between the HTR2A–1354C/T polymorphism and BD, the Q-statistic was significant and I 2 showed high variation under the comparisons (T vs. C: p < 0.00001, I 2 = 80%; TT + TC vs. CC: p = 0.001, I 2 = 85.2%; TC vs. CC: p = 0.004, I 2 = 82.1%). As all of the subjects were Caucasian, we did not perform the subgroup analysis.
For sensitivity analysis, in the analyses of the association between the HTR2A–1354C/T polymorphism and BD, the pooled OR value was not influenced by any single study unduly, as 95% CIs around the pooled ORs always contained a value of 1.0, without removing any studies from the calculation.
Bias diagnostics
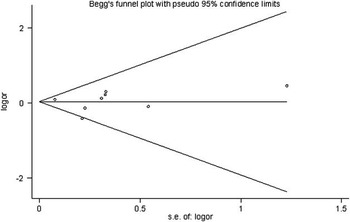
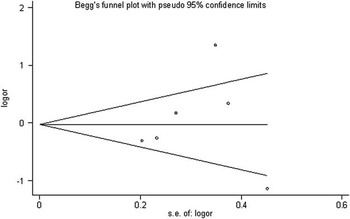
According to Begg's test and Egger's test, the results suggested no evidence of publication bias in our study of the association between the HTR2A–1354C/T polymorphism and SCZ (Fig. 3). The publication bias in the study regarding the association between the HTR2A–1354C/T polymorphism and BD was calculated as T allele vs. C allele. The shape of funnel plot seemed symmetrical, and Egger's test (p = 0.649) also suggested no evidence of publication bias (Fig. 4). Owing to the lack of a sufficient number of trials, we did not carry out the publication bias using the four other models.
Begg's funnel plot for the association between the HTR2A–1354C/T polymorphism and schizophrenia in total populations (T vs. C: P for bias = 0.79).

Begg's funnel plot for the association between the HTR2A–1354C/T polymorphism and bipolar disorder in total populations (T vs. C: P for bias = 0.649).

Discussion
The present meta-analysis provided a systematic evaluation of the HTR2A–1354C/T polymorphism and susceptibility to SCZ and BD, on the basis of a total of 14 independent studies (6106 samples) published before July 10, 2012. However, in five models, no association was detected between the 1354C/T polymorphism and SCZ either in Caucasians or in Asians. In addition, the 1354C/T polymorphism did not appear to have any effect on BD risk in the subjects as a whole. Therefore, we could not identify any association between SCZ and the 1354C/T polymorphism or between BD and the 1354C/T polymorphism. Compared with the data from SzGene, a larger sample size and increased statistical power could be obtained for SCZ. As for BD, this is the first meta-analysis testing the relationship between the HTR2A–1354C/T polymorphism and BD, the result of which was negative.
The meta-analyses Forest plot in SZGene gave a negative association between the HTR2A–1354C/T polymorphism and SCZ [OR = 0.98 (0.83–1.16)]. We found two further articles containing three studies (Reference Mata, Arranz and Patino40,Reference Kawanishi, Hanihara and Shimoda42). In five models, no heterogeneity (I 2 = 0%) and no significant differences were observed in the genotype or allelic distribution between Caucasians and Asians for the investigated polymorphism. These negative results also indicated that there was no association between the HTR2A–1354C/T polymorphism and SCZ.
The HTR2A–1354C/T polymorphism has been investigated extensively for its relationship with BP. However, the results were inconsistent. Some studies (Reference Ranade, Hader and Joel32,Reference Kumar, Purushottam and Kubendran33) reported that there was a positive correlation between the HTR2A–1354C/T polymorphisms and BP, whereas some (Reference Arranz, Erdmann and Kirov28–Reference Ghosh, Sanjeev, Kiran Kumar, Nithin Krishna and Purushottam31) presented different viewpoints. To clarify the final conclusion, we performed the meta-analysis, which showed no association between the HTR2A–1354C/T polymorphisms and BP. The following reasons could explain the result. First, the polymorphism was relatively infrequent and, consequently, provided little information as a result of the large size of the sample. Second, the main part of Ranade's study (Reference Ranade, Hader and Joel32) was regarding Bipolar I Disorder, which is just one subtype of BD. A number of studies have shown that BP-I and BP-II have different aetiologies and characteristics during the course of the disease (Reference Akiskal44–Reference McMahon, Simpson, McInnis, Badner, MacKinnon and DePaulo46). Lee et al. (Reference Lee, Chen and Chang47) found the ALDH2 and HTR2A–1438A/G genes to interact in bipolar-I but not in bipolar-II disorder, which suggests that the dysfunction of 5-HT and dopamine metabolism may be involved in the pathophysiological mechanism of BP-I. As most studies have not differentiated BP into BP-I and BP-II groups, and the fact that there is limited research on HTR2A–1354C/T, could be one explanation for the negative results in meta-analysis not being excluded. Third, there was a significant heterogeneity in this meta-analysis for BD. The influencing factors causing the heterogeneity may be as follows: (1) a different diagnostic criterion used in each study for the samples included in this meta-analysis; (2) the subjects in control groups were not consistent, that is, some subjects were from a hospital or different population; and (3) subjects from different countries may be affected by different social and natural environmental factors.
The present study has some limitations. First, although we used a sensitive search strategy for the retrieval of eligible studies, potential omitted studies might exist. Second, all of the included studies were published in English and indexed by the selected databases. This will have led to the exclusion of some associated studies published in other languages. Therefore, we may have lost the opportunity to obtain a larger sample size and increase statistical power. Third, the SCZ and BD diagnostic standards, as well as the source of controls, were not similar in our study, which suggested selection bias in our study. In addition, there is only one article concerning an Asian population in SCZ, and all of the researches of BP are Caucasian, which might mean that the representation of our results was not prominent enough. More research on other ethnicities and different countries should be added into a future study.
In conclusion, the present study did not support an association between the HTR2A–1354C/T polymorphism in SCZ or BD, which indicated that the HTR2A–1354C/T polymorphism was unlikely to be a risk factor for SCZ and BD. Studies with larger sample sizes and more sophisticated gene–gene and gene–environment interactions are expected in the future to evaluate the association between these two psychoses and the HTR2A–1354C/T polymor1phism.
Acknowledgements
This study was supported by grants from the National Natural Science Foundation of China (Grant No. 81260594), Guangxi National Natural Science Foundation (Grant No. 2012GXNSFAA053089), the significant scientific research foundation of the Guangxi health department (No. 200933), Guangxi science and technology project of Traditional Chinese Medicine (No. GZKZ1107) and the significant scientific research foundation of the Guangxi health department (No. 2012047).
Authors contributions
Lian Gu, Jinjing Tan, Li Su and Yuwang Qin designed the study protocol. Jianxiong Long, Qing Chen, Juanjuan Xie, Baoyun Liang, Yan Yan and Guangliang Wu managed the literature searches and performed the statistical analysis. All authors contributed to interpretation of data. Lian Gu, Jinjing Tan and Li Su drafted the manuscript. Lian Gu, Jinjing Tan, Li Su and Yuwang Qin provided critical revision of the draft for important intellectual content. All authors critically reviewed the content and approved the final version for publication.
Conflict of interest
The authors declare no conflict of interest.