Introduction
Capacitive deionization (CDI), sometimes referred to as electrosorption, is a water desalination technology using a small applied potential to drive charged species (e.g., ions) in saline water to the porous surface of the electrodes. For brackish water of relatively low-salt concentration (<5000 ppm), the current CDI technology has been reported to be a great contender in term of energy efficiency compared with mature market technology such as reverse osmosis and distillation.[ Reference Oren 1 , Reference Porada, Zhao, Van Der Wal, Presser and Biesheuvel 2 ] The ions removed from aqueous solution are temporally stored on the internal surface areas inside the porous electrodes and can be released by removing or reversing the applied voltage. Therefore, materials with good wettability, high surface area, and conductivity are generally more favorable as CDI electrodes in term of ion storage capacity, such as activated carbon, carbon aerogels, mesoporous carbon, and carbon nanotube.[ Reference Li, Zou, Song and Morris 3 – Reference Li, Pan, Zhang, Zou, Sun, Zhan and Sun 5 ] Among those carbonaceous materials, graphene firstly discovered in 2004 was one attractive candidate due to its excellent electrical, mechanical, and thermal properties.[ Reference Novoselov, Geim, Morozov, Jiang, Zhang, Dubonos, Grigorieva and Firsov 6 , Reference Ponomarenko, Schedin, Katsnelson, Yang, Hill, Novoselov and Geim 7 ] Most commonly, single sheets of graphene oxide (GO) are chemically reduced to graphene after adding certain reducing agent.[ Reference Niyogi, Bekyarova, Itkis, McWilliams, Hamon and Haddon 8 , Reference Zhou and Liu 9 ] TiO2 is a relatively mild reducing agent with conduction band around −0.5 V versus normal hydrogen electrode at neutral pH. Well-separated TiO2–graphene composite sheets by carrying out UV-induced photocatalytic reduction of GO has been reported.[ Reference Williams, Seger and Kamat 10 ] Upon a certain light irradiation, electron–hole pairs within TiO2 colloidal suspension were induced. In presence of ethanol in the solution, the positive holes are scavenged to produce ethoxy radical, thus leaving the electrons to accumulate within TiO2 particles. The accumulated electrons then serve to interact with GO sheets in order to reduce certain functional groups (e.g., epoxides, hydroxyls, and carboxylic acids). Several advantages can be drawn from this technique. (1) The binding of oxide nanoparticles kept the exfoliated graphene sheets from collapsing and aggregation in solution as TiO2 nanoparticles carry surface charge in the suspension. (2) This new and less chemical demand route of GO reduction features no hazardous stabilizing reagent usage and lower energy cost compared with conventional approaches, i.e., using elevated temperatures or strong reducing agents. (3) The direct interaction between TiO2 and GO sheets (e.g., carboxylate linkage) also provides the basis to their effective coupling and GO reduction by a one-step strategy.
Generally, practical CDI process demands several retreatments (e.g., chemical, coagulation, or ultra-filtration process[ Reference Yang and Kim 11 – Reference Friedler, Katz and Dosoretz 13 ]) to remove natural organic matters, which, if not dealt properly, could cause severe fouling on the electrosorptive surface and thus block of the functioning pores. By introducing TiO2 nanoparticles between the graphene sheets, potential photocatalytic ability was expected in the as-prepared TiO2–reduced graphene oxide (RGO) composites. This could be advantageous considering the coupled self-cleaning effects on dissolved organic compounds. In a previous paper, we reported a successful visible-light reduction of GO samples using TiO2 colloidal suspension,[ Reference Li, Zhang, Zou, Pan and Sun 14 ] which was made possible through the well-documented wet chemical N-doping method.[ Reference Zhang, Zou and Wang 15 – Reference Zhang, Zou and Wang 17 ] The obtained TiO2–RGO nanocomposite products demonstrated enhanced conductivity. This together with their possible synergistic effects of degradation of dissolved organic matters via coupled TiO2 nanoparticles is envisaged to be beneficial to develop anti-fouling CDI under visible-light conditions for brackish water desalination. In this work, potential application of TiO2–RGO nanocomposites as CDI electrodes are further explored in both bench and pilot-scale experimental setup.
Experimental
Materials preparation
In a typical preparation of visible-light-sensitive TiO2 colloidal suspension, 40 mL titanium (IV) butoxide (97%, Sigma Aldrich) were first dissolved in 160 mL ethanol by stirring of 30 min at room temperature to obtain solution A. In addition, 400 mL deionized water was mixed with 5 mL nitric acid by stirring of 10 min at room temperature to obtain solution B. Solution B was then added drop-wise into solution A under vigorous stirring, and this was then followed by the hydrolysis of titanium (IV) butoxide under stirring conditions at room temperature until a transparent sol was formed. Visible-light sensitization was then achieved by drop-wise addition of 1 mL triethylamine (≥99.5, Sigma Aldrich) to the formed TiO2 sol under continuous stirring of 24 h. In the present experiments, natural flake-type graphite (Bay Carbon, SP-2) was used as starting material for GO synthesis, which was obtained according to the modified Hummers method.[ Reference Hummers and Offeman 18 ] The final product was then added to the as-prepared TiO2 colloidal suspension and sonicated for 30 min to produce dispersion of GO sheets coated with the TiO2 nanoparticles.
Visible-light-assisted reduction of GO was carried out in a 50 mL cylindrical glass vessel under a Newport Oriel series Q solar simulator with a 100 W Xe lamp. A dichroic mirror (NewSpec 66219) was mounted on the lamp to eliminate IR and UV portion of the irradiation. The total collimated irradiance between 420 and 630 nm was measured at approximately 570 mW on the surface of sample by a Newport optical power meter 1918-C. Typical concentration were 0.2 mm TiO2 and 5 mg/mL GO. The suspensions were kept under constant magnetic stirring during visible-light irradiation.
Materials characterization
Morphological properties of composites were examined by a scanning electron microscopy (SEM, Philips XL 30) as well as energy-dispersive x-ray spectroscopy (EDS). A typical three-compartment cell (i.e., TiO2–RGO, glass carbon rod, and saturated calomel electrode) was employed to probe the electrochemical performance of TiO2–RGO at an ambient temperature. The potential sweep cyclic voltammetry (CV) measurement was carried out in the 1 mol/L NaCl solution via an Autolab PGSTAT 128N. The specific capacitance (F/g) in each scan rate (mv/s) has been estimated from the voltametric charge surrounded by the CV curves according to =(q a + |q c|/m cΔv d), where q a, q c, m c, and Δv d are the anodic and cathodic voltametric charges on positive and negative sweeps, the weight of target sample loaded in the electrode and the potential range of CV, respectively. The Brunauer–Emmett–Teller surface areas of TiO2–GO and TiO2–RGO nanocomposites were obtained using N2 adsorption–desorption tests via a Belsorp apparatus, Japan.
CDI performance evaluation
Bench-scale evaluation of electrosorptive performance of as-prepared TiO2–RGO nanocomposites was conducted using a typical CDI unit (see the detailed information about the CDI unit in[ Reference Jia and Zou 19 , Reference Jia, Wang, Zhang, Lin, Yuan, Ding, Ren and Chu 20 ]). In this experiment, applied electrical voltage on the two electrodes ranged from 1.0 to 2.4 V, while the flow rate was kept in a constant of 25 mL/min with the NaCl solution of an initial electrical conductivity around 110 µS/cm. The anti-fouling ability of as-prepared TiO2–RGO nanocomposites was evaluated using humic acid (HA) (Sigma Aldrich) as model organic foulant, which widely existed in various underground and brackish water sources. The light source and its setting for the photocatalytic degradation was the same as those used previously[ Reference Li, Zhang, Zou, Pan and Sun 14 ]. In a typical test, 30 mg composite samples were added into 100 mL of 11.2 mg/L HA solution, where the retrieved samples were filtered and analyzed using a Varian Cary 100 UV–vis spectrophotometer set at 254 nm.[ Reference Li, Fan and Sun 21 ]
Pilot-scale CDI experiment using as-prepared TiO2–RGO nanocomposites was carried out in a fully solar powered CDI unit, which consists of four CDI assembly cells. The electrodes within the cell are charged by an applied DC potential of 1.8 VDC. A complete CDI operation cycle is comprised a 90 s electrosorption step and a regeneration step with 30 s no voltage and 30 s reversed 1.5 VDC applied. Each cell assembly was similar to those used in our previous study.[ Reference Zhang, Mossad and Zou 22 , Reference Mossad, Zhang and Zou 23 ] The 25 mm sodium chloride, magnesium chloride, and calcium chloride solutions were selected to study the electrosorption process of different cations, respectively.
Results and discussion
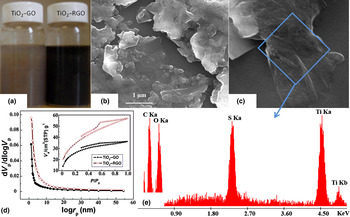
The degree of GO reduction along with the partial restoration of the carbon π network was evidenced by the color variation from brown to black after 7 h visible-light irradiation in Fig. 1(a). The stacking of RGO sheets in the SEM micrograph of Fig. 1(b) indicated their aggregative nature. Further enlarged image of TiO2–RGO nanocomposites in Fig. 1(c) and their corresponding EDS result in Fig. 1(e) confirmed that TiO2 nanoparticles were successfully deposited and randomly distributed on the transparent RGO sheets. There are multiple coupling mechanisms documented in literature between TiO2 and GO sheets, including physisorption, electrostatic binding, or charge transfer interactions. In addition, surface areas of TiO2–RGO nanocomposits was found to increase from 90.2 to 122 m2/g after 7 h irradiation and the appearance of a slight hysteresis loop (H2 type) at the high pressure of N2 adsorption–desorption isotherm in Fig. 1(d) also suggested newly formed mesopore structure. This indicated that photocatalytic reduction process might reduce aggregation to a certain extent and thus increase the surface area.
(a) The color change of graphene mixture with N-doped TiO2 sol before (left) and after visible-light irradiation (right); typical (b) and enlarged (c) SEM image of as-prepared TiO2–RGO composite; (d) pore size distribution of TiO2–GO and TiO2–RGO, where the inset is the corresponding N2 adsorption–desorption isotherm; (e) the corresponding EDS spectra to SEM image (c).

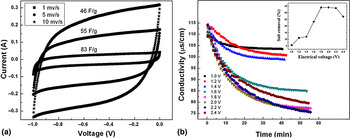
The cyclic voltammograms for the TiO2–RGO nanocomposites shows a rectangular shape over the scan rates from 1 to 10 mv/s as illustrated in Fig. 2(a). The specific capacitance of TiO2–RGO nanocomposites were 83, 55, and 46 F/g, respectively, when the scan rate was adjusted at 1, 5, and 10 mv/s. The capacitance decrease with current and scan rate indicated that as-prepared TiO2–RGO nanocomposites presented an accessible porous structure, which was capable of facilitating rapid ions diffusion and therefore suitable for electrosorptive desalination treatment. Figure 2(b) shows the conductivity transient in different voltage and the inset illustrates the corresponding salt removal. In this experiment, the salt removal was defined as follows:
 $${\rm Salt}\;{\rm removal}\;{\rm (\%)}= \displaystyle{{(C - C_0 )} \over {C_0}} \%, $$
where C and C 0 (μS/cm) represent the final and initial concentrations, respectively. As expected that higher voltage implied the higher salt removal due to the stronger Coulombic interaction between TiO2–RGO and salt ions. From 1.0 to 1.8 V, the salt removal dramatically increased from 5.5% to 34%, while gradually stabilized when the voltage further increased until 2.2 V. This is due to the fact that the electrode was nearly saturated, so that the co-ions effect played a dominant role in this stage. Additionally, when the applied voltage was 2.4 V, the salt removal rate decreased to 27% because of water electrodialysis. Therefore, taking into account of both the desalination efficiency and energy consuming, the optimum working voltage for as-prepared TiO2–RGO composites as electrosorptive electrode was 1.8 V in this work.
(a) Electrochemical performances of TiO2–RGO nanocomposites; (b) solution conductivity variation as a function of time at different applied electrical voltages, where the inset shows salt removal efficiency at different applied electrical voltages.

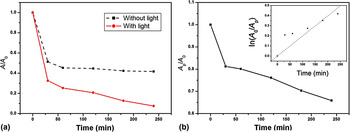
Figure 3(a) demonstrates the time-dependent HA removal rate using as prepared TiO2–RGO nanocomposites under different light conditions. Upon the visible-light irradiation, the HA removal (lower line) was increased compared with that under the dark condition. The offset between two lines can be viewed as the amount of HA removal by TiO2 photocatalysis solely. Accordingly, HA removal by sole TiO2 photocatalysis was converted in Fig. 3(b). The inset plotted In [A 0/A p] against time, t, using a first-order kinetics approach:
(a) HA removal rate with and without visible-light irradiation, where A 0 is the initial light absorption at 254 nm and A is that at given time, t; (b) HA removal rate by sole TiO2 photocatalysis, where A p at 254 nm is the light adsorption at given time, t.

In
 $$\left[ {\displaystyle{{A_0} \over {A_{\rm p}}}} \right] = kt,$$
where k is the photocatalytic rate constant. Good linear fit (R 2 = 0.93) suggested that the photocatalytic kinetics of TiO2–RGO composites were similar to using TiO2 alone.[ Reference Konstantinou and Albanis 24 ]
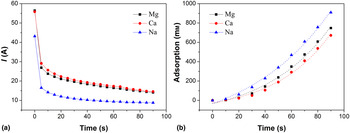
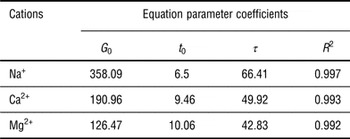
For pilot-scale CDI testing of as-prepared TiO2–RGO composites, the current and electrosorption profiles as function of time for three different cations are shown in Figs. 4(a) and 4(b). The appearance of a spike in the current profile at the beginning of electrosorption step is due to the ion motion of both the adsorption of counter-ions and desorption of co-ions. This effect appeared to be more pronounced for saline solutions made with divalent ions (i.e., calcium and magnesium), since they carry double amount of charge for the same molar concentration. It is also observed that, as the electrosorption step proceeded, the current began to drop significantly as most of the co-ions in the electrode pores were desorbed. The process kinetics can be precisely described using Eq. (3) (R 2 > 0.99), where G represents the ion adsorption onto the electrodes in mm at a given time, t; G 0 is usually related to the amount of residual co-ions left on the electrodes; τ is the exponential time constant and smaller value means faster adsorption rate before the maximum ion adsorption capacity is reached; t 0 is a time indicator of how long before the co-ions were fully repelled from the electrodes, so when t < t 0, electrodes are charged with co-ions, and G is of negative value. All the equation coefficients for different ion solutions are summarized in Table I. It is noteworthy that monovalent ion solutions (i.e., sodium) take shorter time (i.e., lower t 0 values) than their divalent counterparts (i.e., calcium and magnesium) to expel co-ions from electrodes completely. This indicated that divalent ion solutions tend to have higher amount of charge from co-ions left on the electrodes in the beginning of electrosorption step. On the other hand, it appeared that divalent ion solutions possess faster adsorption rates (i.e., lower τ values), which indicate their adsorptive preferences onto the electrodes.
 $$G = G_0 \left[ {\displaystyle{{e^{(t - t_0 )}} \over {\tau - {\rm 1}}}} \right].$$
Time-dependent current (a) and ion adsorption variation (b) of Na+, Ca2+, and Mg2+ions within 90 s electrosorption step.

Pilot scale electrosorption equation coefficients.

Conclusion
In summary, visible-light-assisted reduction of GO using N-doped TiO2 photocatalysts was carried out. The Bench-scale test in salt removal treatment has demonstrated electrosorptive ability of the reduced TiO2–graphene nanocomposite and determined their optimum working voltage as CDI electrode at 1.8 V. Furthermore, the coupled TiO2 nanoparticles within the composite resultants also exhibited photocatalytic ability by removing the HA model pollutant. This property is expected to be beneficial as it could relieve the degree of fouling on the electrosorptive surface caused by dissolved organic compounds. Pilot-scale study using TiO2–RGO nanocomposites further confirmed its practicality in their future application in desalination water treatment. Future design aspects such as solar irradiation device incorporation into the CDI cells should be considered and carried out to realize their full potential as anti-fouling electrodes in large-scale applications.
Acknowledgments
This work was funded by an International Scientific Cooperation Project (grant no. CJ20140718) of Changzhou Science and Technology Bureau, China. Laboratory assistance by Dr. Haibo Li was greatly appreciated. Dr. Wei Zhang would also like to thank Australian Endeavour Fellowship Program and University of South Australia Early Career Researcher Travel Grant Scheme for their financial support.