A growing body of research in political science addresses inequalities in the response of government policymakers to the preferences of different subgroups of the population. Using a variety of data and techniques and looking at a range of population subgroups Larry Bartels (Reference Bartels2002; Reference Bartels2008); Larry Jacobs and Benjamin Page (Reference Jacobs and Page2005); John Griffin, Brian Newman, and Patrick Flavin (Griffin and Newman Reference Griffin and Newman2007; Griffin and Flavin Reference Griffin and Flavin2007); and I (Gilens Reference Gilens2003; Reference Gilens2005) all find that more privileged subgroups of Americans have greater—sometimes dramatically greater—sway over government policy.
One particular dimension of inequality in democratic responsiveness that has long been a focus of concerned observers and democratic theorists alike is affluence. Bartels (Reference Bartels2002; Reference Bartels2008) and I (Gilens Reference Gilens2003; Reference Gilens2005) both find stark differences in the relationship between government policy and the preferences of high-income as opposed to low-income Americans. Especially in a time of rising economic inequality, the ability of well-off Americans to dominate federal policymaking is troubling (e.g., Task Force on Inequality and American Democracy 2004).
But just how troubled we should be over economic inequalities in government responsiveness depends on how much the preferences of more and less well-off Americans differ. If the affluent and the poor rarely disagree over government policy, then the differences in responsiveness that these scholars document may have little practical consequence.
This is exactly the possibility that Stuart Soroka and Christopher Wlezien raise in their article “On the Limits to Inequality in Representation” (Reference Soroka and Wlezien2008). Focusing on a series of government spending questions from the General Social Survey (GSS), Soroka and Wlezien show that the preferences of low- and high-income Americans do not differ substantially over most of the domains of government spending that they examine. Specifically, they find very similar preferences across income groups toward spending on defense, foreign aid, education, health, cities, crime, and the environment. Only welfare spending shows large differences across income groups, with high-income Americans expressing substantially greater opposition to welfare spending than those with low incomes.
Based on these analyses, Soroka and Wlezien conclude: “Our results indicate that income really only matters in isolated cases, specifically, welfare spending preferences. In the other domains, differences in preferences across income brackets are in fact small and insignificant” (319). Taking the next logical step, Soroka and Wlezien suggest that if preferences across income groups are small, the policy consequences of unequal responsiveness must be small as well. “We must accept,” they write, “that income alone does not provide a very substantial basis for unequal outputs in most recurrent policy domains in the U.S.” (325).
While the logic of Soroka and Wlezien's argument is sound, the conclusions they draw from the GSS government spending items they examine are misleading. My own data set of policy preferences across income groups covers a far broader range of issues and shows dramatically greater differences between the preferences of low- and high-income Americans. In the following pages, I systematically assess the differences between my data and the findings presented in Soroka and Wlezien. I argue that the pattern of responses to the GSS spending questions are not representative of how public preferences on policy issues are patterned more generally, and that the broader representation of policy issues in my data set accounts for the difference in our results. I then present a brief overview of the policy issues that generate the greatest preference gaps across income groups. I show that these include a wide range of issues, including policies with different economic consequences for different income groups such as taxes, trade policy, or unemployment benefits, as well as non-economic policies such as abortion, gay rights, and civil liberties.
SOROKA AND WLEZIEN'S FINDINGS
Soroka and Wlezien devote most of their attention to a set of eight items from the GSS that ask whether government spending in a particular area should be increased, decreased, or kept the same. Soroka and Wlezien calculate the net spending preferences on each issue by subtracting the percentage of respondents in a given income, education, or partisan group that prefer to cut spending from the percentage in that group that prefer to increase spending. Averaging over the years of available data, Soroka and Wlezien present these results in their tables 1–3.
The most striking finding in Soroka and Wlezien is the very small difference between the preferences of low- and high-income respondents to the seven non-welfare spending questions on the GSS. Soroka and Wlezien report an average of only a 3.6-percentage-point difference in the net spending preferences of high- and low-income respondents. But seven spending items is a very small set of policy preferences from which to draw broad conclusions about the distribution of preferences across population groups. Moreover, these seven questions all ask about government spending while many policies on which Americans might differ (including many economic policies) have little or no implications for government spending (minimum wage, trade policy, labor regulations, gun control, abortion, family leave policy, gay rights, stem cell research, use of the military, etc.).
The data that form the basis for my analyses of democratic responsiveness represent a much larger number of policies and show a much larger preference gap between low- and high-income Americans. While Soroka and Wlezien find a 3.6-point gap for non-welfare items, the analogous statistic for non-welfare items in my data is 17.8 points. Of the eight GSS spending items Soroka and Wlezien examine, six have net preference gaps of less than five percentage points between high- and low-income groups and only one (welfare spending) has a gap larger than 10 percentage points. In contrast, 65% of the items in my data set show a preference gap of at least 10 points, and almost 40% of the items show a gap of 20 percentage points or more (Figure 1).
Distribution of Net Preference Gap between High- and Low-Income Respondents, Soroka and Wlezien and Gilens Data
Net preference gaps for the Soroka and Wlezien data are calculated for the eight GSS spending items included in their Table 1 and reflect the percentage of respondents saying increase spending minus the percentage saying decrease spending for the first and third income terciles. Net preference gaps for the Gilens data reflect the percentage of respondents favoring the relevant policy or proposed policy change minus the percentage of respondents opposing the relevant policy or policy change and are based on imputed preferences for the tenth and ninetieth income percentiles. See article text for more details on the calculations of the imputed preferences.

While our estimates of the preference gap between high- and low-income Americans are dramatically different, there are a number of distinctions in the nature of our data and the techniques we use to estimate policy preferences that must be examined. First, Soroka and Wlezien include data from 24 years between 1973 and 2004Footnote 1 while my data include the 22 years between 1981 and 2002. Second, I focus on somewhat smaller groups of high- and low-income respondents, equivalent to the top and bottom 20% of the income distribution (in contrast to Soroka and Wlezien's top and bottom 33% brackets). Finally, I use a quadratic imputation procedure to estimate policy preferences at different income levels while Soroka and Wlezien divide their samples into groups based on income categories from the GSS. After describing my data in more detail, I report a series of analyses that addresses each of these differences between our data and analytic techniques to determine the contribution, if any, they make to our different results.
GILENS'S POLICY PREFERENCE DATA
Any assessment of the impact of public preferences on public policy must grapple with the difficulty of identifying a suitable collection of policy preferences to assess. Federal government activity extends to a huge array of policy areas. In addition, any comprehensive assessment of public attitudes would need to consider not only preferences toward existing government policies, but preferences toward policies that could have been, but were not, adopted. For example, in the realm of education policy, it would be desirable to have data not only on public attitudes toward the existing No Child Left Behind program, but also toward federal school vouchers that have been frequently discussed but never adopted.Footnote 2
In principle, one would like a representative sample of both possible and existing federal policies to form the basis for assessing public preferences. But given the limitless number of possible federal policies, there is no such definable universe from which such a sample could be drawn. The best one could hope for under the circumstances is a set of policies that represents the most important existing policies that the government has or plausibly could adopt. To approximate this admittedly vaguely defined set of policies, I've relied on the judgments of multiple polling organizations over a period of 22 years. Using online databases of survey questions from news media and national polling firms, I collected as many questions as possible from the years 1981 through 2002 that asked whether respondents favored or opposed specific existing or proposed federal government policies. Since my ultimate objective in collecting these data is to analyze the relationship between public preferences and actual policy outcomes, I only included policy questions for which it was possible to determine whether an existing policy was retained or a proposed policy adopted.Footnote 3
I make no claim that my set of policy preference questions constitutes a definitive collection of federal policies from the years I examined, only that it constitutes a broadly defined group of policies that plausibly reflect the range of issues that were on the public agenda over this time period. To the extent that news media and survey organizations tailor their questions to the more prominent policy issues of the day, the set of questions I collected should reflect at least in a loose way the set of concerns that the federal government and the American public were grappling with.
The specific procedure I used to collect my policy preference data was to comb the iPOLL database maintained by the Roper Center at the University of Connecticut and the Public Opinion Poll Question database maintained by the Odum Institute at the University of North Carolina for questions about federal policy asked in national surveys conducted between 1981 and 2002. I identified questions using keyword searches for “oppose” in the question text or response categories and then hand-sifting through the results to find appropriate questions.Footnote 4 The original survey data were collected by dozens of different survey organizations with the largest number of questions coming from Harris, Gallup, CBS, and Los Angeles Times surveys.
After excluding policies that would require a constitutional amendment or Supreme Court ruling to adopt, I was left with a set of 1,784 survey questions asked over this 22-year period.Footnote 5 Each survey question asks whether respondents support or oppose some specific proposed or existing U.S. government policy: raising the minimum wage, sending U.S. troops to Haiti, requiring employers to provide health insurance, allowing gays to serve in the military, and so on. The specific policies represented in my data range from very prominent to fairly obscure and from very popular to very unpopular.Footnote 6 On average, about 56% of respondents favored the policies or proposed policy changes asked about and 33% of the proposed changes were in fact adopted (within the four-year coding window from the date of the survey).
Because the surveys employed were conducted by different organizations at different points in time, the demographic categories are frequently inconsistent. In particular, income and education are divided into different numbers of categories and use different break points in different surveys. In addition, the typically limited number of income and education categories in each survey seldom allow a clean division of the sample into the top and bottom terciles, quintiles, etc. To create consistent measures of preferences that can be compared across surveys and across years, and to facilitate comparison with Soroka and Wlezien's data from the GSS, I used the following procedure. For ease of exposition, I describe the procedure for imputing preferences by income; the identical procedure was applied to education.
For each survey question, I assigned respondents in each income category an income score equal to the percentile midpoint for their income group based on the income distribution from that survey. For example, if on a given survey 10% of the respondents fell into the bottom income category and 30% into the second category, those in the bottom group would be assigned a score of 0.05 (the midpoint between 0 and 0.10) and the second group a score of 0.25 (the midpoint between 0.10 and 0.40, the bottom and top percentiles for the second group).
After re-scoring income for each survey, I estimated predicted preferences for specific income percentiles using a quadratic function. That is, for each survey question, I used income and income-squared (measured in percentiles) as predictors of policy preference for that question (resulting in 1,784 separate logistic regressions each with two predictors). I then used the coefficients from these analyses to impute policy preferences for respondents at the desired percentiles.Footnote 7
COMPARING GILENS'S AND SOROKA AND WLEZIEN'S FINDINGS
To compare my data with Soroka and Wlezien's, I first calculated analogous net preference statistics for my data by subtracting the percentage of respondents opposing the relevant policy from the percentage supporting that policy (with percentages based on the total number of respondents including those saying “don't know”). My interest is in income-based preference differences because inequalities in government responsiveness appear to hinge much more on income than education (Gilens Reference Gilens2005; n.d.). Following Soroka and Wlezien, however, I report the analogous preference gaps for high versus low education as a basis for comparison.
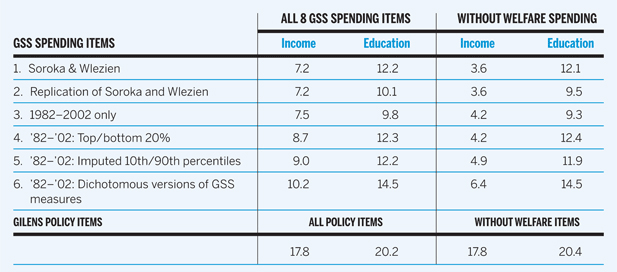
In the following analyses, I examine each of the aforementioned differences between my analyses and Soroka and Wlezien's by re-estimating the preference gaps from the GSS to take each of those differences into account. The top row of Table 1 repeats the findings from Soroka and Wlezien. The first column of figures shows the fairly small 7.2-percentage-point gap between high- and low-income respondents for all eight GSS spending items and the third column shows the even smaller 3.6-point gap for the seven non-welfare spending items.
Average Absolute Difference in Net Preferences for High versus Low Income and Education

The first six rows of the table show the difference between the high and low categories of income and education in the absolute value of the percent favoring increased spending minus percent favoring decreased spending averaged across the eight GSS spending items from Soroka and Wlezien. Gilens's data set consists of 1,784 dichotomous policy preference items and 1,723 excluding items dealing with welfare spending, welfare reform, etc. For all dichotomous measures, the entries indicate the percent favoring the proposed policy minus the percent opposing the proposed policy out of the total number of respondents for each question.
The second row of Table 1 shows my own replication of these results from the GSS. For income, my results exactly match the averages in Soroka and Wlezien.Footnote 8 As the second and fourth columns of figures show, the average gap for education differed slightly in my replication. Despite considerable efforts on both our parts, Soroka and Wlezien and I were not able to account for these differences, which we suspect may result from my use of a more recent release of the GSS data. At any rate, the substantive patterns are the same even if the exact numbers diverge.
The third row of Table 1 is identical to the replication analysis in row two, except limited to the same years as my data: 1982–2002 (there was no GSS in 1981, the first year represented in my data set). These results differ little from the full 1973–2004 period, with the key difference between low- and high-income preferences for the non-welfare items rising slightly from 3.6 to 4.2 percentage points. Clearly, the difference in the time periods we examined cannot account for the difference in our findings.
I next reran the analysis of 1982–2002 GSS items using the top and bottom 20% of the income and education distributions.Footnote 9 To the extent that there is any relationship between income (or education) and policy preferences we would expect greater differences across more extreme categories. Row 4 of Table 1 shows that this is the case, but the differences, especially for income, are quite small. For all eight spending items, the difference between high- and low-income respondents increases from 7.5 to 8.7 percentage points. But most of this is accounted for by the large income differences for welfare spending, and the difference across income groups for the other seven items remains unchanged at 4.2 percentage points.
In the fifth row of Table 1 I apply the same imputation procedure that I used for my policy preference data. To approximate the bottom and top 20% of the income and education distributions I use the tenth and ninetieth percentiles of those distributions (that is, the midpoint of the high- and low-income and education groups). This results in slightly larger high-low differences for income and slightly smaller high-low differences for education, but in both cases the differences are quite minor and the imputed estimates closely match the values derived from the top and bottom quintiles.Footnote 10
Finally, I constructed dichotomous measures of spending preferences from the trichotomous GSS spending questions to more closely parallel the measures in my data set (all of which are dichotomous). Rather than using the percentage favoring more spending minus the percentage favoring less spending on a given item, I broke each of the GSS spending questions into two separate measures, one consisting of the percentage favoring more spending minus the percentage opposing more spending and a second item indicating the percentage favoring less spending minus the percentage opposing less spending. (In these calculations, as in the calculations from my policy preference data, percentages are based on all respondents including those saying “don't know” to a given item.) Breaking up each GSS spending item into two separate variables still allowed me to capture both the extent of sentiment for increasing and the extent of sentiment for decreasing spending, while the dichotomous items are parallel to those in my data. As row six in Table 1 shows, this restructuring of the GSS items results in slight increases in the differences across income and education categories (from 9.0 to 10.2 and from 4.9 to 6.4 for the income comparisons and from 12.2 to 14.5 and 11.9 to 14.5 for education).
None of the differences across the individual rows of Table 1 are very large. But the key in comparing my policy preference data with Soroka and Wlezien's is how the combination of these various differences in our data and analytic techniques impact our findings. The comparison of rows one and six in Table 1 reveals the combination of these differences and the story is clear: the difference between our results cannot be attributed to the individual or combined effects of the years our data were drawn from, the size of the income and education groups we examined, the imputation procedure I employed, or the dichotomous rather than trichotomous nature of my policy preference data. The combination of all of these factors leads to a 6.4-percentage-point gap between the high- and low-income categories and 14.5-percentage-point gap between the high- and low-education groups for the non-welfare items. The substantive conclusion is the same no matter how the preference gaps for the GSS spending items are calculated: outside of welfare, there is little difference in preference between high- and low-income Americans.Footnote 11
The results in Table 1 strongly suggest that the difference in the magnitude of the income gap in policy preferences between my data and Soroka and Wlezien's analysis of the eight GSS spending items stems from the policy issues represented in our different data sources rather than any aspect of the different analytic techniques we used. My broader set of policy questions better represents the range of federal government policies and my estimate of an average preference gap of 17.8 percentage points is therefore a more plausible approximation of the degree of divergence between low- and high-income Americans. But what particular policies in my data set account for this divergence in preferences between low- and high-income Americans?
POLICIES THAT CONTRIBUTE TO THE PREFERENCE GAP BETWEEN HIGH- AND LOW-INCOME GROUPS
Soroka and Wlezien suggest that the preference gap between high- and low-income Americans might be greater in policy domains where self-interest plays a clearer or more direct role. Consequently, they supplement their analysis of the GSS spending items with questions about taxes paid by Americans with low, middle, or high incomes.Footnote 12 In their Table 4, Soroka and Wlezien show that net preferences on taxes paid by people with high incomes and people with low incomes do differ substantially across income groups, producing gaps of about 22 and 24 percentage points.Footnote 13
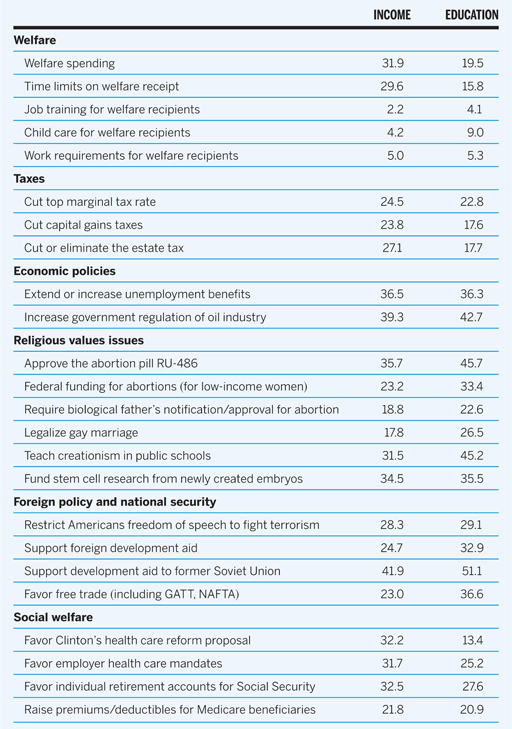
My own data show many cases where divergent interests across income groups would appear to explain substantial preference gaps. But I also find many issues with large preference gaps between income groups that do not appear tied to the differing economic interest of high- and low-income Americans. Table 2 shows the net preference gap between high- and low-income Americans on two dozen specific issues in my data (I also show the education-based preference gap for comparison). These issues are meant to illustrate the range of policy preferences on which high- and low-income Americans differ, but they are hardly exhaustive.Footnote 14 A more complete and detailed account of the policy preferences of different income groups will be available in Gilens (n.d.).
Average Absolute Difference in Net Preferences for High versus Low Income and Education by Issue

Table entries show the average of the absolute preference gap between the tenth and ninetieth percentiles of income or education based on the imputed percentage of respondents at that percentile who favor the policy or proposed policy change minus the percentage of respondents at that percentile who oppose the policy or proposed policy change. See article text for more details on the calculations of the imputed preferences.
The first two sections of Table 2 show the two areas in which Soroka and Wlezien report large income-based preference gaps: welfare and tax policy. My data set contains 61 questions dealing directly with welfare per se (that is, questions that ask about “welfare” or “welfare reform” or about the specific federal welfare program Temporary Assistance for Needy Families or its predecessor, Aid to Families with Dependent Children). Of these, only four parallel the GSS item Soroka and Wlezien use by addressing overall spending on welfare. As shown in Table 2, the average net preference gap on these four welfare spending items is 31.9 percentage points, virtually identical to the 32.5 point gap Soroka and Wlezien report.
The remaining 57 welfare items in my data set address other aspects of welfare policy and typically generate smaller preference gaps between high- and low-income respondents. For example, high- and low-income Americans strongly (and equally) support job training programs and child care for welfare recipients, and differ only modestly in their support for work requirements (Table 2). On the other hand, time limits on welfare receipt are much more popular among high-income respondents, resulting in a preference gap of 29.6 percentage points.
The wide variation in the size of the preference gap on different aspects of welfare policy suggests both the range of considerations that Americans bring to bear in thinking about public policy and the distinctions Americans make among different aspects of policy in the same issue area. On some aspects of welfare policy those with high and low incomes express very different preferences, but on other aspects they agree. On average, the income-based preference gap on all 61 welfare policy items in my data set is nearly identical to the overall preference gap of 17.8 points.
As noted above, Soroka and Wlezien also report substantial gaps in tax policy preferences between low- and high-income Americans (of about 22 and 24 percentage points on questions about tax rates for low and high earners). The tax questions in my data that concern policies with clearly differential impact on different income groups show similar preference gaps. Differences in net preferences of 24 to 27 points emerge on questions about cutting the top marginal tax rate, cutting the capital gains tax rate, and reducing or eliminating the estate tax (Table 2).
Even larger preference gaps between low- and high-income Americans emerge in my data on other economic policy issues. Some of these issues, like preferences on unemployment policy, may be directly related to respondents' differing economic interests. But other issues appear to have an indirect connection to economic interests reflected in the greater appeal of free markets to the affluent and the greater openness of low-income Americans to government regulation. Low-income Americans, for example, are dramatically more favorable toward government regulation of the oil and gas industry (Table 2), with over two-thirds supporting “the federal government breaking up the big oil companies to keep them from being so powerful over the economy.”
Perhaps the clearest examples of preference gaps across income groups that are not rooted in differing economic interests are found in the realm of “religious values” issues, on which high-income Americans tend to be more liberal.Footnote 15 Aspects of abortion policy, creationism, and stem cell research all generate large preference gaps between high- and low-income Americans (Table 2). Like welfare policy, however, the size of the preference gap varies from one specific policy aspect to another within each of these policy domains. A somewhat smaller preference gap is evident for gay marriage, a policy opposed more strongly by low-income than high-income Americans.Footnote 16
A number of foreign policy and national security issues also reveal large preference gaps between low- and high-income respondents. With net preference gaps between 23 and 28 percentage points (Table 2), low-income Americans express less support for free trade and less opposition to restricting Americans' freedom of speech in order to combat terrorism. Soroka and Wlezien report little difference between high- and low-income groups in response to the generic “foreign aid” spending question from the GSS. My data reflect more specific preferences about different kinds of aid and show significant preference gaps for non-military development aid in general and for economic assistance to the former Soviet Union in particular (high/low income gaps of 24.7 and 41.9 points respectively).
Finally, income-based preference gaps emerge on many social welfare policies, including employer health insurance mandates and President Clinton's health care reform proposal (both of which are more popular among low-income Americans). Low-income Americans are also stauncher supporters of existing Medicare and Social Security programs and less open to market-oriented reforms of these programs.
CONCLUSION
My analysis of over 1,700 different survey questions shows that the gap between low- and high-income Americans' policy preferences is far larger, and extends across a far wider range of issues, than Soroka and Wlezien suggest. The analyses in Table 1 show that the difference in our estimates cannot be accounted for by differences in our analytic approaches or the time periods from which our survey data are drawn.
One possible explanation for the difference in the magnitude of the income-based preference gap in our two data sets is that the GSS spending items are quite broad in nature while the policy questions in my data set tend to be more specific. For example, the GSS asks whether the federal government should spend more, less, or the same on “improving and protecting the nation's health,” while my dataset contains specific questions on employer mandates, Medicare premiums, long-term care funding, Clinton's health care reform proposal, and so on. If some aspects of health care reform are more popular among low-income Americans and others more popular among the affluent, a single broad question like that used by the GSS may obscure the existing differences in policy preferences within this, and other, policy domains.
The small size of the preference gaps in the GSS spending questions that Soroka and Wlezien examine might be due to some combination of their broad nature, their exclusive focus on spending as opposed to regulatory or other policy actions, or simply to the specific policy domains that the seven non-welfare questions address. Whatever the explanation, it is clear from the analyses above that the GSS questions that Soroka and Wlezien analyze do not adequately represent the range of relevant policy issues and do not accurately reflect the size or distribution of the policy preference gaps between high- and low-income respondents.
If government responds to the preferences of the well-off to the exclusion of the middle class and the poor (as a growing body of research indicates), policy outputs will differ from what a more democratic system would produce. If the preferences of low- and high-income Americans differed only modestly or on only a few policy issues, this inequality in democratic accountability would have minimal consequences for government policy outputs.Footnote 17 But as Table 2 above shows, preferences across income groups do differ by significant amounts on a large range of issues. Consequently, it is hard to escape the conclusion that public policy in the United States would look rather different if poor Americans had the influence over government policy that affluent Americans appear to enjoy.