1. Introduction
The intrusion-related gold deposits (IRGDs) exhibit that the gold mineralization is spatially and temporally associated with the granitoids (Goldfarb et al. Reference Goldfarb, Groves and Gardoll2001; Lang & Baker, Reference Lang and Baker2001). They mainly contain intrusion-hosted, proximal and distal deposit styles (Dressel et al. Reference Dressel, Chauvet, Trzaskos, Biondi, Bruguier, Monié, Villanova and Newton2018). The characteristics of the latter two types are the relationship between the structural setting and their ore-forming process (Cepedal et al. Reference Cepedal, Fuertes-Fuente, Martín-Izard, García-Nieto and Boiron2013; Tuduri et al. Reference Tuduri, Chauvet, Barbanson, Labriki, Dubois, Trapy, Lahfid, Poujol, Melleton, Badra, Ennaciri and Maacha2018), for instance, the Fuwen Au-dominated Au-Ag deposit (Xu et al. Reference Xu, Wang, Wu, Zhou, Shan, Hou, Fu and Zhang2017) and Num˜ao gold deposit (Leal et al. Reference Leal, Lima, Morris, Pedro and Noronha2022). However, the intrusion-hosted deposits are characterized by the direct effect of magmatism on gold mineralization (Lang & Baker, Reference Lang and Baker2001), such as the Linares deposit (Cepedal et al. Reference Cepedal, Fuertes-Fuente, Martín-Izard, García-Nieto and Boiron2013), Bilihe gold deposit (Yang et al. Reference Yang, Chang, Hou and Meffre2016) and the Julia deposit (Soloviev et al. Reference Soloviev, Kryazhev, Semenova, Kalinin, Dvurechenskaya and Sidorova2022). The IRGDs have been intensively studied, and the role of magmatism in gold mineralization is a subject of debate. However, there is a consensus on the basically consistent time of magmatism and mineralization (e.g. Yang et al. Reference Yang, Chang, Hou and Meffre2016; Wang et al. Reference Wang, Wang, Bi, Tao and Lan2020; Liu et al. Reference Liu, Zhao and Liu2021; Soloviev et al. Reference Soloviev, Kryazhev, Semenova, Kalinin, Dvurechenskaya and Sidorova2022). In summary, four different aspects have been stressed: (1) the origin of magma, such as reworking of an ancient crust is related to the formation of gold in the Argun massif (Liu et al. Reference Liu, He, Lai, Wang and Li2022); (2) fractional crystallization, for instance, highly fractionated quartz diorite porphyry is related to the Bilihe gold deposit (Yang et al. Reference Yang, Chang, Hou and Meffre2016); (3) composition (type, volatiles, K2O content and alkalinity), for example adakitic granitoids have genetic links to the Fuwen Au-Ag ore deposit (e.g. Zorin et al. Reference Zorin, Zorina, Spiridonov and Rutshtein2001; Xu et al. Reference Xu, Wang, Wu, Zhou, Shan, Hou, Fu and Zhang2017); ilmenite-series igneous rocks are related to the Bilihe gold deposit (Yang et al. Reference Yang, Chang, Hou and Meffre2016); higher volatiles, K and alkaline are more conducive to the gold mineralization in the northern margin of the North China Craton and Xiaoqinling (e.g. N’dri et al. Reference N’dri, Zhang, Zhang, Tamehe, Kouamelan, Wu, Assie, Koua, Kouamelan and Zhang2021; Liu et al. Reference Liu, He, Lai, Wang and Li2022); and (4) high oxygen fugacity. Furthermore, Blevin (Reference Blevin2004) has assessed the relationships of magmatic-hydrothermal mineralization associated with an igneous suite, suggesting that (1) silica distributions ‘skewed’ to high values are typically associated with Au, (2) K/Rb ratios greater than 200 are associated with Cu-Au systems, (3) the degree and type of fractionation determine the potential for mineralization and the type of mineralization and (4) the relative oxidation state control the compatible or incompatible nature of the ore. These investigations suggest that the composition, magmatic process and physiochemical conditions are effective parameters to assess the relationship between magmatism and gold mineralization.
The North China Craton (NCC) is one of the major gold-producing regions in China, and over 60% of the gold deposits are hosted by or are related to Phanerozoic intrusions (Nie et al. Reference Nie, Jiang and Liu2004; Deng & Wang, Reference Deng and Wang2016; Yang & Santosh, Reference Yang and Santosh2020). These gold deposits have been classified as either IRGDs (Sillitoe & Thompson, Reference Sillitoe and Thompson1998) or orogenic gold deposits (Goldfarb et al. Reference Goldfarb, Groves and Gardoll2001; Miao et al. Reference Miao, Qiu, Fan, Zhang and Zhai2005; Goldfarb & Groves, Reference Goldfarb and Groves2011; Groves & Santosh, Reference Groves and Santosh2016; Santosh & Groves, Reference Santosh and Groves2022). It is, therefore, of great significance to study the relationship between magmatism and gold mineralization.
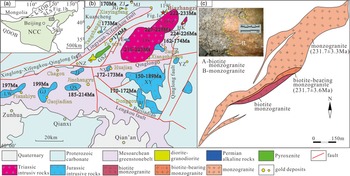
There are many gold deposits defining gold ore concentration in the eastern Hebei – western Liaoning area in the northern margin of the NCC (Kong et al. Reference Kong, Xu, Yin, Chen, Li, Guo, Yang and Shao2015). These deposits are mostly medium to large scale in the ore reserves and are distributed as ‘satellites’ around the Dushan batholith (DSB) (Fig. 1b), such as Yu’erya, Jinchangyu, Huajian, Baizhangzi, etc. They are closely related to the Mesozoic alkaline to calc-alkaline intrusive rocks, directly hosted by, or located in the vicinity of igneous rocks with almost the same mineralization age as that of magmatism (Chen et al. Reference Chen, Ye, Wang, He, Zhang and Wang2019; Zhang et al. Reference Zhang, Zhang, Danyushevsky, Wu, Alexis, Liao and Zhang2020), indicating a typical IRGD characteristic according to Lang and Baker (Reference Lang and Baker2001) and Goldfarb et al. (Reference Goldfarb, Groves and Gardoll2001). These gold deposits have long been studied (e.g. Sillitoe & Thompson, Reference Sillitoe and Thompson1998; Miao et al. Reference Miao, Qiu, Fan and Zhang2008; Chen et al. Reference Chen, Ye, Wang, Zhang, Lu and Hu2014; Song et al. Reference Song, Jiang, Bagas, Li, Hu, Zhang, Zhou and Ding2016; Bai et al. Reference Bai, Zhu, Zhang, Huang and Li2019), with the understanding that the gold mineralization is related to the magmatism. For example, the Jinchangyu gold deposit was regarded as IRGD type by Sillitoe and Thompson (Reference Sillitoe and Thompson1998) and further considered to be related to the DSB (Luo et al. Reference Luo, Guan, Qiu and Miao2001), while the Yu’erya gold deposit together with its hosted intrusion is identified as the product of partial melting in the lower crust during early Yanshan Movement (Chen et al. Reference Chen, Ye, Wang, Zhang, Lu and Hu2014), and the Baizhangzi gold deposit is thought to be related to the Late Triassic magmatism (Miao et al. Reference Miao, Qiu, Fan and Zhang2008).
(a) Tectonic map of the North China Craton (Jiang et al. Reference Jiang, Guo and Chang2013), CAOB – Central Asian Orogenic Belt, SLS – Solonker suture, QDOB – Qinling-Dabie Orogenic Belt. (b) Sketch geological map of the LX district showing the distribution of gold deposits and igneous rocks with ages (modified from Xiong et al. Reference Xiong, Shi, Li, Tian, Chen, Zhou, Zhao and Li2017; Zhang et al. Reference Zhang, Zhang, Danyushevsky, Wu, Alexis, Liao and Zhang2020). (c) Sketch map of BZG at the 30m level with photos of contact relationship. Intrusive rocks: BJ – Baijiadian, DS – Dushan, DSZ – Dashizhuzi, GJ – Gaojiadian, GSZ – Gushanzi, HK – Hekanzi, JG – Jinbaogou, JJ – Jiajiashan, LW – Luowenyu, MJ – Maojiagou, NX – Niuxinshan, QS – Qingshankou, SJ – Sanjia, TZ – Tangzhangzi, XY – Xiaoyingzi, YE – Yu’erya, YZ-Yangzhangzi, ZJ-Zhaojiazhuang.
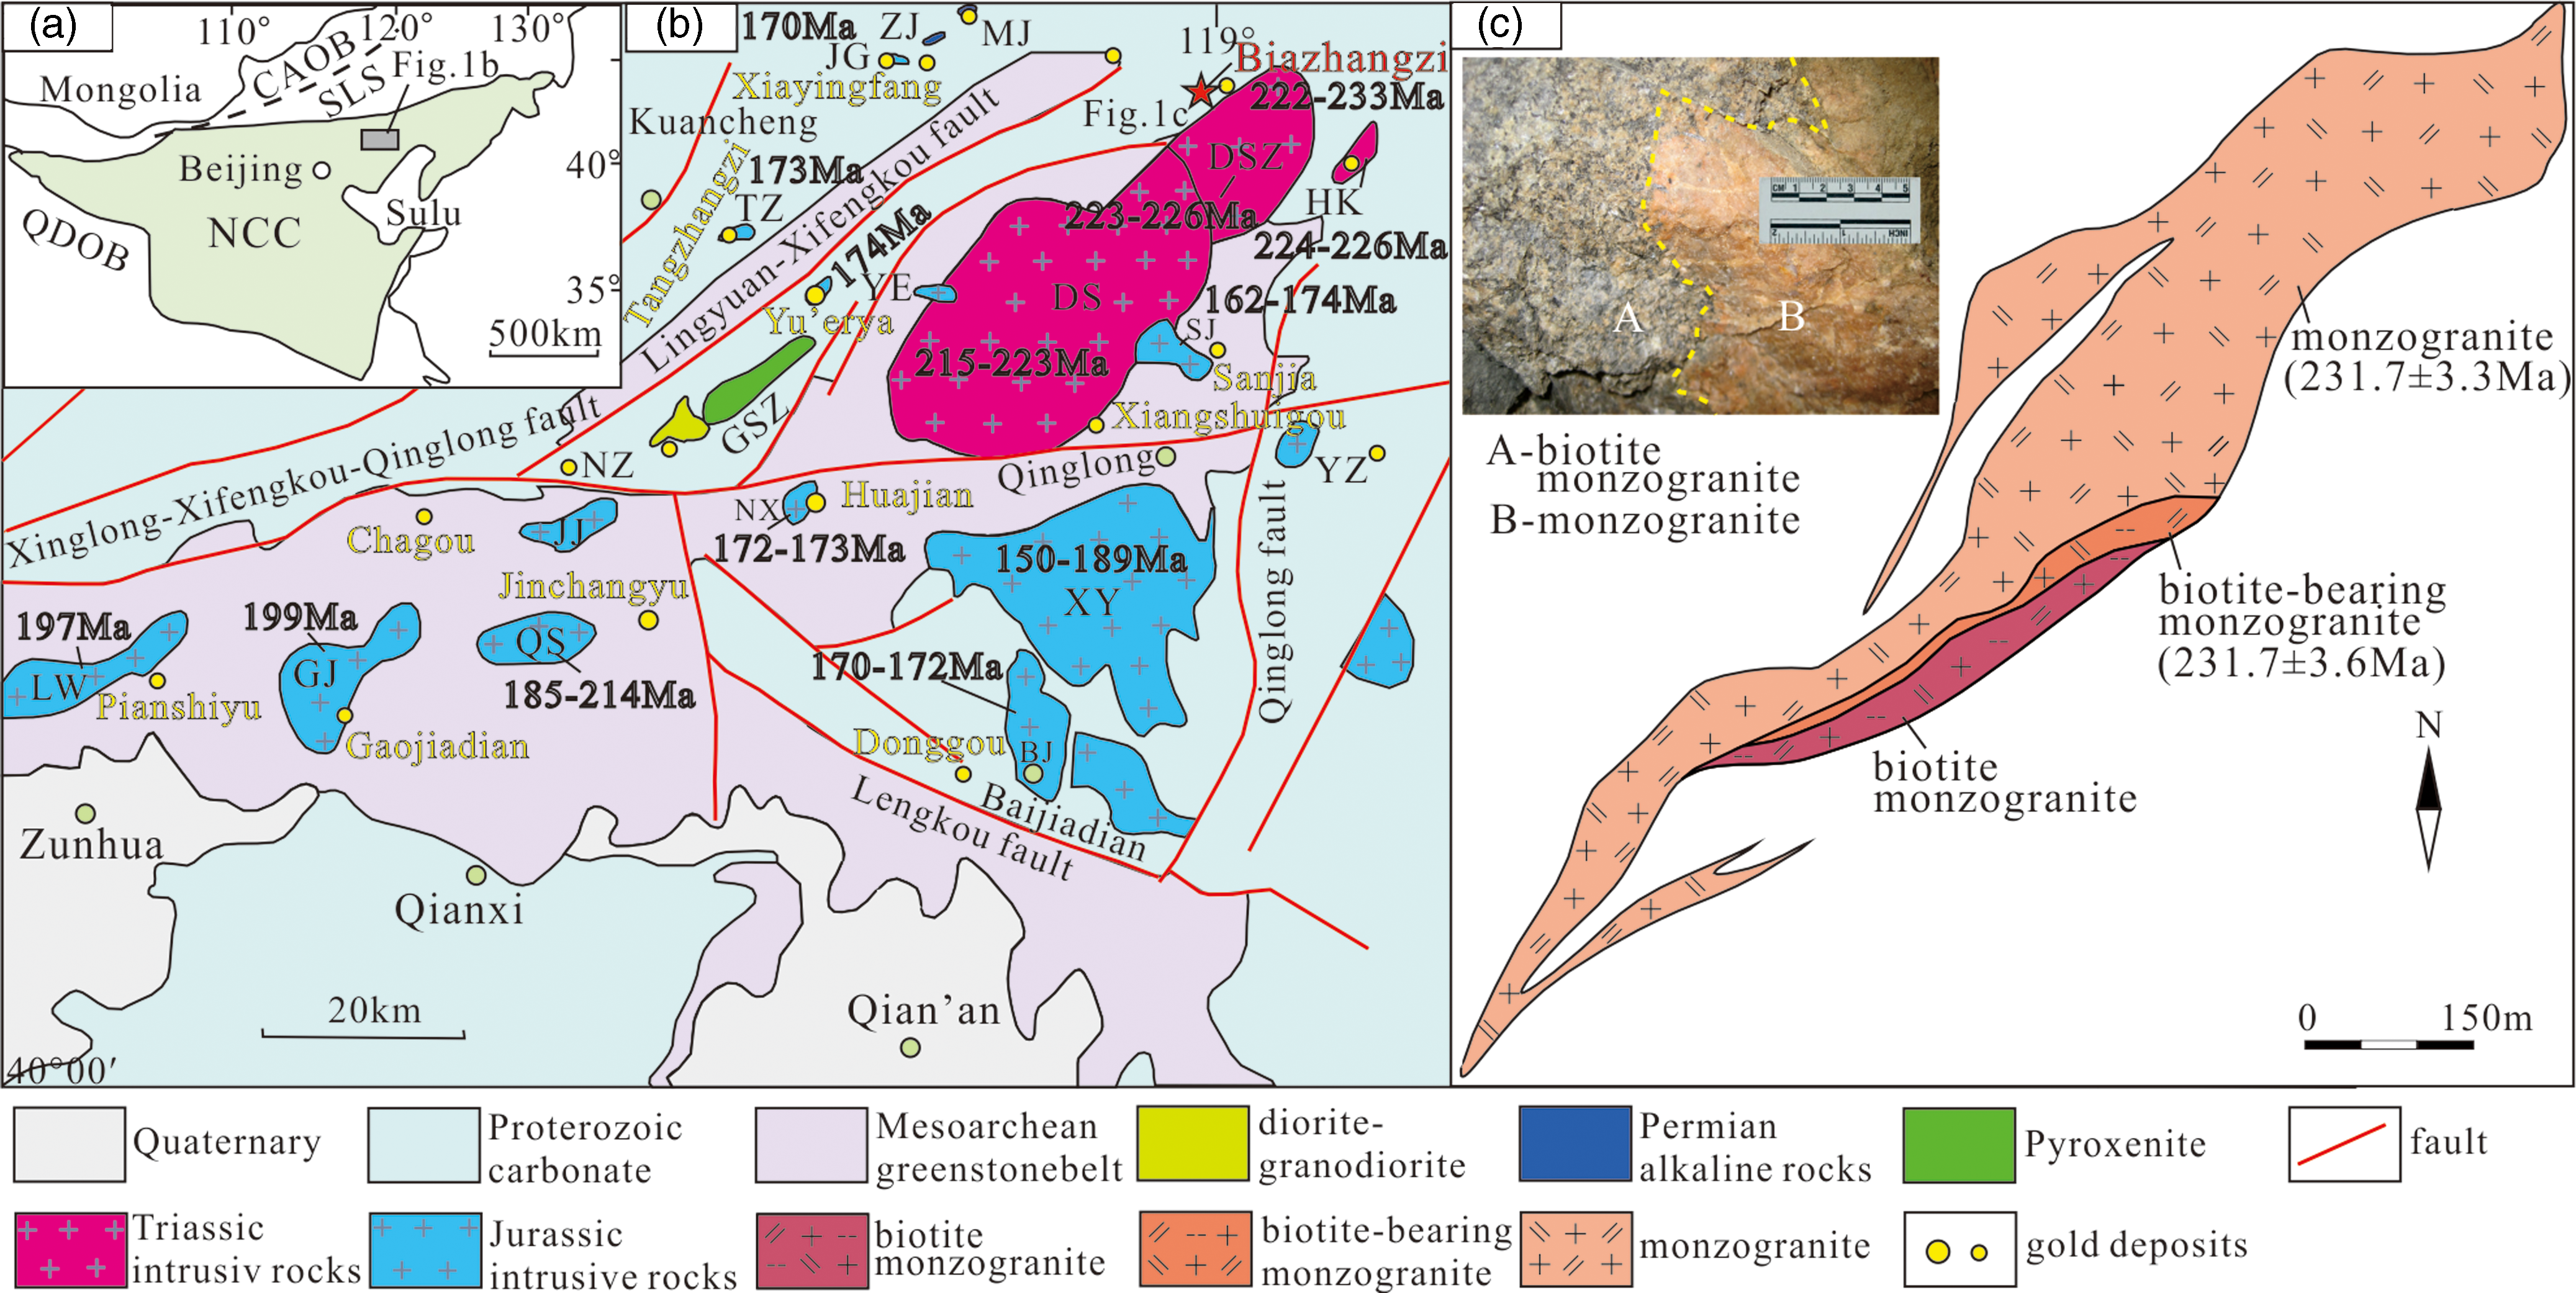
The Baizhangzi gold deposit, one of the typical IRGDs, is hosted by the Baizhangzi granite (BZG). Previous studies reported zircon SHRIMP (222 ± 3 Ma) (Luo et al. Reference Luo, Li, Guan, Qiu, Qiu, McNaughton and Groves2004) and LA-ICP-MS age (233 ± 3 Ma) (Xiong et al. Reference Xiong, Shi, Li, Tian, Chen, Zhou, Zhao and Li2017) of the BZG. The ore formation mechanism and metallogenic prognosis (Wang, Reference Wang1989; Wei et al. Reference Wei, Xuan, Ma, Diao, Liu, Zheng, Guo and Zhang2016; Wang et al. Reference Wang2018) were also reported. However, the factors which are conducive to the gold mineralization during the magmatic process have not been clarified. In this study, we present detailed petrography, bulk geochemistry, zircon U-Pb isotope and trace element data, as well as EPMA mineral compositions, with a view to evaluate the magmatism associated with gold mineralization to provide guidelines for the future mineral exploration in the area.
2. Geological setting and petrology
2.a. Geological setting
The NCC, as one of the oldest cratons in the world with a basement rocks as old as 3.8 Ga (e.g. Zhai & Santosh, Reference Zhai and Santosh2011), is bordered by the Central Asian Orogenic Belt (CAOB) in the north, the Qinling-Dabie Orogenic Belt (QDOB) in the south and the Sulu Orogen in the east (Fig. 1a). The basement of the NCC is composed of metamorphosed Archaean and Paleoproterozoic rocks, including tonalite-trondhjemite-granodiorite (TTG) gneisses, amphibolite and a few supracrustal rocks (Lu et al. Reference Lu, Zhao, Wang and Hao2008; Kong et al. Reference Kong, Xu, Yin, Chen, Li, Guo, Yang and Shao2015). These are overlain by post-Mesoproterozoic and Cambrian-Ordovician marine clastic and carbonate rocks, Middle and Late Carboniferous marine and continental facies, Permian to Triassic fluvial and delta facies sedimentary rocks and Jurassic-Cretaceous sedimentary and volcanic rocks. After the final cratonization of the NCC during the late Paleoproterozoic at about 1.85 Ga (Wilde et al. Reference Wilde, Zhao and Sun2002; Zhao & Zhai, Reference Zhao and Zhai2013), the craton remained mostly stable prior to Triassic. During Mesozoic, the NCC witnessed intense magmatic activity during six stages: Early Triassic, Middle-Late Triassic, Early Jurassic-earliest Middle Jurassic, Middle-Late Jurassic, Early Cretaceous and Late Cretaceous (Zhang et al. Reference Zhang, Zhao, Davis, Ye and Wu2014). Among them, Permian-Triassic magmatic rocks are widely distributed in the Yinshan and Yanshan belts along the northern margin of the NCC (Zhang et al. Reference Zhang, Zhao, Liu, Hu, Song, Liu and Wu2010). Middle–Late Triassic intrusive rocks are mainly distributed in the northern and eastern NCC, Liaodong and Korean Peninsula (Wu et al. Reference Wu, Yang and Liu2005a, Reference Wu, Han, Yang, Wilde and Zhai2007). Early Jurassic–earliest Middle Jurassic igneous rocks are mainly distributed in the southern Yanbian area (Wu et al. Reference Wu, Sun, Ge, Zhang, Grant, Wilde and Jahn2011) and Western Hills of Beijing in the northern NCC (Liu et al. Reference Liu, Li, Guo, Hou and He2012). Middle–Late Jurassic magmatic rocks are widely distributed in the Yanshan Belt in the northern NCC, the Liaodong area and Jiaodong Peninsula in the eastern NCC, the southern Yanbian-Liaobei area in the northeastern NCC and in the northern part of North Korea (Wu et al. Reference Wu, Sun, Ge, Zhang, Grant, Wilde and Jahn2011). Early Cretaceous igneous rocks are widely distributed throughout the eastern and central NCC and are considered to be a ‘giant igneous event’ in eastern China (Wu et al. Reference Wu, Lin, Wilde, Zhang and Yang2005b). Late Cretaceous magmatic rocks are relatively minor and distributed in the eastern part of the NCC (Zhang et al. Reference Zhang, Ma, Liao, Zhang and She2011).
The eastern Hebei – western Liaoning district, located in the northern margin of the NCC, is underlain by gneiss, amphibolite and granulites of the Mesoarchean Badaohe Group (Fig. 1b), with Proterozoic carbonate and Quaternary cover (Miao et al. Reference Miao, Qiu, Fan and Zhang2008; Zhang et al. Reference Zhang, Zhang, Danyushevsky, Wu, Alexis, Liao and Zhang2020). Dozens of intrusive rocks occur in this area, including the Dushan, Dashizhu, Hekanzi, Xiaoyingzi, Qingshan and BZGs, etc. (Fig. 1b), which belong to three periods of magmatism (Miao et al. Reference Miao, Qiu, Fan and Zhang2008): ∼220 Ma, 190 Ma–200 Ma and ∼170 Ma. Among them, the DSB is the largest with nearly 30 km in NE-SW and ∼17 km in E-W and an elliptic shape area of over 450 km2 (Miao et al. Reference Miao, Qiu, Fan and Zhang2008). Previous zircon U-Pb dating reported ages of 215.3 Ma (Rao et al. Reference Rao2002), 223 Ma (Luo et al. Reference Luo, Miao, Guan, Qiu, Qiu, McNaughton and Groves2003), 221–222 Ma (Ye et al. Reference Ye, Zhang, Zhao and Wu2014), 218 Ma (Jiang et al. Reference Jiang, Bagas, Liu and Zhang2018), 162 Ma and 170 Ma (Jiang et al. Reference Jiang, Bagas, Liu and Zhang2018), indicating magmatism during Late Triassic and Middle-Late Jurassic. There are a series of E-, NE- and NNE-trending faults and folds (Fig. 1b, e.g. EW-trending Xinglong-Xifengkou-Qinglong fault, Lingyuan fault extending NE-SW and Malanyu anticline) in the western Liaoning region (Zhang et al. Reference Zhang, Zhang, Danyushevsky, Wu, Alexis, Liao and Zhang2020). The E-trending faults are generally parallel to the northern margin of the NCC, which is believed to be related to the southward subduction of the Paleo-Asian Ocean (Davis et al. Reference Davis, Zheng, Wang, Darby, Zhang and Gehrels2001). The NE- to NNE-trending faults are in general parallel to the Tanlu fault, considered to be related to the subduction of the Pacific plate (Cox et al. Reference Cox, Dabiche, Engebretson and Ben-Avraham1989; Miao et al. Reference Miao, Qiu, Fan and Zhang2008).
2.b. The Baizhangzi granitoid
The BZG, located 3 km north of the Dashizhu (DSZ) granite (Fig. 1b), is the main ore-bearing rock of the Baizhangzi gold deposit. It occurs as a stock or dike along the NNE-trending fault, with an exposed area of 1 km2, intruding the Proterozoic clastic rocks and Triassic diorite (Luo et al. Reference Luo, Li, Guan, Qiu, Qiu, McNaughton and Groves2004; Xiong et al. Reference Xiong, Shi, Li, Tian, Chen, Zhou, Zhao and Li2017). Our field investigation and microscopic observation revealed that the Baizhangzi stock intrusion is composed of medium to fine biotite monzogranite, biotite-bearing monzogranite and monzogranite (BZGs) (Fig. 1c). These granites are separated by transitional boundaries (Fig. 1c).
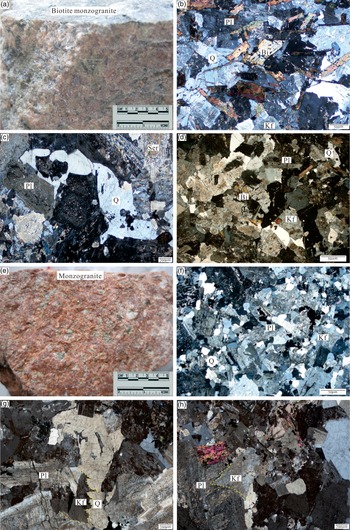
Biotite monzogranite occurs as medium to fine-grained, dark red rocks (Fig. 2a), composed of plagioclase (35–40%), K- feldspar (30–35%), quartz (ca. 20%) and biotite (10–15%) (Fig. 2b). Zircon, apatite and magnetite are accessory minerals. Plagioclase is often euhedral with prismatic to lath-like form, and a few crystals are selectively sericitized (Fig. 2c). K- feldspar is present as sub-euhedral to anhedral. Quartz commonly is anhedral. Biotite occurs as euhedral to sub-euhedral with strong pleochroism from yellowish brown to dark reddish brown, and a few of them are altered into chlorite.
Photographs of BZGs. (a) and (b) Biotite Monzogranite. (c) Sericitization. (d) Biotite-bearing monzogranite. (e) and (f) Monzogranite. (g) Silicification (quartz metasomatic K- feldspar). (h) Potassium (K- feldspar metasomatic plagioclase). Ser – sericite; Bi – biotite; Kf – K- feldspar; Pl – plagioclase; Q – quartz.

Biotite-bearing monzogranite contains much less plagioclase (30–35%) and biotite (5 - 10%), while little more quartz (20–25%) (Fig. 2d). The accessory mineral types and alteration characteristics are the same as those of biotite monzogranite.
Monzogranite is constituted mainly by plagioclase (30–35%), K- feldspar (35–40%) and quartz (25%±), with <5% biotite (Fig. 2e, f). The accessory minerals are zircon, apatite and magnetite. These rocks occur as white or red colours, which is interpreted as silicification (Fig. 2g), and potassium alteration (Fig. 2h).
3. Analytical methods
3.a. LA-ICP-MS Zircon trace elemental and U-Pb dating
Zircon separations were performed at the Xinhang Institute of Surveying and Mapping in Hebei Province through panning, heavy liquid and magnetic separation. Around 180 zircons, with complete crystal shape, with no cracks and no inclusions, were selected under binocular and mounted with epoxy resin on a glass plate and polished. The transparent, reflected light and cathodoluminescence (CL) images were obtained at the Beijing Zhongke Mineral Research Testing Technology Co., Ltd. Zircon trace element and U-Pb analyses were conducted in the Beijing Zirconian Pilot Technology Co., Ltd., Beijing, China, using the UP 213 nm laser ablation system and Agilent 7500A ICP-MS produced by New Wave. Helium gas was used as carrier gas, and the laser beam diameter was 30 μm. One 91500 standard sample was used for calibration of test data at every 10 sample points. Andersen (Reference Andersen2002) was used for the calibration of ordinary lead. ICPMSDataCal program (Liu et al. Reference Liu, Hu, Zong, Gao and Chen2010) was used to process the data, and U-Pb age concordance plots were plotted using Isoplot 3.0 (Ludwig, Reference Ludwig2003).
3.b. Whole-rock major and trace elements
The least altered samples were selected and crushed to less than 200 mesh. The whole-rock major and trace element compositions were analysed at the Wuhan SampleSolution Analytical Technology Co., Ltd., Wuhan, China. Major element oxides were measured by X-ray fluorescence spectrometer (XRF). Trace elements were determined using an Agilent 7700a ICP–MS. The standards for major and trace elements are GBW07103, GBW07105, GBW07111, and BHVO-2, BCR-2, RGM-2, respectively, and the relative standard deviation is <5% for both of them.
3.c. Electron probe microanalyses
The mineral compositions of the studied rocks were analysed using an electron microprobe analyser (EPMA; JXA-8100, JEOL) with a 15 kV accelerating voltage, 20 nA probe current and 5 μm beam diameter, at the Institute of Geology, Chinese Academy of Geological Science. SiO2, Al2O3, MgO, MnO, CaO, Na2O, K2O, FeO, TiO2, Cr2O3 and NiO were analysed. Line and spectrometer crystal used for major element are as follows: Si (Kα, TAP), Na (Kα, TAP), K (Kα, PETJ), Al (Kα, TAP), Mg (Kα, TAP), Mn (Kα, LIFH), Fe (Kα, LIFH), Cr (Kα, LIFH), Ni (Kα, LIFH), Ti (Kα, PETJ) and Ca (Kα, PETJ). Count times were 10s for peak and 5s for background per element. Natural and synthetic minerals used for standardization are as follows: (1) for plagioclase: albite (Na and Al), K- feldspar (K), rutile (Ti), NiO (Ni), Cr2O3 (Cr), Fe2O3 (Fe), spessartite (Mn), diopside (Ca and Mg), plagioclase/K- feldspar (Si); (2) for biotite: albite (Na and Al), K- feldspar (K), rutile (Ti), NiO (Ni), Cr2O3 (Cr), Fe2O3 (Fe), spessartite (Mn), diopside (Ca), Biotite (Si and Mg). ZAF corrections were carried out. The estimated precisions for major elements are ±2%.
4. Results
4.a. Zircon trace elemental and U-Pb ages
One sample each from the biotite-bearing monzogranite (No. 0-8) and monzogranite (No. -30-7) were selected for LA-ICP-MS zircon U-Pb dating and trace elements. The analytical data are listed in Supplementary Tables S1, S2.
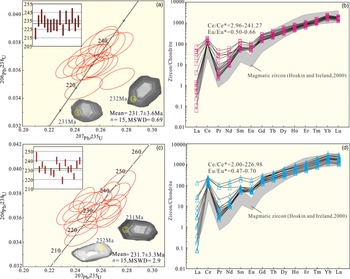
The zircon grains from both the biotite-bearing monzogranite and monzogranite are colourless and euhedral to subhedral. They show oscillatory zoning, without inherited cores in the CL images (Fig. 3a, c). The abundances of thorium and uranium of analysed spots range from 280 ppm to 1648 ppm, 245 ppm to 1390 ppm, respectively, corresponding to Th/U ratios between 0.92 and 1.35 (>0.4). Zircon shares light rare earth element (LREE)-inclined patterns, with varying contents of LREE, characteristics of the Ce-positive anomalies (Ce/Ce*) and Eu-negative anomalies (Eu/Eu*) (Fig. 3b, d), which are consistent with the characteristics of magmatic zircons (Hoskin & Ireland, Reference Hoskin and Ireland2000). All of such indicate a magmatic origin (Christopher et al. Reference Christopher, Keith and Robert2003; Jan & Sylvester, Reference Jan and Sylvester2003; Randall & Stephen, Reference Randall and Stephen2003).
U–Pb concordia diagrams with cathodoluminescence (CL) images of representative zircons analysed and zircon chondrite-normalized REE patterns from the BZGs. (a) and (b) Biotite-bearing monzogranite (sample No. 0-8). (c) and (d) Monzogranite (sample No. -30-7). Chondrite values are from Sun and McDonough (Reference Sun, Donough, Saunders and Norry1989).
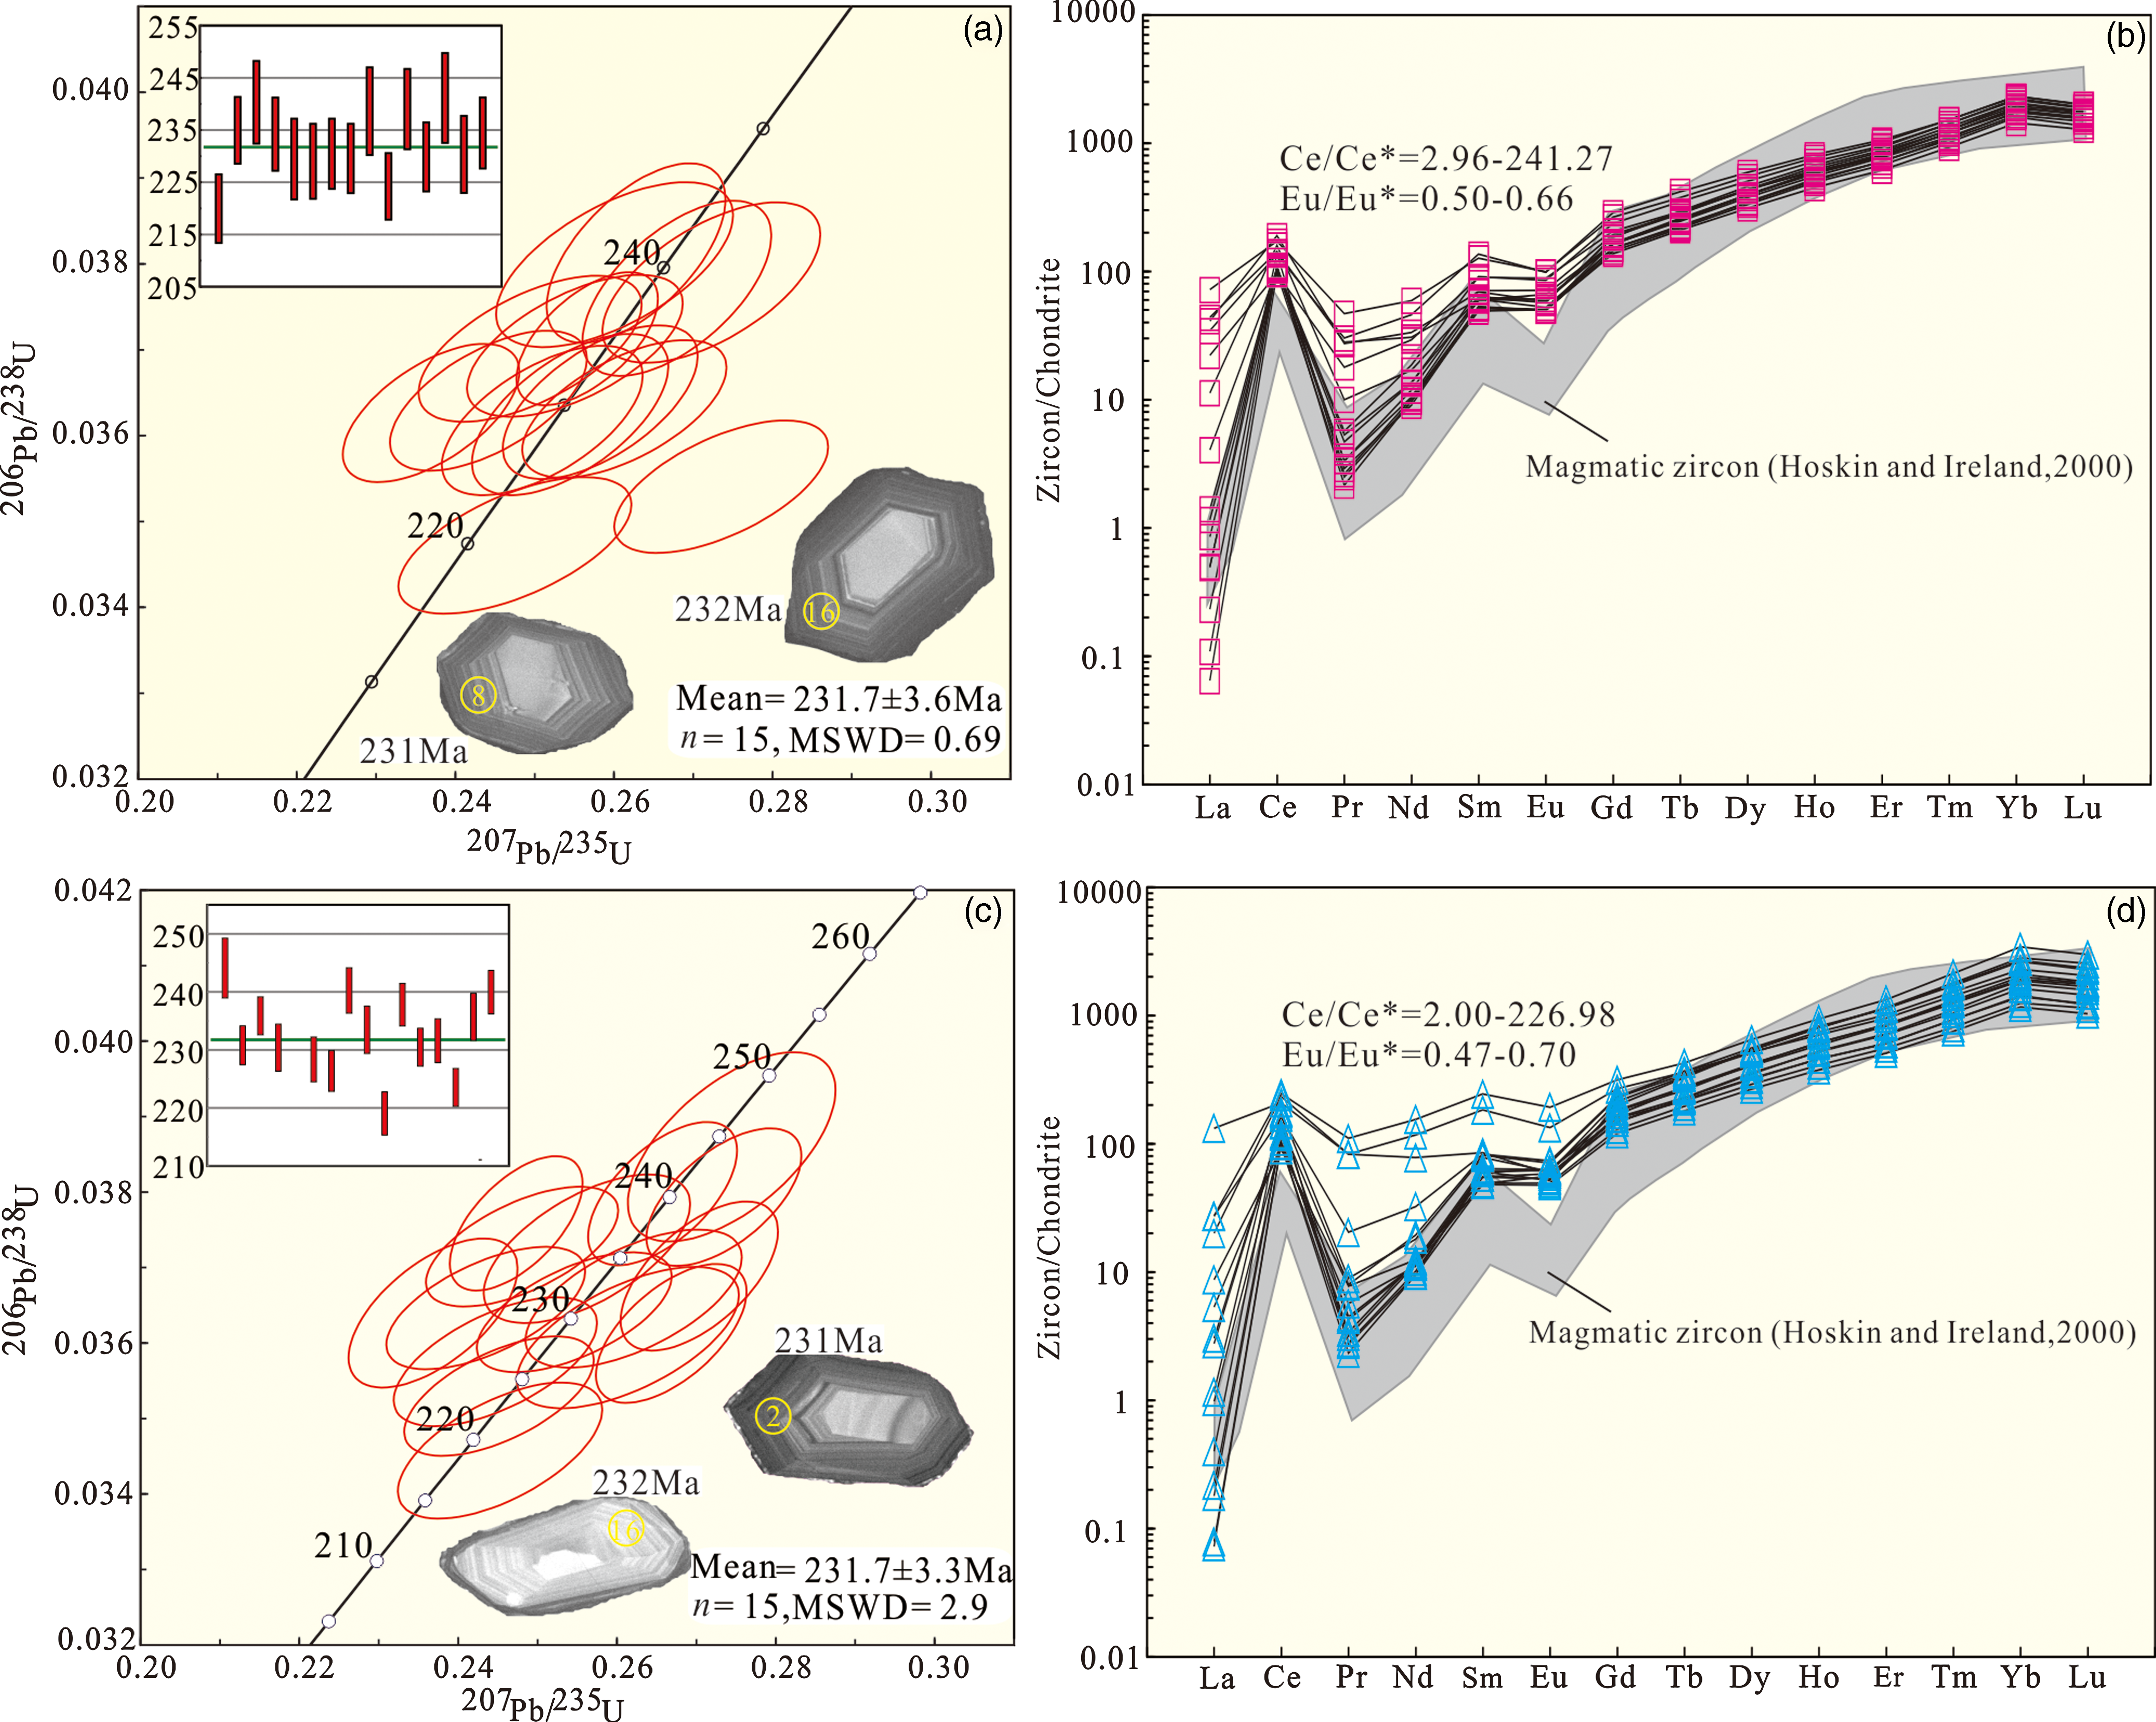
Fifteen zircons from sample 0–8 yielded 206Pb/238U ages from 230 to 238 Ma, with a weighted mean age of 231.7 ± 3.6 Ma (MSWD = 0.69) (Fig. 3a). Fifteen zircons in sample -30-7 yielded 206Pb/238U ages from 229 to 241 Ma, with a weighted mean age of 231.7 ± 3.3 Ma (MSWD = 2.9) (Fig. 3c). The two ages are almost identical to each other.
4.b. Whole-rock major and trace element compositions
Two biotite monzogranites, four biotite-bearing monzogranites and seven monzogranites of the BZGs were analysed in this work. Whole-rock major and trace element compositions of these samples are listed in Supplementary Table S3. The following data of major elements are recalculated after removing the LOI.
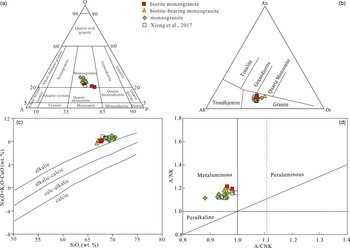
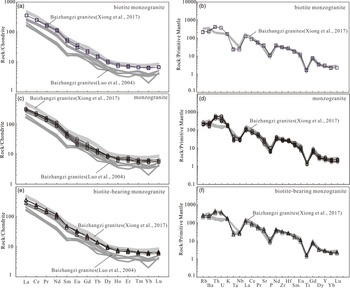
The SiO2 content of biotite monzogranite samples ranges from 67.57 to 67.81 wt%, and Na2O +K2O ranges from 9.77 to 9.99 wt%. The data fall in the monzogranite field in the QAP diagram (Fig. 4a) and plot to the granite field in the An-Ab-Or diagram (Fig. 4b). The values of Na2O +K2O −CaO range from 8.03 to 8.18 wt%, and the two data plot along with the alkaline series in a (Na2O+K2O −CaO) versus SiO2 diagram (Fig. 4c). The content of Al2O3 is between 15.75 and 16.38 wt%, with A/CNK values ranging from 0.96 to 0.98, and A/NK values between 1.20 and 1.22, identifying with the metaluminous field in an A/CNK versus A/NK diagram (Fig. 4d). The content of MgO ranges from 0.87 to 1.18 wt%, with the Mg values (nMg2+/ (nMg2+ +nFe2+)*100) from 40.48 to 42.36. The biotite monzogranite shows similar chondrite-normalized rare earth element (REE) patterns (Fig. 5a), with being enriched in LREE (LaN = 356.03–357.66, YbN = 6.21–6.53 and LaN/YbN = 54.8–57.4) and insignificant Eu anomaly (Eu/Eu* = EuN/[(SmN) ×(GdN)]1/2 = 0.94–1.01). A primitive-mantle-normalized trace element diagram (Fig. 5b) shows negative anomalies for high field strength elements (HFSEs) (such as Nb, Ta, P and Ti) and variable enrichment in large ion lithophilic elements (LILEs) (for instance, Rb, Ba, Th, U and Sr), with high Sr (793–855 ppm).
Classification diagrams of samples from the BZGs. (a) QAP diagram (Le Maitre, Reference Le Maitre2002). (b) An-Ab-Or diagram (Barker & Millard, Reference Barker and Millard1979). (c) (Na2O +K2O-CaO) vs. SiO2 (Frost et al. Reference Frost, Barnes, Collins, Arculus, Ellis and Frost2001). (d) A/NK vs. A/CNK diagram (Manilar & Piccoli, Reference Manilar and Piccoli1989).
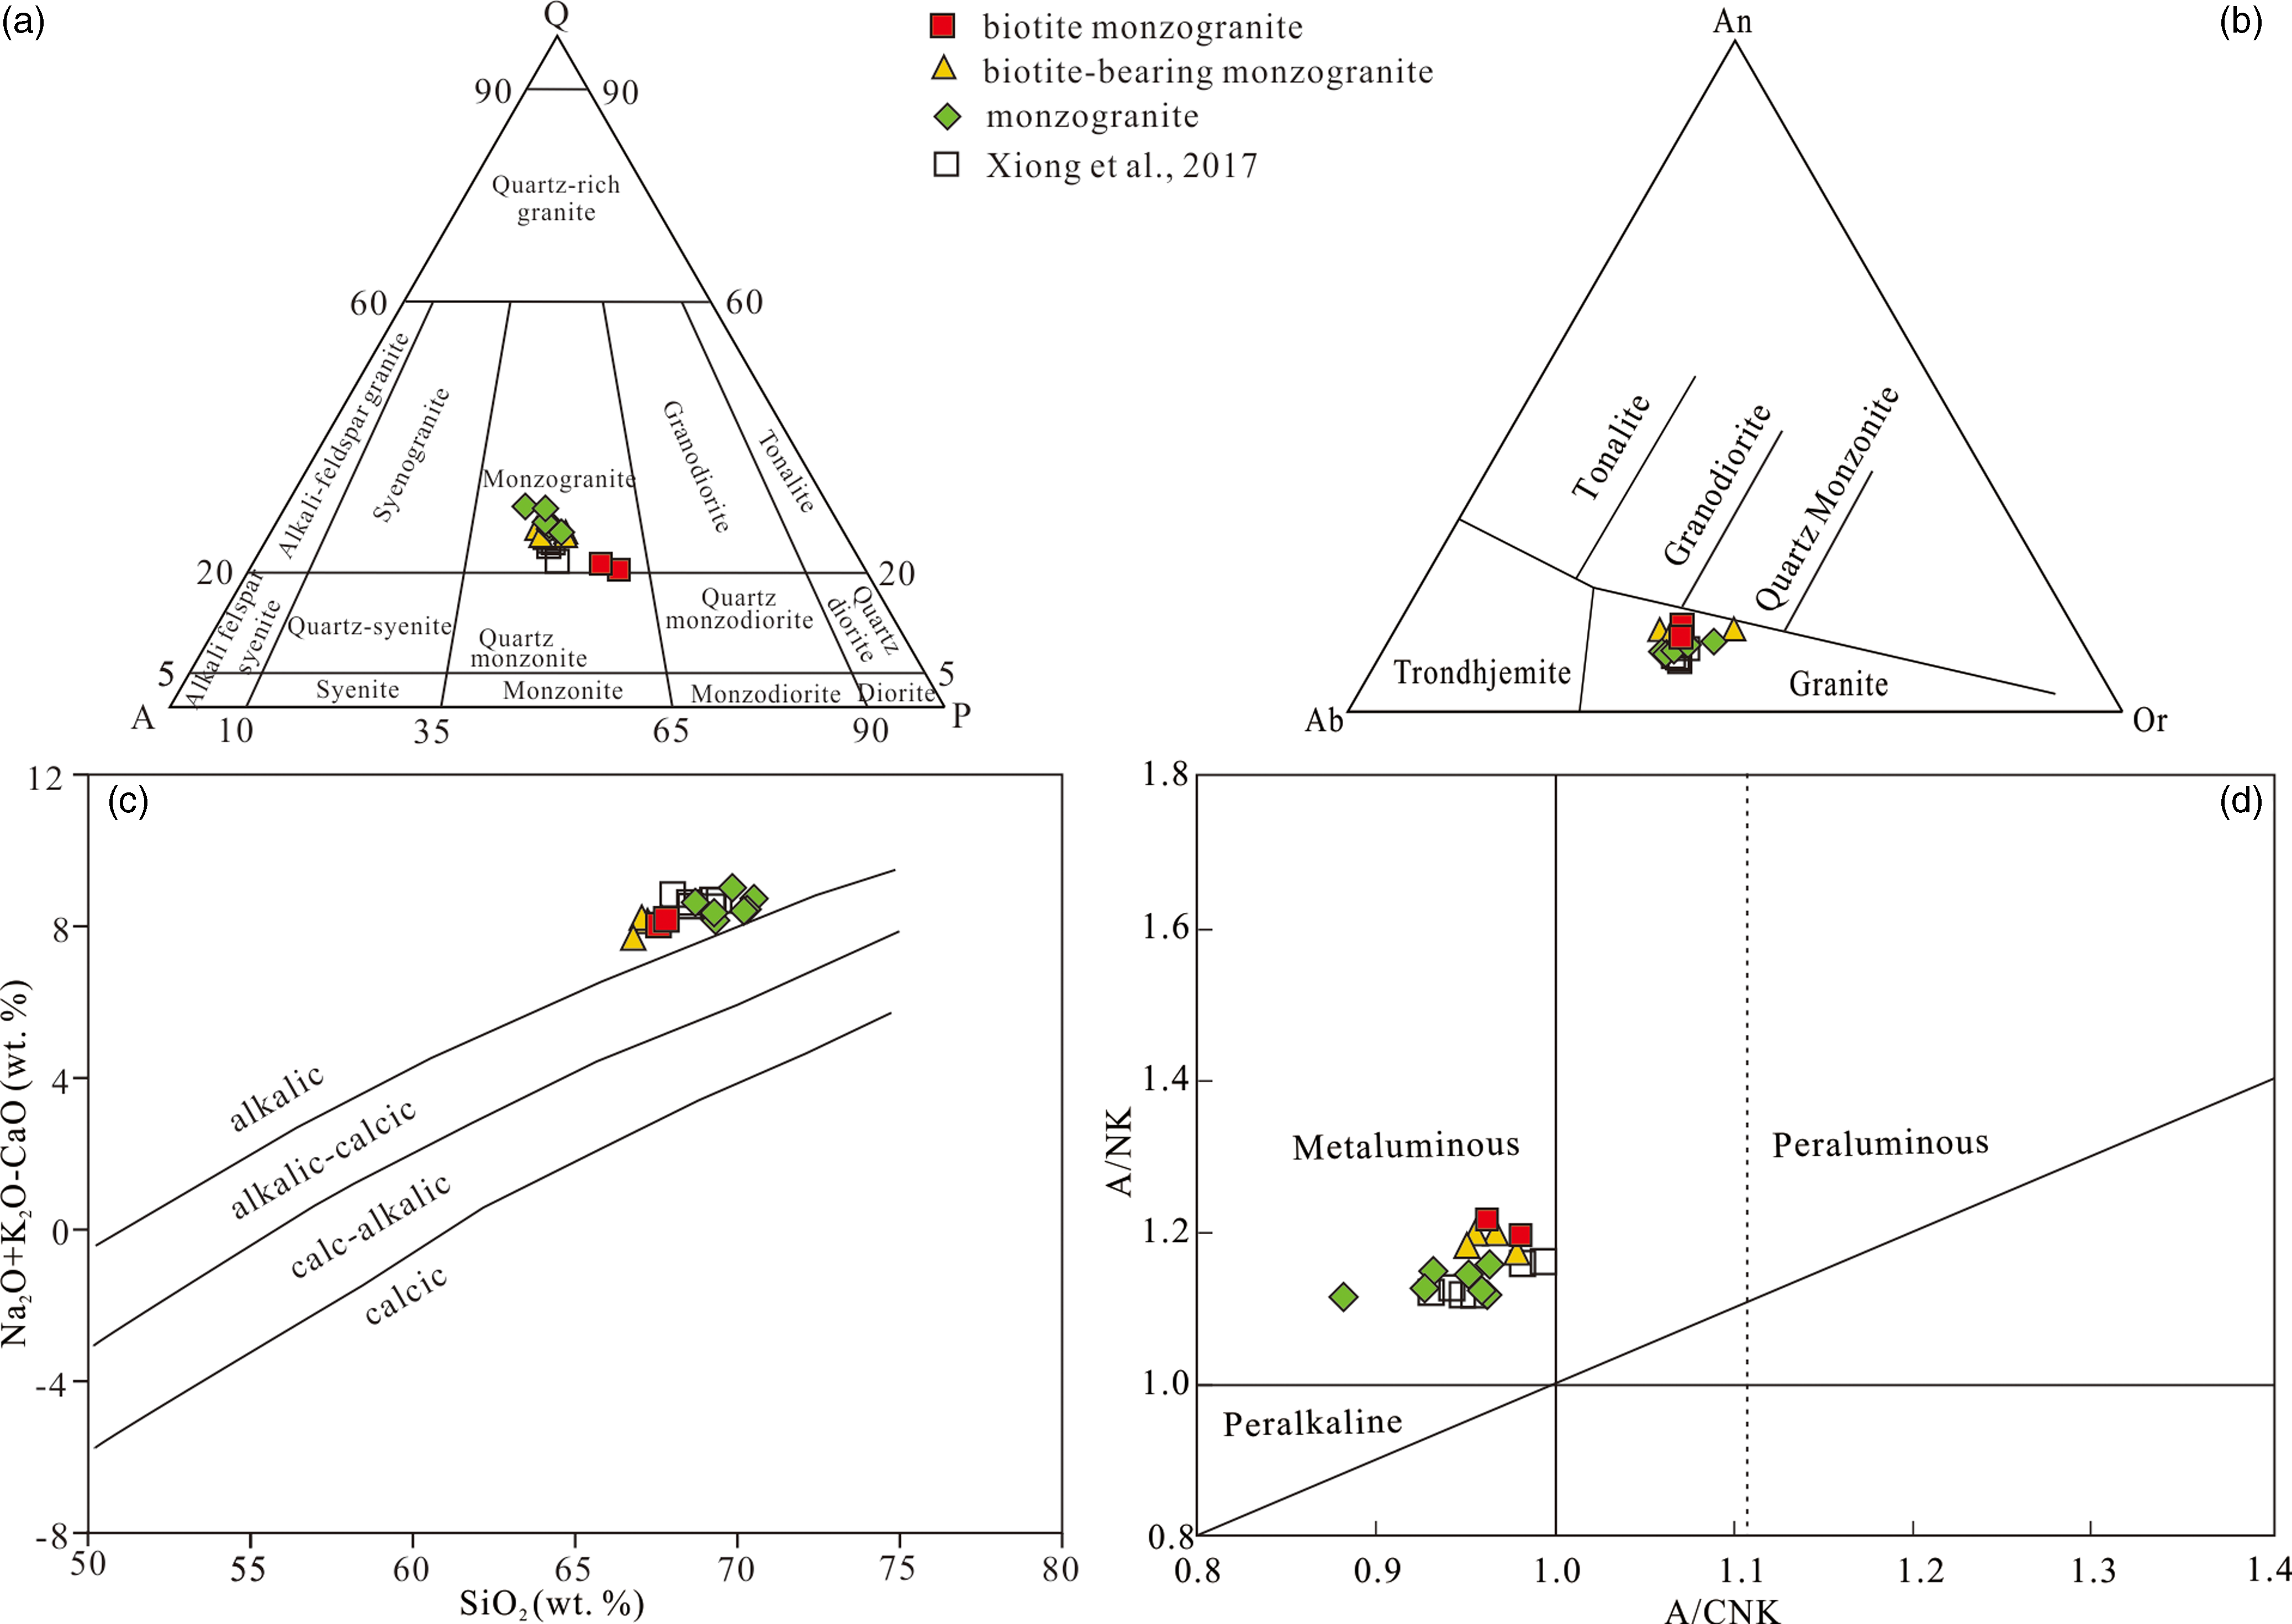
Chondrite-normalized rare earth element (REE) patterns (a, c, and e) and primitive-mantle-normalized trace element spider diagrams (b, d, and f) are shown. Chondrite values and primitive-mantle values are from Sun and McDonough (Reference Sun, Donough, Saunders and Norry1989).
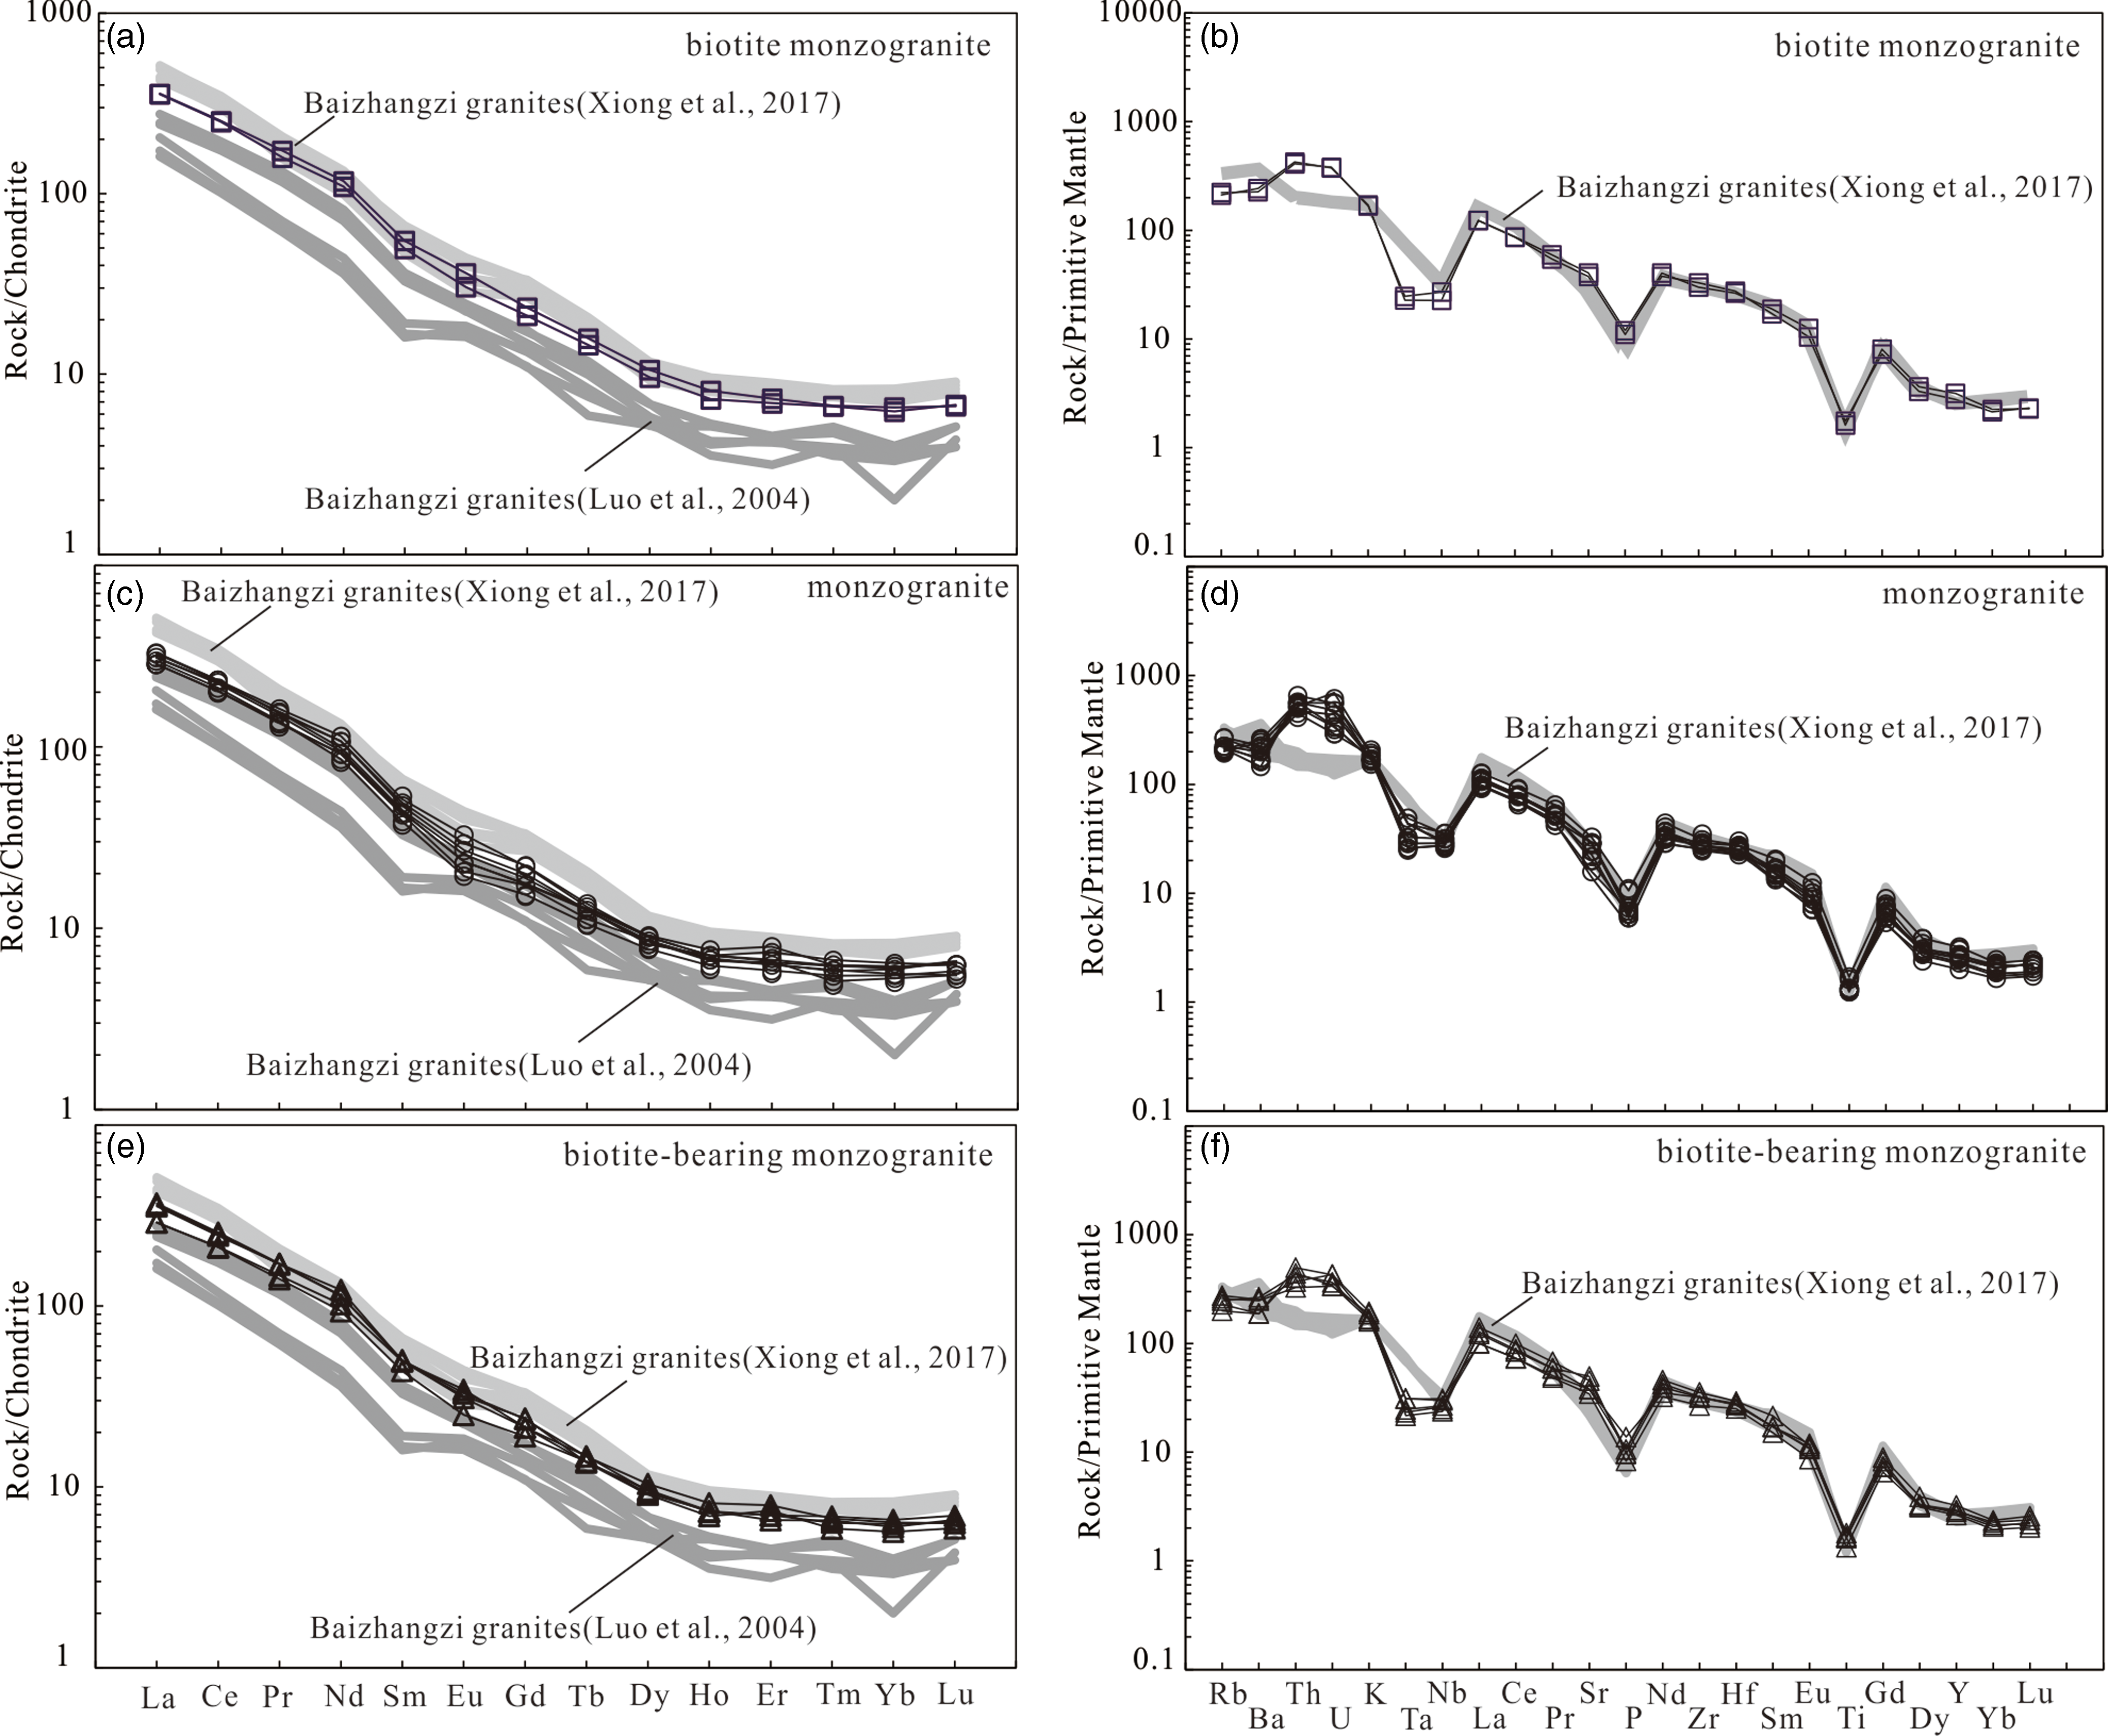
The monzogranite exhibits higher SiO2 (from 68.70 to 70.51 wt%), and Na2O +K2O (9.87–10.25 wt%). In a QAP diagram (Fig. 4a), they all fall into the monzogranite field, which is consistent with plotted in the granite field in the An-Ab-Or diagram (Fig. 4b). The Na2O +K2O −CaO contents vary widely, from 8.15 to 9.02, and the data mainly plot along with the alkalic series in a (Na2O+K2O −CaO) versus SiO2 diagram (Fig. 4c). The Al2O3 content ranges from 15.16 to 15.56, with A/CNK and A/NK values 0.88- 0.96, 1.11- 1.16, respectively, corresponding to the metaluminous field in an A/CNK versus A/NK diagram (Fig. 4d). The MgO content ranges from 0.46 to 0.82 wt% (average of 0.66 wt%), with the Mg values (nMg2+/ (nMg2+ +nFe2+) *100) from 29.23 to 47.31. The monzogranite shows similar characteristics in the chondrite-normalized REE diagram (Fig. 5c) and primitive-mantle-normalized trace element diagram (Fig. 5d) with the biotite monzogranite, while the lower Sr (420–612 ppm) and Eu/Eu* (0.77–0.89) relatively, suggesting that the crystallization of plagioclase may have occurred.
The biotite-bearing monzogranite displays a coherent behaviour of major and trace elements with the other rock types (Figs. 4, 5) suggesting that the biotite monzogranite, biotite-bearing monzogranite and monzogranite are likely cogenetic, and magma evolution may have played an important role in their formation.
For the BZGs, we used the samples of Xiong et al. (Reference Xiong, Shi, Li, Tian, Chen, Zhou, Zhao and Li2017) and Luo et al. (Reference Luo, Li, Guan, Qiu, Qiu, McNaughton and Groves2004).
4.c. Mineral geochemistry
Representative grains of plagioclase and biotite were analysed by microprobe for mineral chemistry.
4.c.1. Plagioclase
The following samples were analysed: thirteen plagioclases from the three biotite monzogranite samples (20BZ125, 20BZ126, 20BZ07), fourteen plagioclases from the three biotite-bearing monzogranite samples (120-1, 19BZ38, 20BZ16) and thirty-five plagioclases from the nine monzogranite samples (150-1, 0-12, 20BZ31, 20BAZ36, 108-12, -30-5, 20BZ01, 19BZ41, 19BZ35). Plagioclase in the BZGs is generally fresh to slightly altered and euhedral to subhedral tabular crystals, exhibiting obvious polysynthetic twinning under cross-polarized light. In this study, unaltered regions of plagioclase were selected for chemical composition analysis; therefore, the analysis results are little or not affected by alteration. Some representative data are listed in Supplementary Table S4.
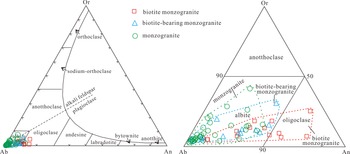
The major element contents of plagioclase from the biotite monzogranite are as follows: SiO2 (63.5–67.9 wt%, average 65.7%), Al2O3 (19.5–23.0 wt%, average 20.8%), CaO (0.42–3.07 wt%, average 1.67%), FeO (0.08–0.58 wt%, average 0.23%), Na2O (9.2–11.8 wt%, average 10.6%) and K2O (0.1–0.8 wt%, average 0.36%), while An values range from An2.01 to An14.06, with an average of An7.84, corresponding to four of them belong to oligoclase and the other nine belong to albite in Ab-An-Or diagram (Fig. 6).
Ternary plots of plagioclase compositions (after Smith, Reference Smith1974), and the right is a 5× magnification of the projection area of the left.

The plagioclase from the monzogranite has higher SiO2 (ranges from 64.9 to 68.9wt%, average 67.3%), Na2O (9.3–12.3 wt%, average 11.3%) and K2O (0.06–3.12 wt%, average 0.41%); however, lower Al2O3 (19.0–21.5 wt%, average 19.9%), CaO (0.006–1.7 wt%, average 0.4%), FeO (0.003–0.66 wt%, average 0.17%) and An values (ranged from An0.03 to An7.78, with an average of An2.02), corresponding to all of them belong to albite (Fig. 6).
The average major element contents of plagioclase from the biotite-bearing monzogranite are as follows: SiO2 (66.8%), Al2O3 (20.2%), CaO (0.9%), Na2O (10.9) and An4.22, and all belong to albite (Fig. 6).
The composition and chemical formula of plagioclase listed in Supplementary Table S5 show that the number of Na, Ca, Al, Si from the biotite monzogranite ranges from 0.7922 to 1.0030 (average 0.9095), from 0.0198 to 0.1466 (average 0.0791), from 1.0098 to 1.2033 (average 1.0857), from 2.8205 to 2.9817 (average 2.9087), respectively. There are more Na and Si (average 0.9667, 2.9650, respectively), while less Ca and Al (average 0.0207, 1.0323, respectively) of the monzogranite. The number of cations (Na, Ca, Al, Si) lie between biotite monzogranite and monzogranite (average 0.9370, 0.0420, 1.0534, 2.9467, respectively) from the biotite-bearing monzogranite. The mean chemical formula of plagioclase from three types of rock are (Na0.9095, Ca0.0791) [Al1.0857Si2.9087O8], (Na0.9370, Ca0.0420) [Al1.0534Si2.9467O8] and (Na0.9667, Ca0.0207) [Al1.0323Si2.9650O8], respectively.
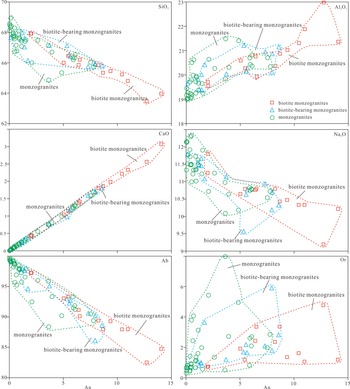
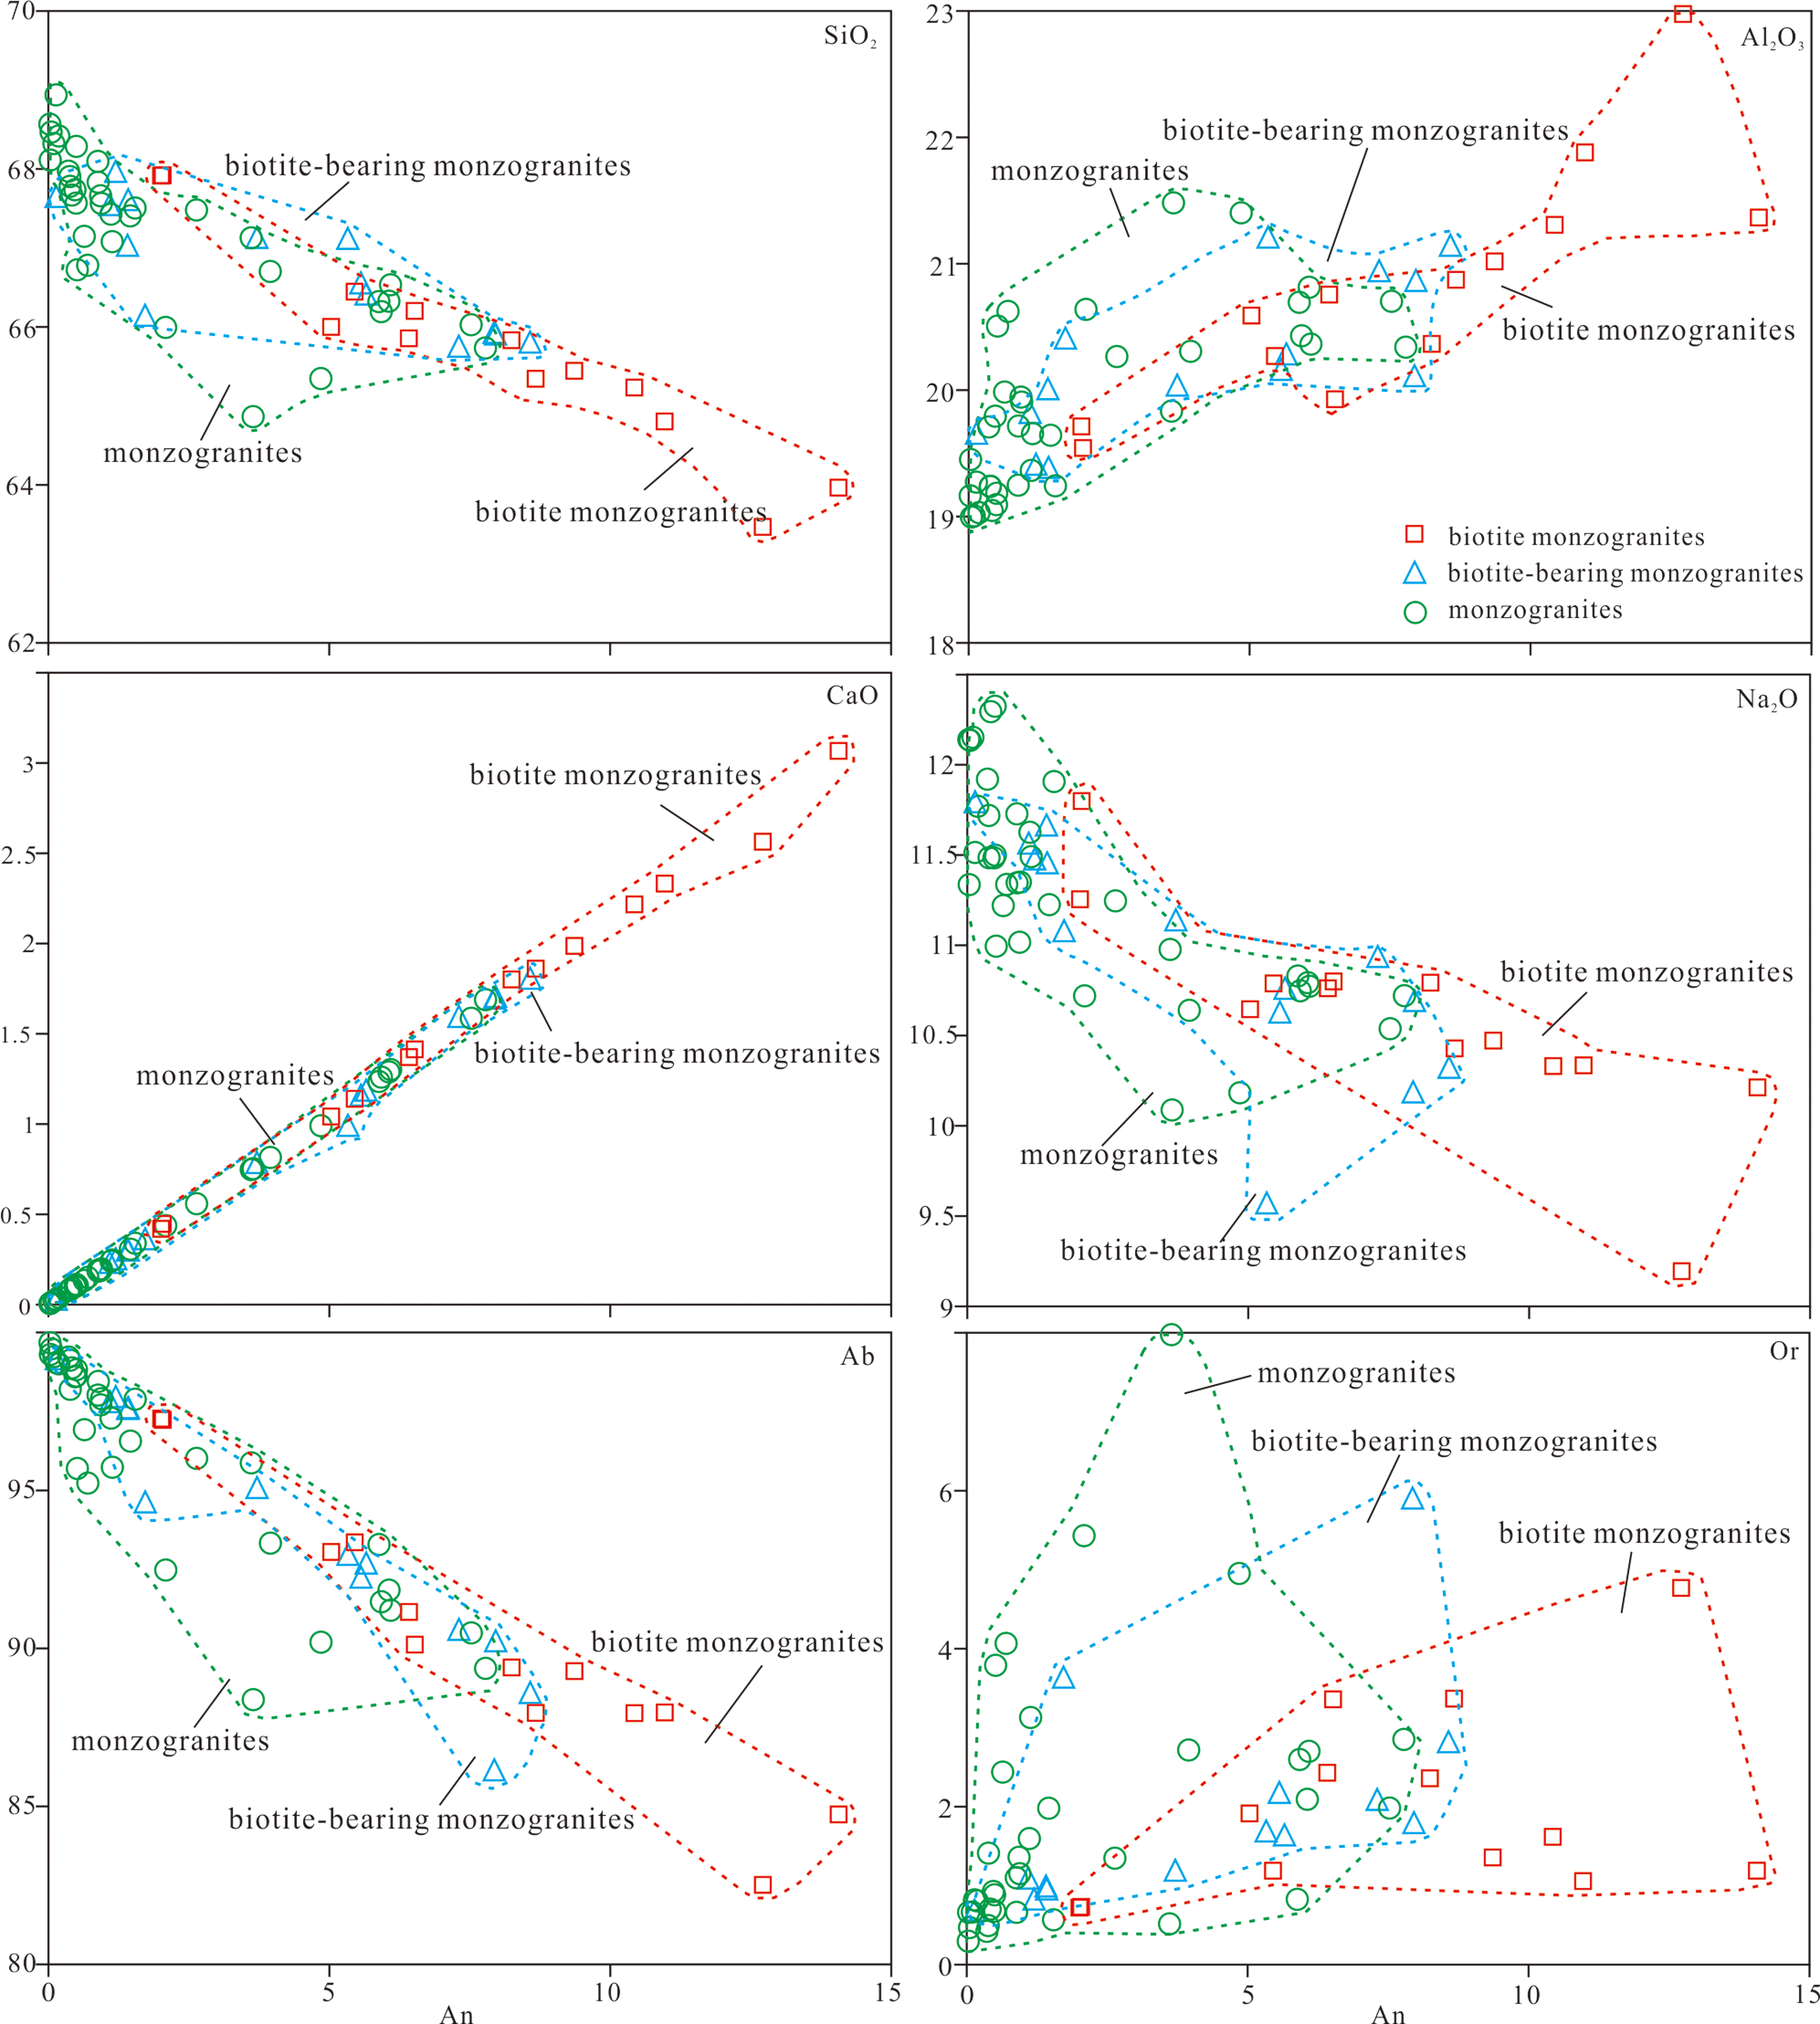
On the An vs. SiO2 Al2O3, CaO, Na2O, Ab, Or diagram (Fig. 7), plagioclase from the biotite-bearing monzogranite mostly plot between biotite monzogranite and monzogranite, exhibiting the same characteristic as the major and trace elements of the BZGs, which also suggests that the BZGs are products from cogenetic magma.
Correlation diagram of plagioclase compositions.
4.c.2. Biotite
The EPMA data and chemical formula of biotite are presented in Supplementary Table S6. The number of cations and related parameters is calculated using the Li (Li et al. Reference Li, Li, Xu, Yang, Wang, Xu and Ning2020) method, based on the general formula of A1M3T4O10W2.
The biotite from the biotite monzogranite shows SiO2 from 34.61 wt% to 36.32wt% (average 35.67%), Al2O3 in the range of 13.54–14.59 wt% (average 13.86 wt%), FeO of 18.73–23.88 wt%, (average 20.97 wt%), MgO of 9.80–12.15 wt% (average 11.55 wt%), TiO2 of 3.60–4.23 wt% (average 3.92 wt%) and K2O of 7.98–8.96 wt% (average 8.58 wt%).
The biotite from the biotite-bearing monzogranite shows SiO2 (35.27wt%), Al2O3 (13.29 wt%,), FeO (21.23 wt%), MgO (12.92 wt%), TiO2 (4.56 wt%) and K2O (7.59 wt%).
The biotite from the monzogranite has the highest SiO2 (36.92wt%) and MgO (13.16 wt%), while the lowest FeO (18.24 wt%) and TiO2 (4.56 wt%).
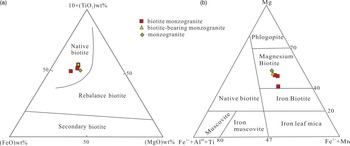
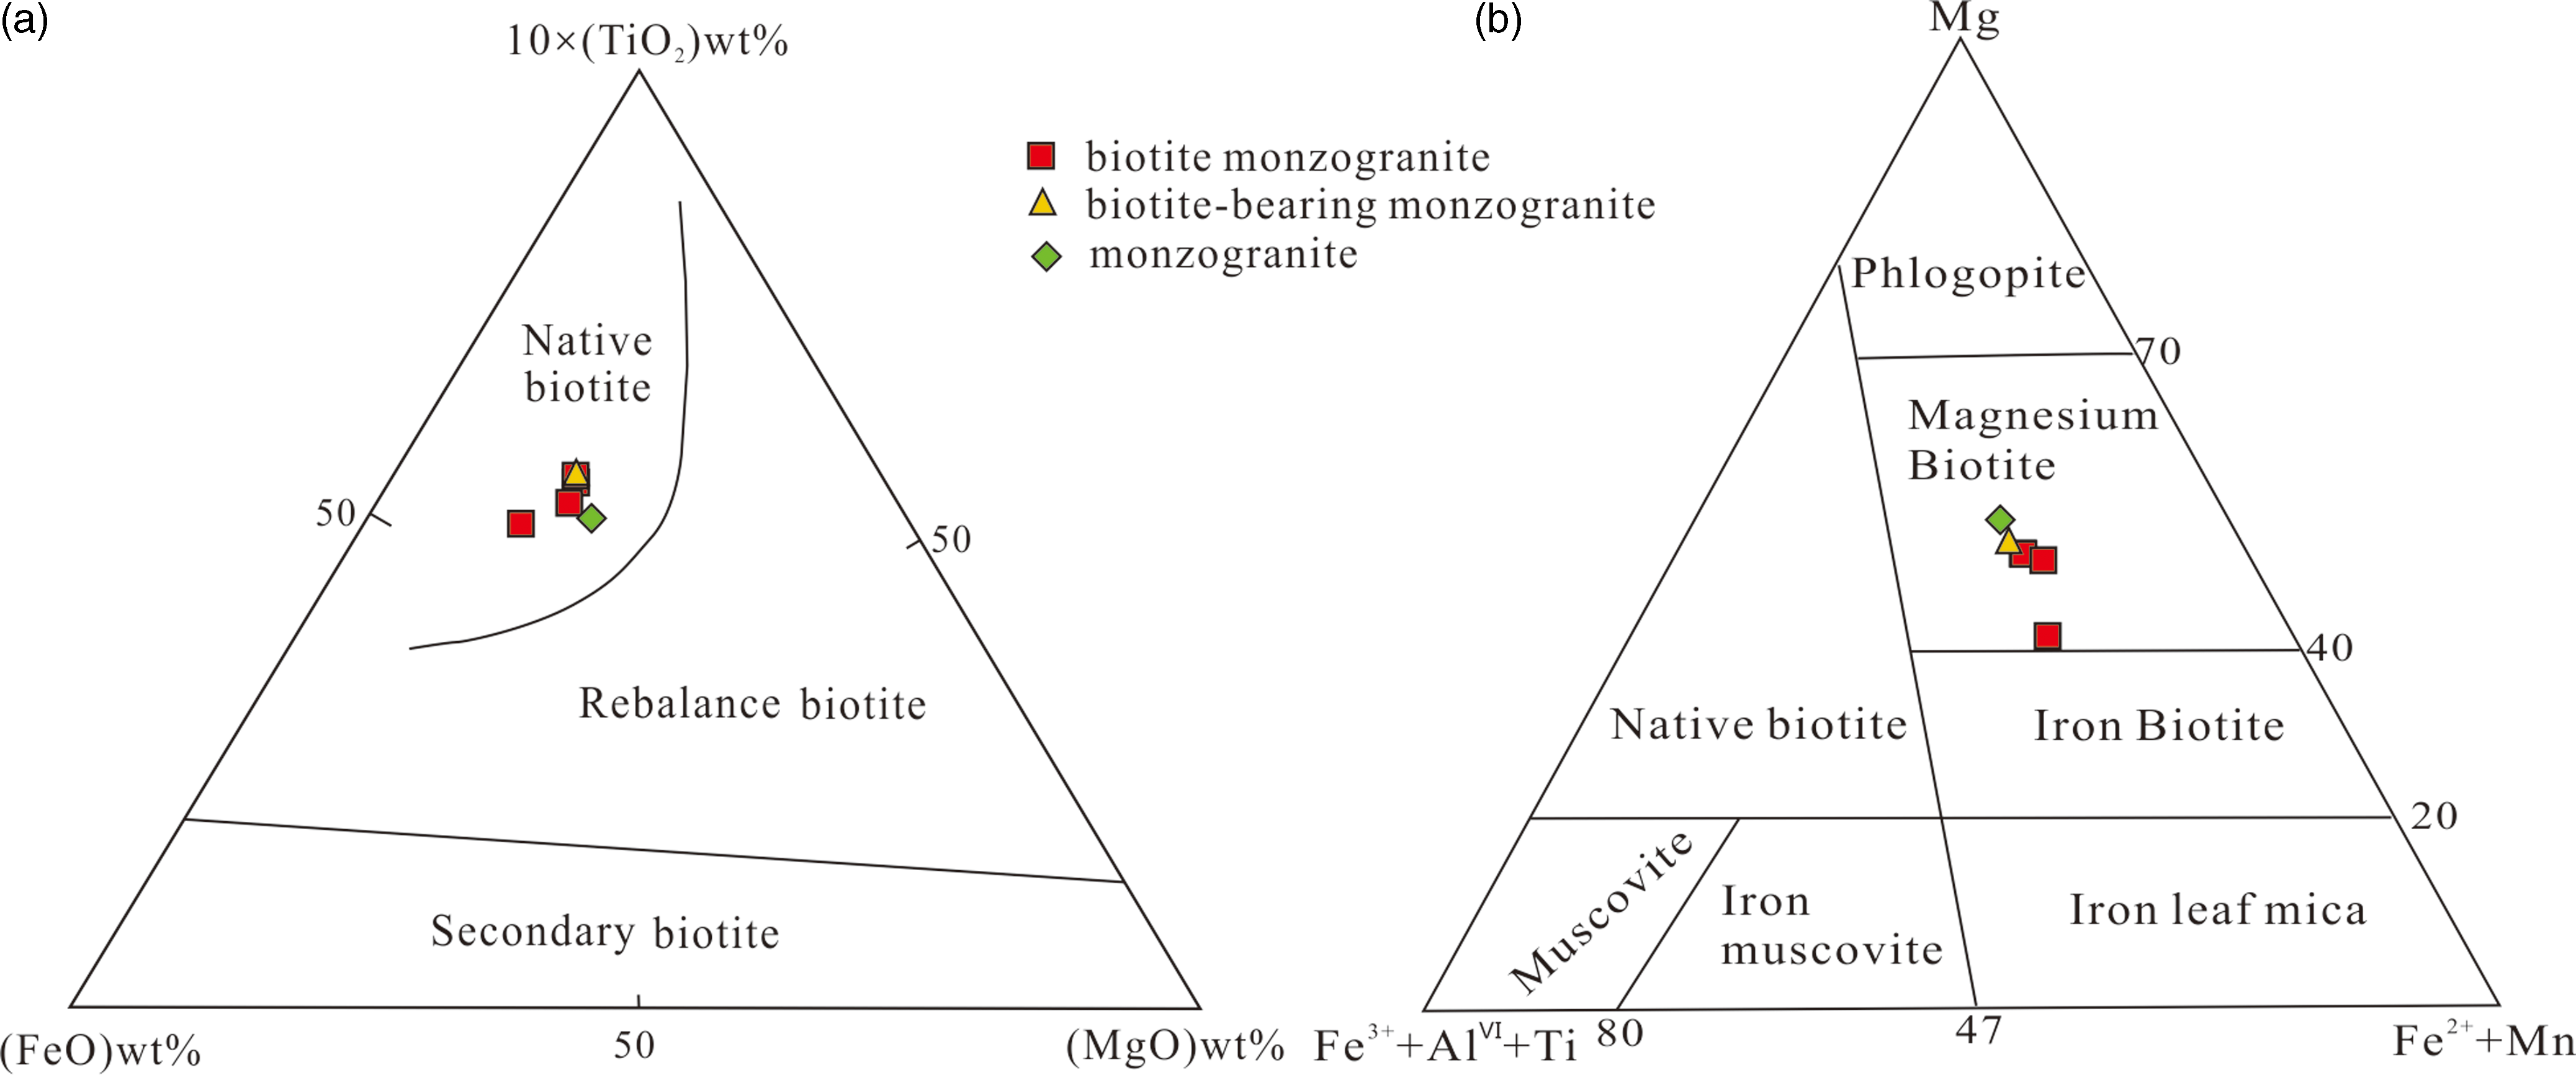
Fe /(Fe+Mg) ratio ranges from 0.44 to 0.58, suggesting that they were not been altered by fluids (Stone, Reference Stone2000), consistent with falling in the primary biotite field in the 10×TiO2-FeO-MgO diagram (Fig. 8a). The Mg/(Fe+Mg) ratio is relatively high, corresponding to magnesium biotite in the Mg-(AlVI+Fe3++Ti) –(Fe2++Mn) diagram (Fig. 8b). The Mg/(Fe+Mg) ratio increases gradually from the biotite monzogranite (average 0.49) to the monzogranite (0.56), indicating that the biotite became more Mg-rich as the magma evolved.
Genesis (a, after Nachit et al. Reference Nachit, Ibhi, Abia and Ohoud2005) and classification (b, after Foster, Reference Foster1960) diagram of biotite.
5. Discussion
5.a. Magmatic evolution
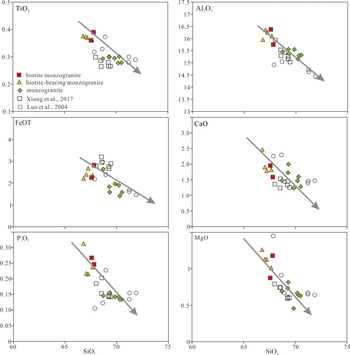
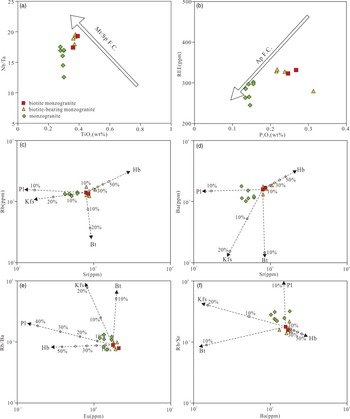
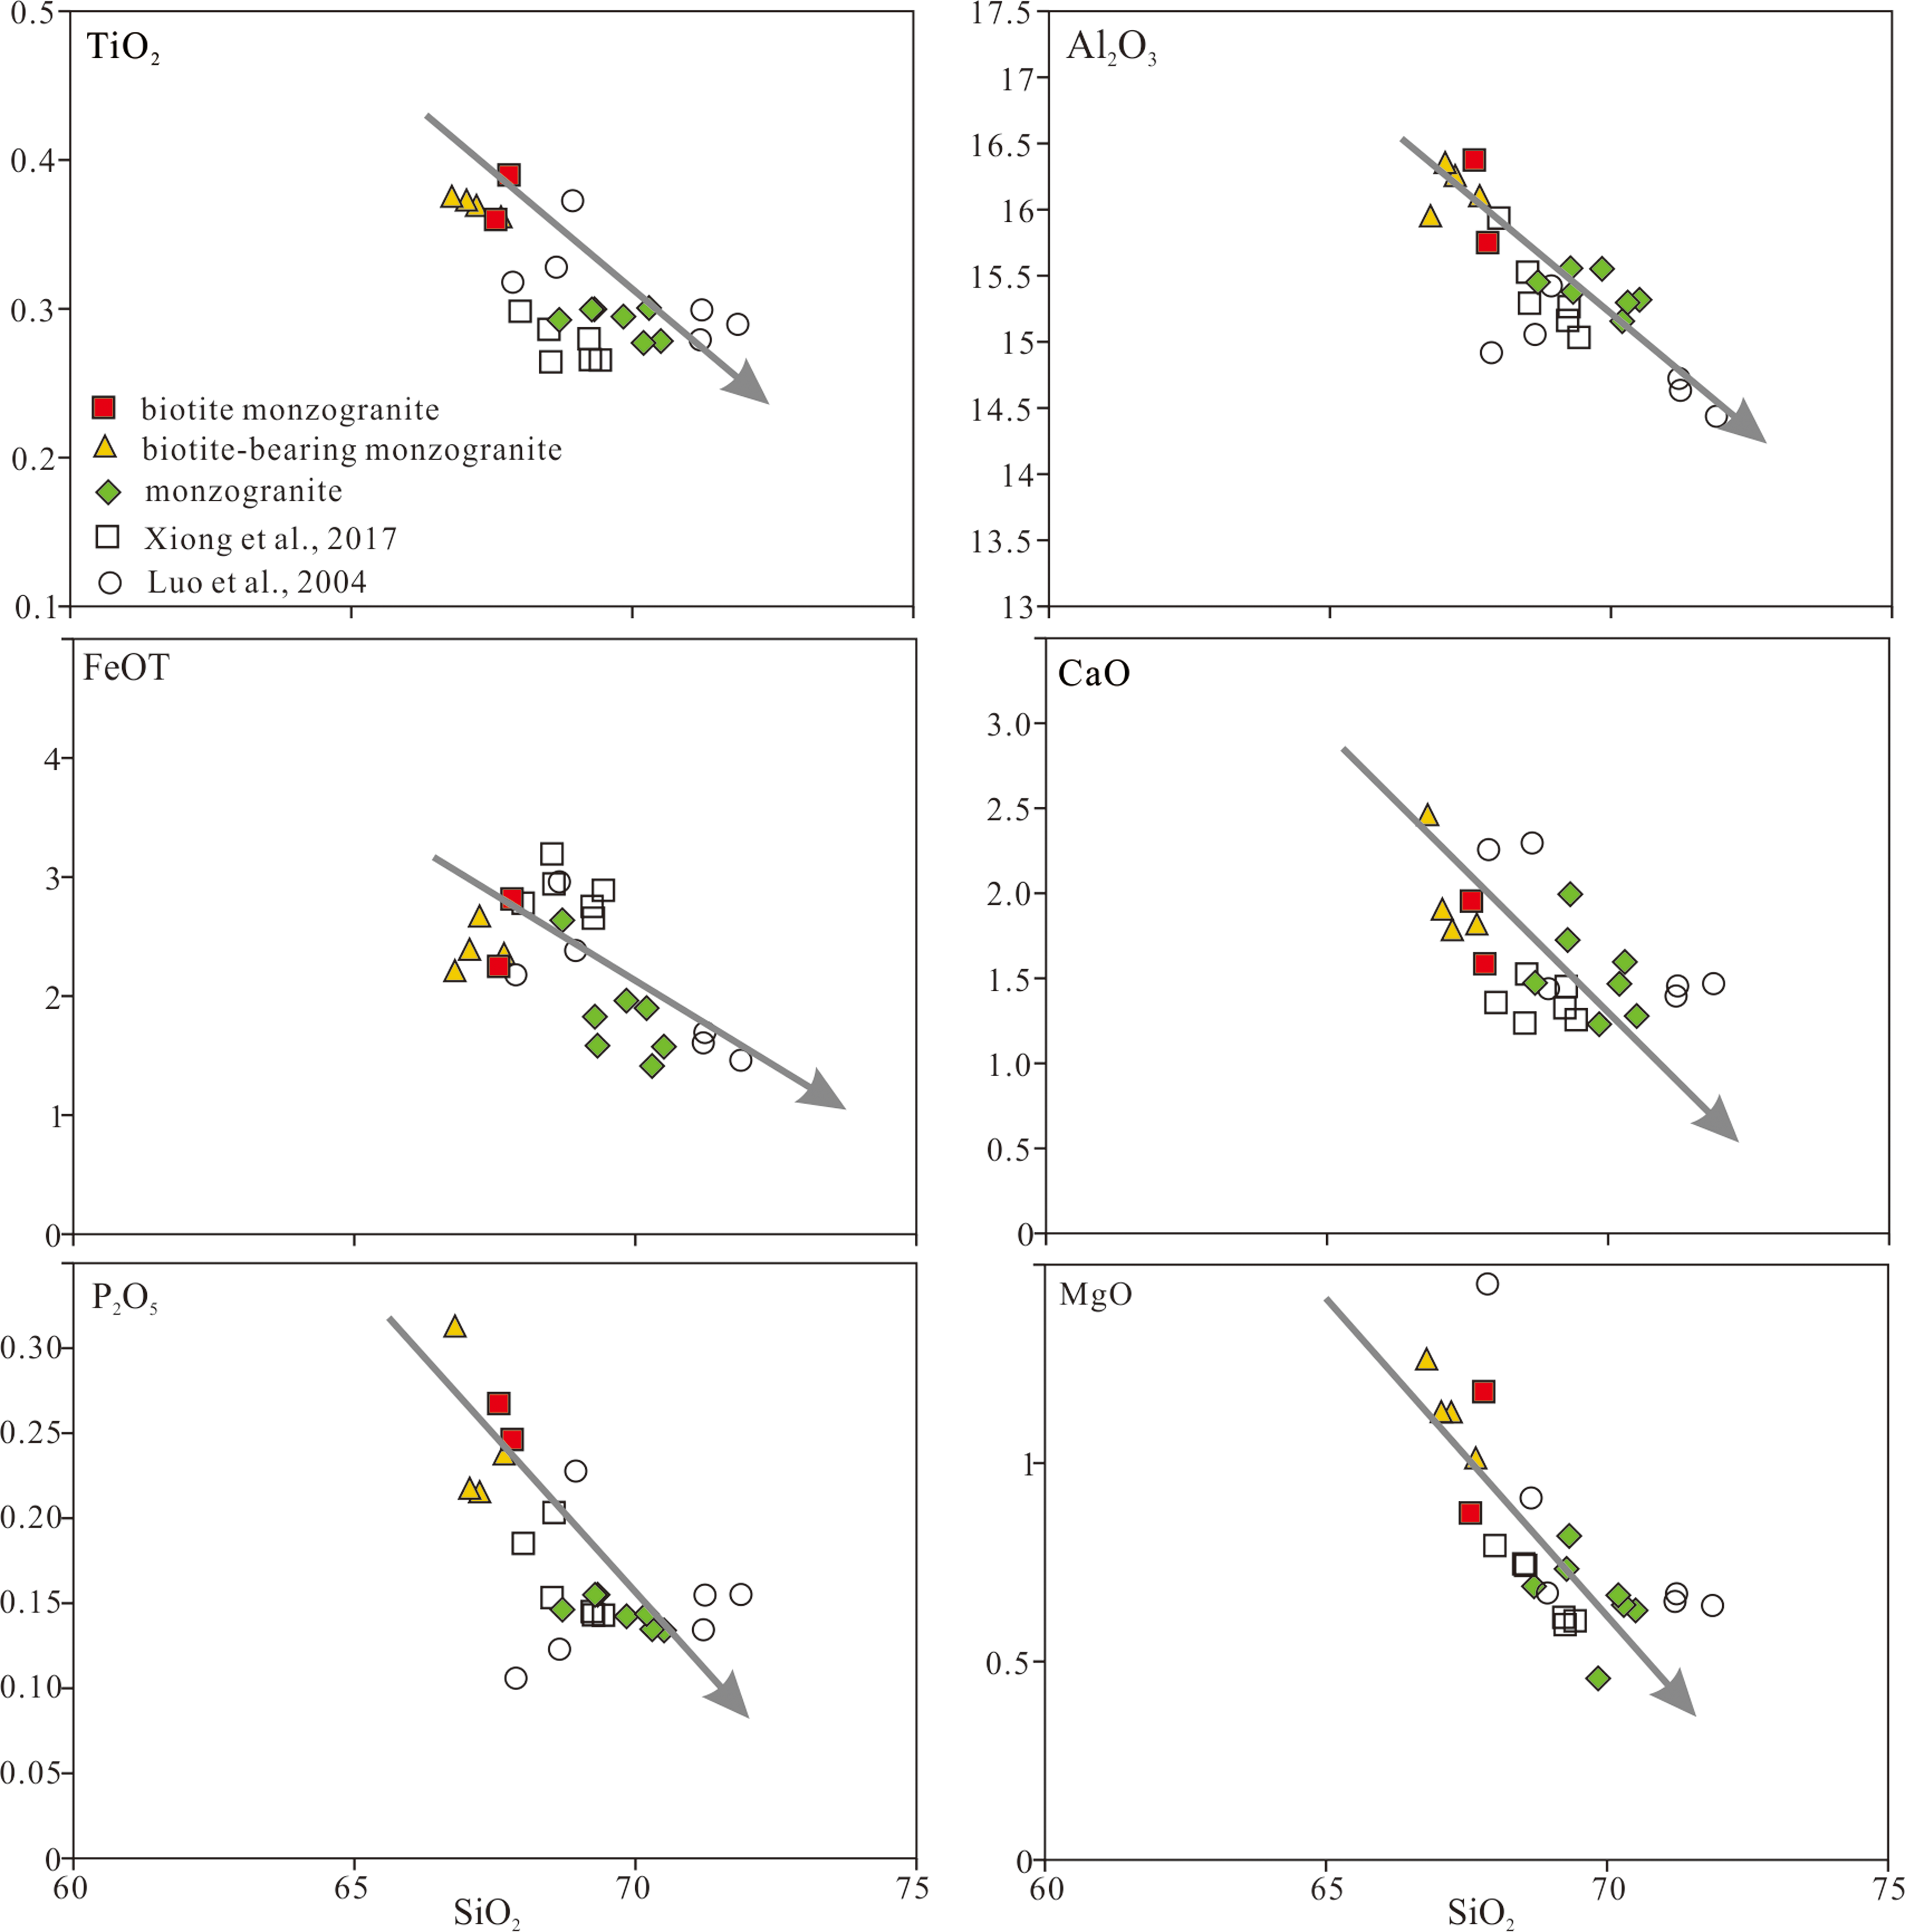
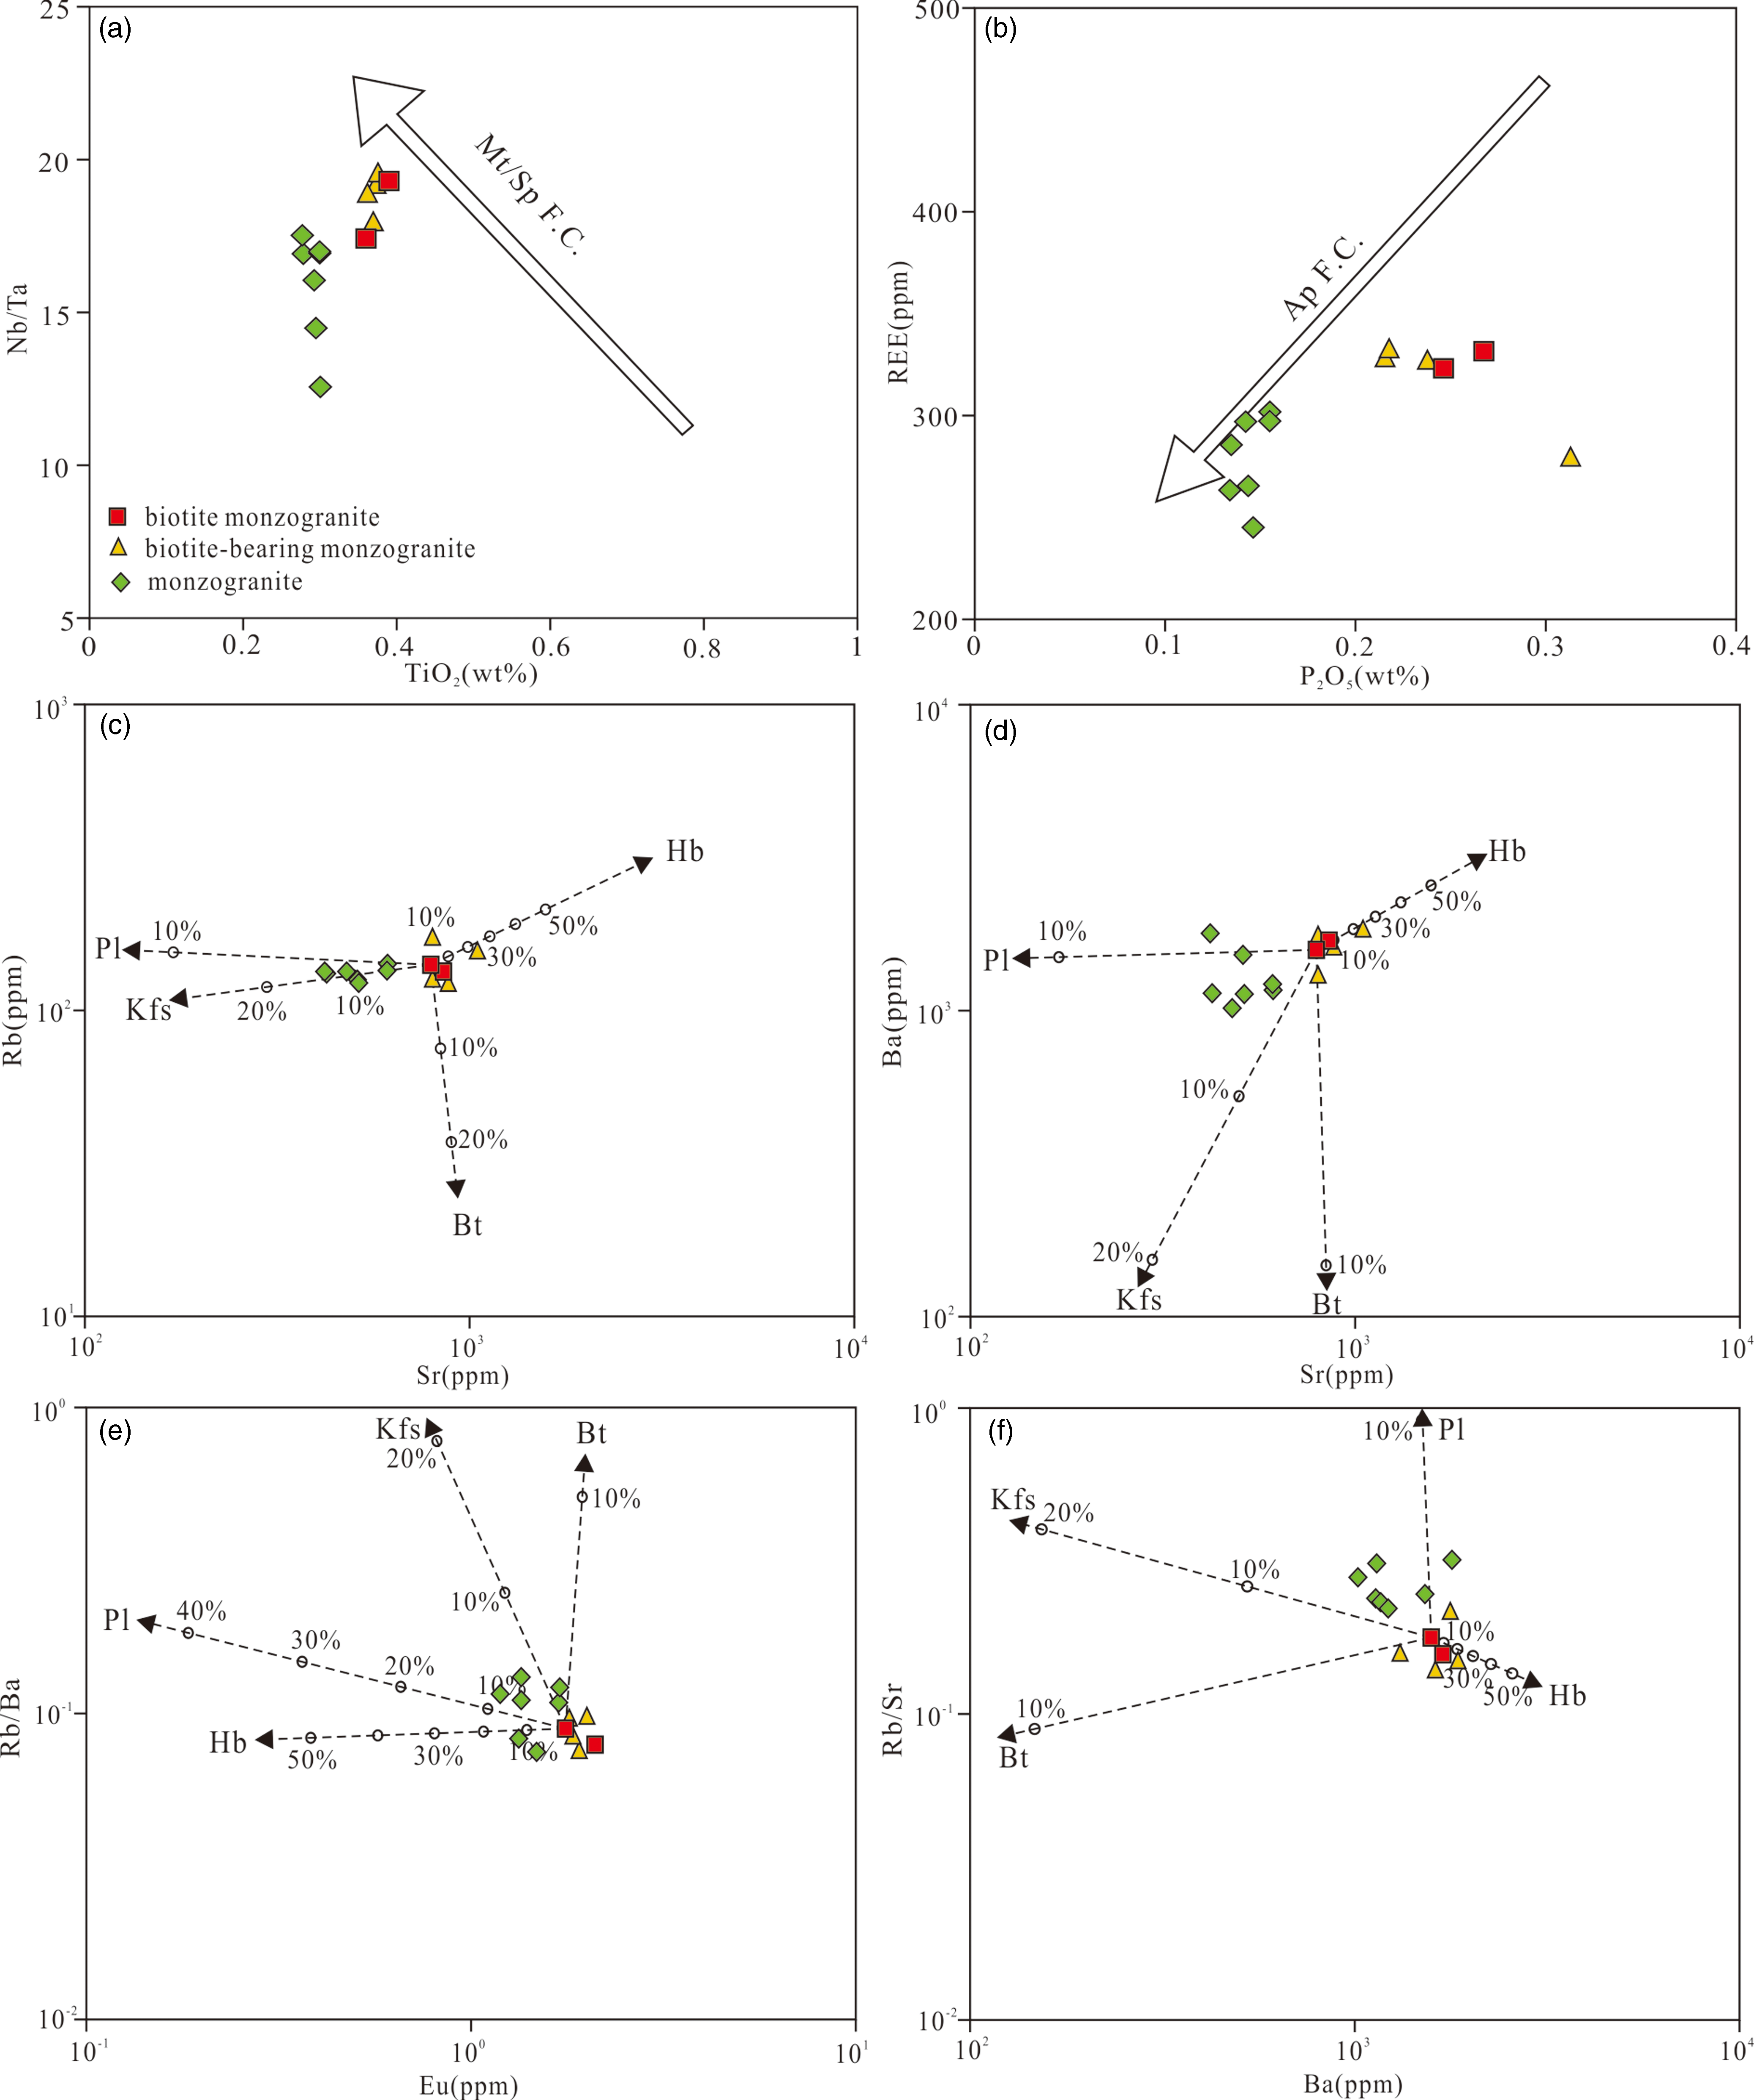
The contents of TiO2, Al2O3, FeO, CaO, P2O5 and MgO (Fig. 9a–f) decrease with increasing SiO2 from the biotite monzogranite to the monzogranite, attributed to the separation of some minerals. As previously mentioned, the biotite monzogranite is composed of plagioclase, K- feldspar, quartz, biotite, minor zircon, apatite and magnetite. Among them, biotite in these rocks has high FeO, MgO, Al2O3 and TiO2 (Table S6). Significant fractionation of biotite can cause the variation as observed in Fig. 9. The relatively stable concentration of TiO2 with decreasing Nb/Ta ratios (Fig. 10a) precludes any major role of magnetite, as the separation of magnetite would lead to a negative correlation between Ti and Nb/Ta (Green & Pearson, Reference Green and Pearson1987; Wang et al. Reference Wang, Zeng, Chen, Cai, Yan, Hou and Wang2017). Apatite fractionation was weak during the magmatic evolution, because the P2O5 content shows only slight decrease from the biotite monzogranite (average 0.25%) to the monzogranite (average 0.14%). The P2O5 also shows decrease with respect to the REE (Fig. 10b). Plagioclase is a major mineral in the monzogranite and has high Al2O3, CaO and Na2O (Table S4). The obvious separation of plagioclase, supported by lower Sr, Eu/Eu* for the monzogranite, the weak decrease in Rb concentrations and decrease of Ba concentrations with decreasing Sr concentrations (Fig. 10c, d), the increasing Rb/Ba and Rb/Sr ratios with decreasing Eu and Ba concentrations (Fig. 10e, f), are also typical. It has been known that fractional crystallization of plagioclase could result in decreasing of Sr of the residual magma, while the declining Ba is due to the separation of K- feldspar, attributed to the high partition coefficient of Sr for plagioclase and Ba for K- feldspar. The lower Ba (average 1284 ppm) and Sr (average 510 ppm) concentrations for the monzogranite than the biotite monzogranite (average 1637 ppm and 824 ppm, respectively) also indicate fractional crystallization of plagioclase and K- feldspar. Collectively, the BZGs are the products of magmatic evolution, and fractional crystallization of biotite, plagioclase, K- feldspar and apatite is the major magmatic process.
Variation of ω(SiO2) % vs. ω(TiO2) %, ω(Al2O3) %, ω(FeOT) %, ω(CaO) %, ω(P2O5) %, ω(MgO) %.
Diagrams of (a) TiO2 (wt%) versus Nb/Ta ratios, (b) P2O5 (wt%) versus REE (ppm) (after Wang et al. Reference Wang, Zeng, Chen, Cai, Yan, Hou and Wang2017), (c) Sr (ppm) versus Rb (ppm), (d) Sr (ppm) versus Ba (ppm), (e) Eu (ppm) versus Rb/Ba ratios and (F) Ba (ppm) versus Rb/Sr ratios, showing the fractional crystallization of different minerals. See Supplementary Table S7 for the partition of those minerals. Symbols are: Mt = magnetite; Sp = spinel; Hb = hornblende; Pl = plagioclase; Kf = K- feldspar; BI = biotite; Ap = apatite.
5.b. Petrogenetic model
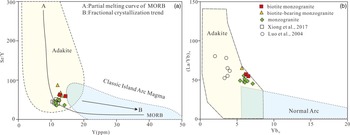
The BZGs have high SiO2(≥56 %), Al2O3 (≥14.5%) and Sr(>400 ppm), low Y(<18 ppm) and Yb (<1.9 ppm), corresponding with the high Sr/Y (>35) and La/Yb (>60) features of characteristics of adakites (Defant & Drummond, Reference Defant and Drummond1990; Sajona et al. Reference Sajona, Maury, Bellon, Cotten, Defant, Pubellier and Rangin1993). Also, they plot in the adakite area in the Sr/Y-Y and (La/Yb)N-YbN diagram (Fig. 11). Both of them indicate that our studied rocks have the properties of adakite. Various models have been proposed for the genesis of adakites including: (1) partial melting of a subducting slab (e.g. Kay, Reference Kay1978; Saunders et al. Reference Saunders, Rogers, Marriner, Terrell and Verma1987); (2) partial melting of the thickened lower crust (e.g. Yang et al. Reference Yang, Chang, Hou and Meffre2016; Xu et al. Reference Xu, Gu, Wang, Zhang, He, Zhou and Liu2018); (3) mixing of mantle-derived and crust-derived magma (e.g. Xu et al. Reference Xu, Ma and Zhang2012; Zhang et al. Reference Zhang, Ma, Holtz, Koepke, Wolff and Berndt2013); and (4) fractional crystallization and assimilation (AFC) of mantle-derived basaltic magma (e.g. Chiaradia et al. Reference Chiaradia, Fontboté and Beate2004; Macpherson et al. Reference Macpherson, Dreher and Thirwall2006; Foley et al. Reference Foley, Pearson, Rushmer, Turner and Adam2013; Dai et al. Reference Dai, Zheng, Zhou and Griffin2017; Azizi et al. Reference Azizi, Stern, Topuz, Asahara and Moghadam2019; Temizel et al. Reference Temizel, Arslan, Yücel, Yazar, Kaygusuz and Aslan2020; Wang et al. Reference Wang, Wang, Bi, Tao and Lan2020).
(a) Variation of Sr/Y vs. Y. Fields for adakites and island arcs are from Defant and Drummond (Reference Defant and Drummond1990). (b)Variation of (La/Yb)N vs. YbN. Data are normalized (N) to C1 (chondrite) values of Sun & McDonough (1989). Fields for adakites and island arc magma are from Martin (Reference Martin1999).
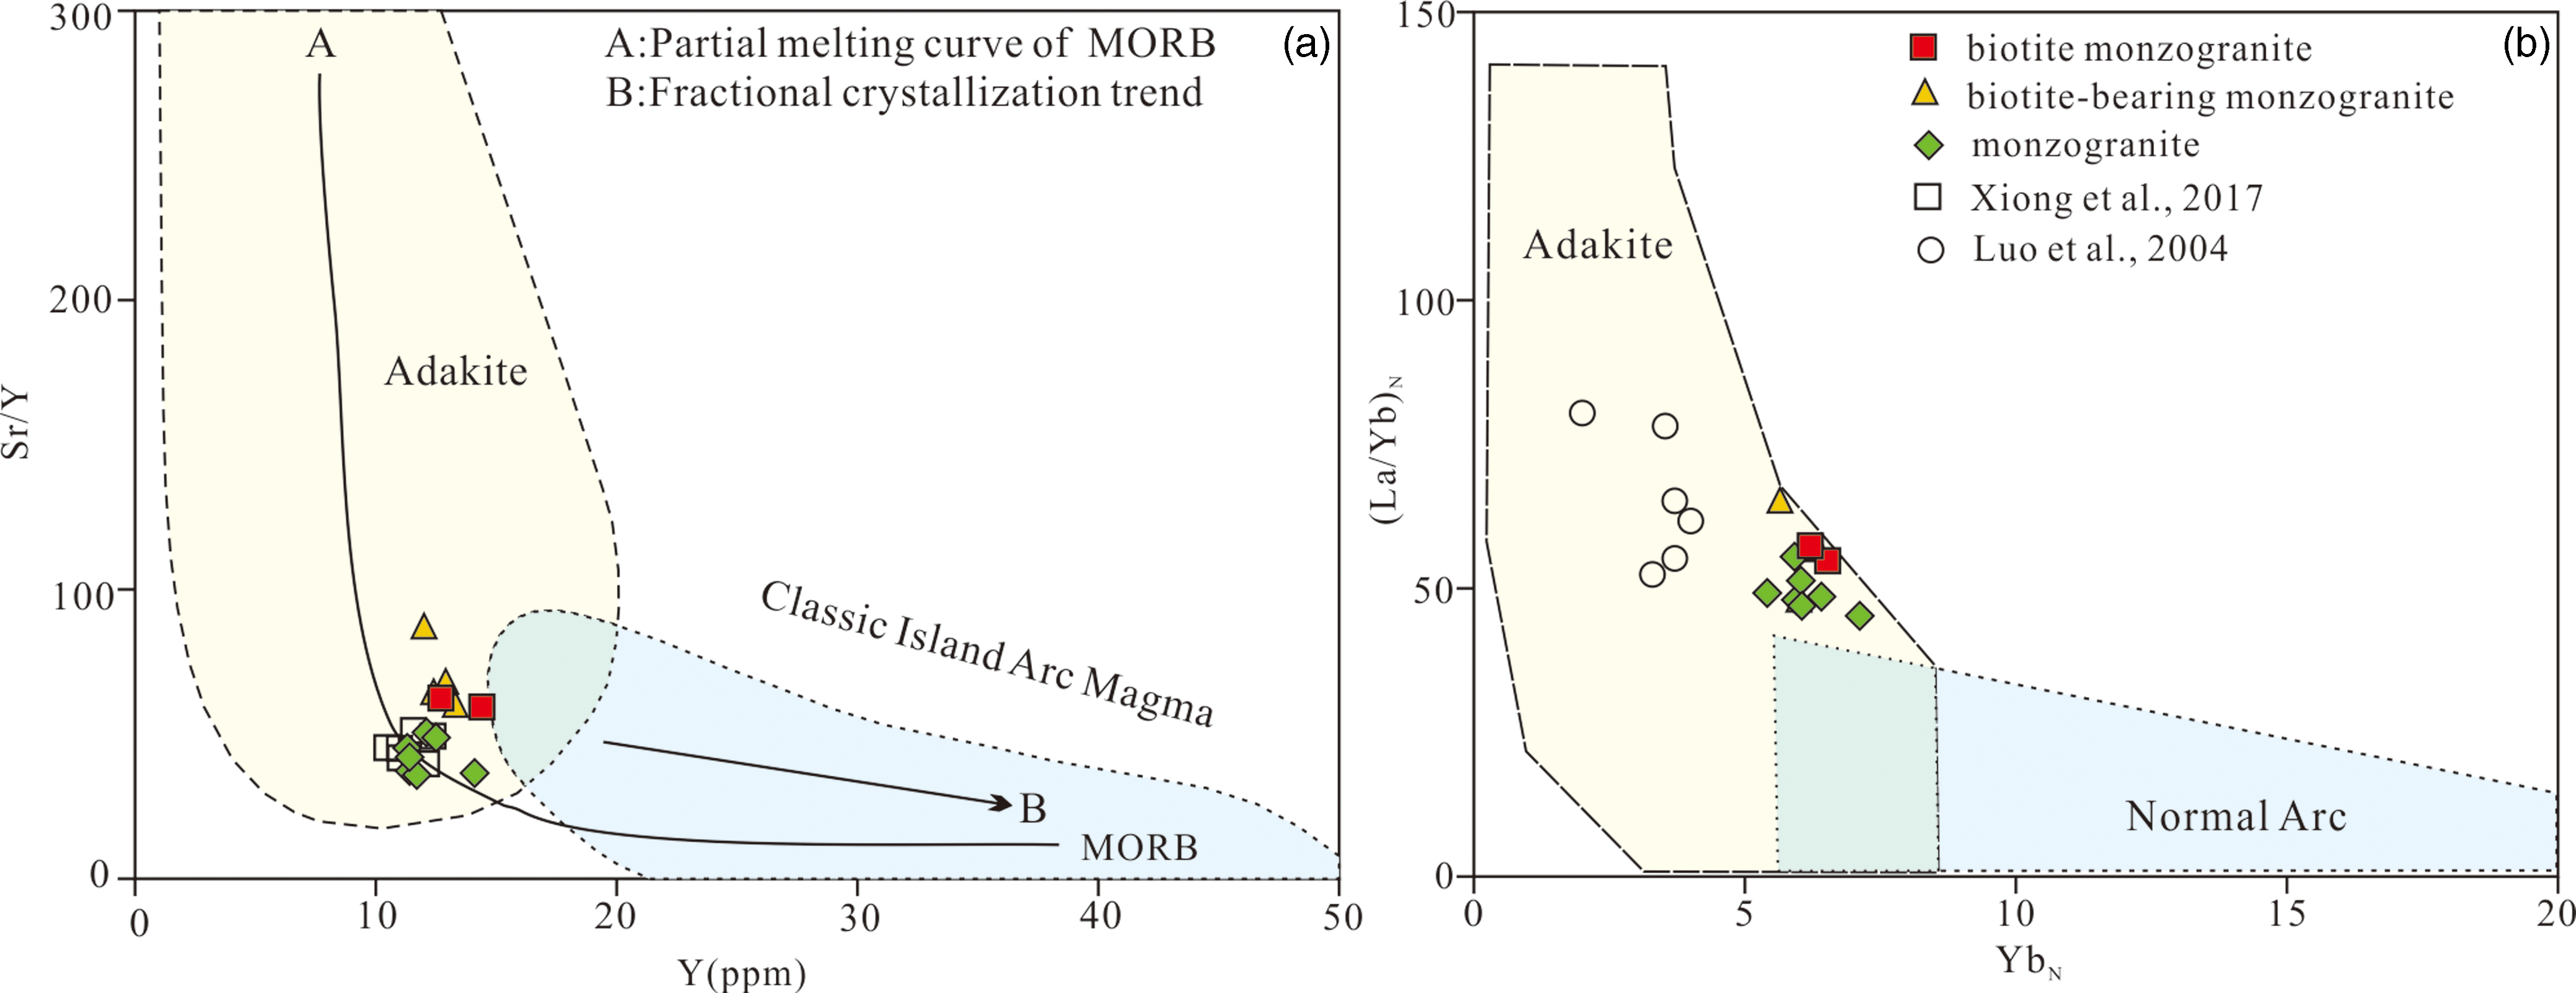
In general, adakites formed by partial melting of the subducted slab are characterized by high Na2O and low K2O contents (Na2O >3.5%, K2O/Na2O≈0.4) (Richards & Kerrich, Reference Richards and Kerrich2007), which is not consistent with our samples because K2O/Na2O ratios range from 1.12 to 1.13 (average 1.12), 0.99 to 1.53 (average 1.18) and 0.90 to 1.57 (average 1.12), respectively. As a consequence, partial melting of subducted slab is unlikely. Second, there is no evidence for the required regional crustal uplift in response to the delamination of a thickened lower crust (Li et al. Reference Li, Li, Li, Wang and Gao2013). Furthermore, the BZGs are massive and homogeneous, and no direct evidence has been found in the field for magma mixing, such as the presence of mafic enclaves. The limited Sr-Nd isotopic composition variation with (87Sr/86Sr(t) ranging from 0.70445 to 0.70524, and ϵNd(t) from −7.3 to −1.7) (Xiong et al. Reference Xiong, Shi, Li, Tian, Chen, Zhou, Zhao and Li2017), and the lack of any correlation between Sr-Nd and SiO2 also precludes the magma mixing model (Li et al. Reference Li, Li, Li, Wang and Gao2013).
In summary, we infer that the adakitic BZGs were products of fractional crystallization and assimilation (AFC) of mantle-derived basaltic magma.
5.c. Magmatic physiochemical conditions
5.c.1. Temperature
The distribution of some trace elements in minerals is a function of temperature and is used as a geological thermometer (Albuquerque, Reference Albuquerque1973). Henry et al. (Reference Henry, Guidotti and Thomson2005) proposed the thermometers for titanium content in biotite: T = {[ln (Ti)-a-c (X Mg)3]/b}0.333. The procedure follows T = temperature (°C); Ti = the number of Ti cations in biotite based on 22 oxygen atoms, calculated using the Luhr method (Luhr et al. Reference Luhr, Carmichael and Varekamp1984); X Mg = Mg/ (Mg+Fe); a = −2.3594, b = 4.6484×10⁻⁹, c = −1.7283. The calculation results are listed in Supplementary Table S8, indicating that the crystallization temperature of the biotite ranges from 700 °C to 744 °C (average 723 °C). Besides, zircon crystallization temperatures of biotite-bearing monzogranite and monzogranite were estimated using the equations of Waston et al. (Reference Watson, Wark and Thomas2006): [log10Ti in zircon (ppm)] = (6.01 ± 0.03)–(5080 ± 30)/T(K), listed in Table S2. The biotite-bearing monzogranite shows zircon temperature in the range of 679–732°C (n = 15, average 705°C). The zircon temperatures of monzogranite are relatively concentrated (except for the -30-7-6 of 783 °C), ranging from 693 to727°C (n = 14, average 709 °C), suggesting that they have similar high crystallization temperature. Both estimates are consistent with the features shown by the biotite, indicating that the BZGs were formed at a temperature of ca. 700°C.
5.c.2. Pressure
The Al content of biotite is positively correlated with the pressure of granitoids according to Uchida et al. (Reference Uchida, Endo and Makino2007). They proposed the empirical formula: P(kb) = 3.03×T Al−6.53 (±0.33) (T Al = the number of Al cations in biotite based on 22 oxygen atoms, calculated using the Luhr method) (Luhr et al. Reference Luhr, Carmichael and Varekamp1984). The results show that the BZG emplacement pressure is between 0.71 kbar and 1.60 kbar (average 0.97 kbar), corresponding to paleodepths of 2.7 to 6.0 km under lithostatic pressure.
5.c.3. Oxygen fugacity
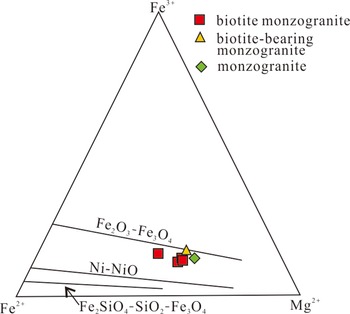
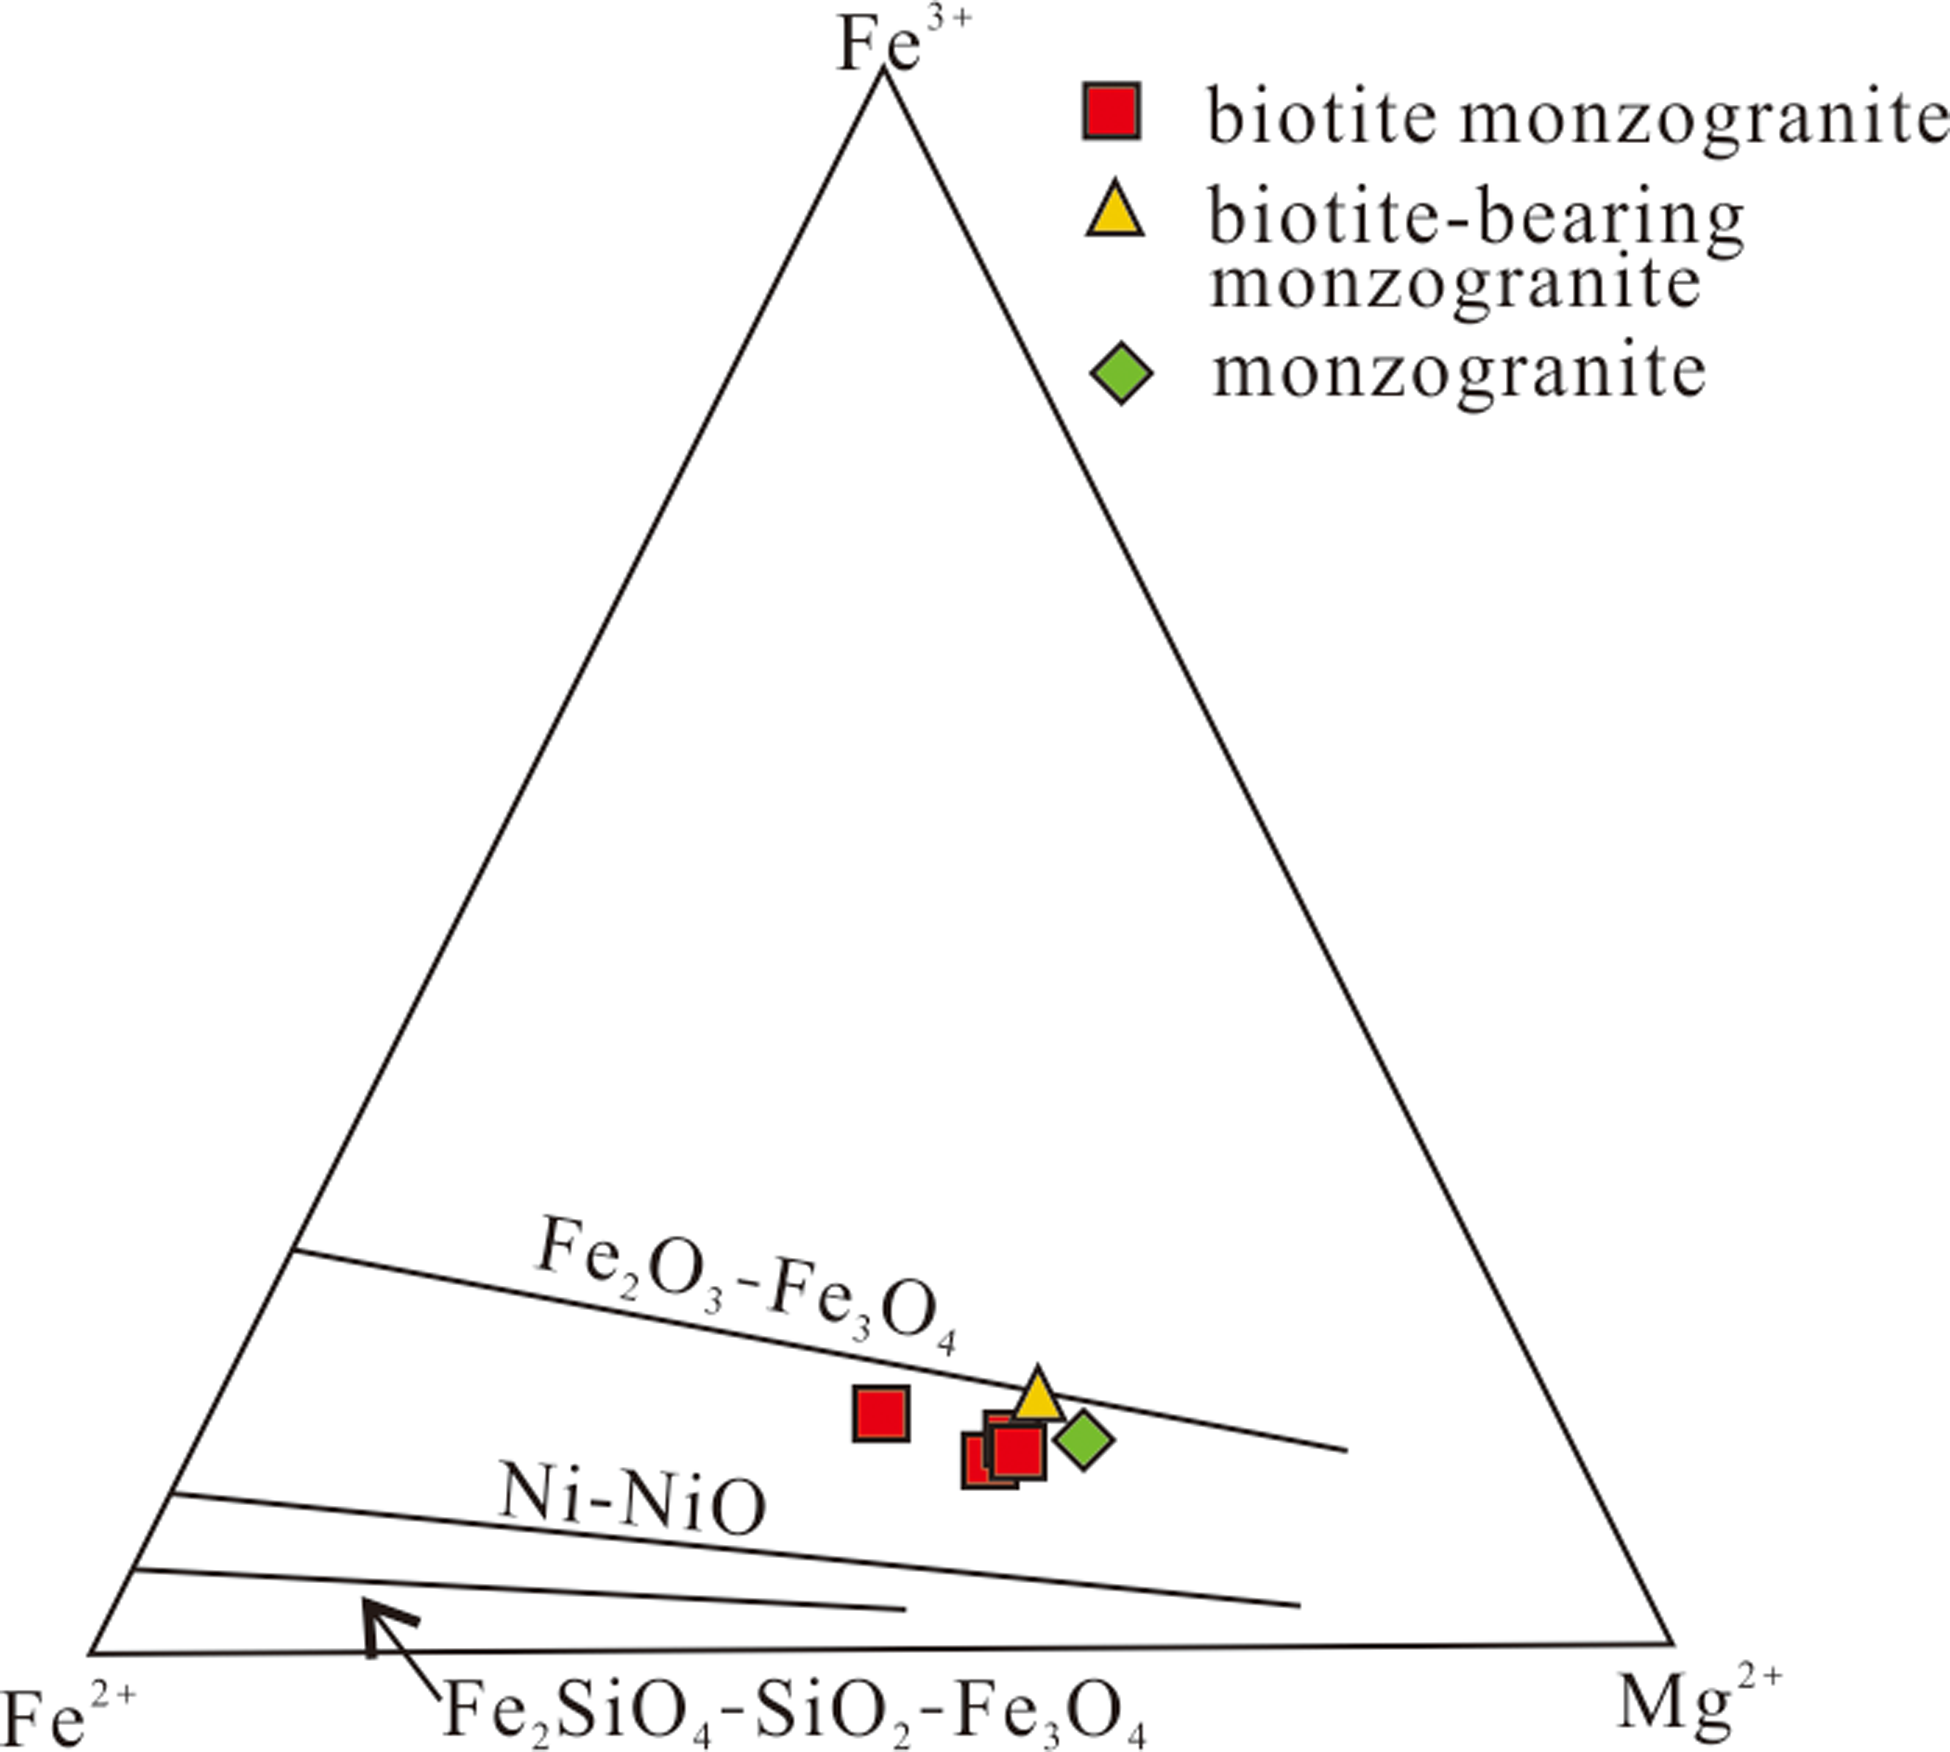
The concentration of Fe3+, Fe2+, Mg2+ in biotite can be used to estimate fO2 (e.g. Dymek, Reference Dymek1983; Wones, Reference Wones1989). The Fe2+-Fe3+-Mg2+ ternary diagram (Fig. 12) shows that the biotite from BZGs plot in the compositional fields between the Ni-NiO and Fe2O3-Fe3O4 buffer, and closer to Fe2O3-Fe3O4 line, indicating a high fO2 in the environment of biotite crystallization from the BZGs parent magma. Moreover, zircon fO2 was calculated using the Ti in zircon of Geo- fO2 software (Li et al. Reference Li, Cheng and Yang2019), listed in Table S2. LogfO2, △FMQ, and △NNO for the biotite-bearing monzogranite vary from −22.39 to −13.44 (average of −17.02), −6.31 to +1.30 (average of −1.67), and −6.88 to +0.74 (average of −2.22), respectively. The monzogranite shows higher values of logfO2, △FMQ and △NNO, ranging from −19.76 to −11.71 (average of −15.14), −4.93 to +3.67 (average of −0.03) and −5.48 to +3.11 (average of −0.58), respectively. These data suggest that the magma may have evolved to a more oxidized state from the biotite-bearing monzogranite to monzogranite.
Fe2+-Fe3+-Mg2+ ternary diagram (after Wones, Reference Wones1989) of the biotite from the BZGs.
5.d. Potential link between magmatism and mineralization
5.d.1. Conductive factors
Fractional crystallization is considered to be a critical component for mineralization (e.g. Blevin, Reference Blevin2004; Chiaradia et al. Reference Chiaradia, Ulianov, Kouzmanov and Beate2012; Hronsky et al. Reference Hronsky, Groves, Loucks and Begg2012). As discussed in previous sections, fractional crystallization played a dominant role during magma differentiation of the BZGs.
Besides, other three parameters have been proposed to evaluate the magmatic-hydrothermal associated with gold-bearing granitoids by Blevin (Reference Blevin2004): (1) redox state; (2) compositions, for example, K2O and alkalinity; (3) degree of magma evolution.
On the redox state classification diagram of Fe2+-Fe3+-Mg2+ (Fig. 12), the studied rocks are closer to Fe2O3-Fe3O4, indicating that they belong to the magnetite series. The magnetite-bearing granitoids are generally related to Au, Cu and Mo deposits (Ishihara, Reference Ishihara1977). Furthermore, the BZGs have a high fO2, as evidenced by EPMA data of biotite and trace element characteristics of zircon, which are favourable for gold mineralization (Park et al. Reference Park, Campbell, Kim and Moon2015; Xu et al. Reference Xu, Cao, Du, Wang and Pang2021).
The BZGs are alkali-rich, with Na2O + K2O values ranging from 9.77 to 9.99% (average 9.88%), 9.93 to 10.16% (average 10.07%), 9.87 to 10.25% (average 10.07%), respectively. On the (Na2O+K2O −CaO) versus SiO2 diagram, they all plot as alkaline series (Fig. 5c). On the other hand, potassium alteration is also observed (Fig. 2h), which is a significant feature of gold deposits related to alkaline magmatism (Jensen & Barton, Reference Jensen and Barton2000), and is favourable for the transport of gold (N’dri et al. Reference N’dri, Zhang, Zhang, Tamehe, Kouamelan, Wu, Assie, Koua, Kouamelan and Zhang2021).
The Rb/Sr and K/Rb ratios are two useful parameters to evaluate the degree of compositional evolution. The Rb/Sr ratio of the studied rocks is low (0.16–0.18, 0.14–0.22 and 0.22–0.32, respectively), indicating that these rocks are less evolved (Blevin, Reference Blevin2004). Previously studied Au-Cu deposits are related to low differentiation granites (Thompson et al. Reference Thompson, Sillitoe, Baker, Lang and Mortensen1999; Blevin et al. Reference Blevin, Chappell and Jones2003). In addition, granites associated with Cu and Cu-Au deposits have a K/Rb ratio >200 (Blevin, Reference Blevin2004). The K/Rb ratio is all greater than 200 of the BZGs, ranging from 296 to 318 (average 307), 275 to 326 (average 301) and 306 to 350 (average 324), respectively. The above features suggest that the BZGs are less evolved and conducive to gold mineralization according to Blevin (Reference Blevin2004).
5.d.2. Timing of magmatism and gold mineralization
The northern margin of the NCC is an important gold mineralization belt, and there are multiple magmatic events associated with numerous gold mineralization (e.g. N’dri et al. Reference N’dri, Zhang, Zhang, Tamehe, Kouamelan, Wu, Assie, Koua, Kouamelan and Zhang2021). These gold ores are hosted by both Precambrian metamorphic rocks and Variscan, Indosinian and Yanshanian granites (Zhou et al. Reference Zhou, Goldfarb and Phillips2002). Many gold deposits, related to the Mesozoic intrusive rocks, are distributed in the eastern Hebei – western Liaoning area in the northern margin of the NCC (Kong et al. Reference Kong, Xu, Yin, Chen, Li, Guo, Yang and Shao2015). These deposits have almost the same mineralization age as that of magmatism (Chen et al. Reference Chen, Ye, Wang, He, Zhang and Wang2019; Zhang et al. Reference Zhang, Zhang, Danyushevsky, Wu, Alexis, Liao and Zhang2020), such as Yuerya and Jinchangyu (Wang et al. Reference Wang, Wang, Bi, Tao and Lan2020).
In this study, the zircon U-Pb dates of 231.7 ± 3.6 Ma (biotite-bearing monzogranite sample 0–8) and 231.7 ± 3.3 Ma (monzogranite sample -30-7) have been obtained from the BZGs. They are very similar to those reported previously, where LA-ICP-MS zircon U-Pb ages show 233 ± 3 Ma (Xiong et al. Reference Xiong, Shi, Li, Tian, Chen, Zhou, Zhao and Li2017) and SHRIMP zircon U-Pb ages yielded 222 ± 3 Ma (Luo et al. Reference Luo, Li, Guan, Qiu, Qiu, McNaughton and Groves2004). All these data indicate that the time of magmatism is Late Triassic. We therefore speculate that the Baizhangzi gold deposit, one of the typical IRGDs, was also formed in the Late Triassic. It was also demonstrated by a number of investigated gold deposits hosted by igneous rocks, including Bilihe (Yang et al. Reference Yang, Chang, Hou and Meffre2016), Daxiyingzi (Liu et al. Reference Liu, Zhao and Liu2021), Julia (Soloviev et al. Reference Soloviev, Kryazhev, Semenova, Kalinin, Dvurechenskaya and Sidorova2022) and Xiajinbao (Wang et al. Reference Wang, Wang, Bi, Tao and Lan2020).
In summary, the BZGs experienced fractional crystallization, together with high fO2, alkali-rich, K-metasomatism and low evolution degree, which are conductive for gold mineralization. Furthermore, the monzogranite probably has high metallogenic potential due to its more oxidized state. We expect that this investigation will provide an important guide for regional gold exploration in the area.
6. Conclusions
-
(1) Zircon U−Pb dating shows that the biotite-bearing monzogranite and monzogranite were formed at 231.7 ± 3.6 Ma and 231.7 ± 3.3 Ma, respectively. The dating, supporting previous geochronology, represents the age of magmatism and gold mineralization in the area.
-
(2) Bulk and mineral geochemistry data indicate that the BZGs are cogenetic and fractional crystallization is the dominant magmatic process.
-
(3) Crystallization temperature is ca. 700°C, and pressure is between 0.71 kb and 1.60 kb of the BZGs. Zircon trace elements suggest that the magma may have evolved to a more oxidized state.
-
(4) The fractional crystallization, together with high fO2, K-metasomatism and low evolution degree, are considered favourable conditions for gold mineralization.
Supplementary material
The supplementary material for this article can be found at https://doi.org/10.1017/S0016756823000341
Acknowledgements
This research was financially supported by the Natural Science Foundation of China (grant No. 92062217 and 42121002). We thank Xiaohong Mao of the Institute of Geology, Chinese Academy of Geological Science for the assistance in geochemical and isotope analysis.
Competing interests
The authors declare that all authors have contributed to this manuscript, and they have no known competing financial interests or personal relationships that could have appeared to influence the work reported in this paper.