





Introduction
Helminth communities in predatory birds are shaped by two linked filters: host identity and the trophic routes that connect hosts to intermediate or paratenic hosts (Santoro et al., Reference Santoro, Mattiucci, Nascetti, Kinsella, Di Prisco, Troisi, D`alessio, Veneziano and Aznar2012a; Sitko and Heneberg, Reference Sitko and Heneberg2019). Closely related and co-occurring owl species differ markedly in terms of prey spectra and hunting habitats, resulting in predictable differences in exposure to specific helminths. As predators occupying distinct feeding niches, ranging from largely terrestrial small-mammal specialists to opportunistic feeders that frequently exploit amphibians, reptiles, birds and large insects, owls link multiple prey pathways that can sustain helminth life cycles (Galeotti, Reference Galeotti2001; Ferrer et al., Reference Ferrer, Molina, Castellà and Kinsella2004). Nevertheless, most previous studies of owl helminths have been cross-sectional, and long-term information on the population trends of owl helminths remains scarce despite its relevance for understanding how changing prey bases and landscapes affect trophically transmitted parasites.
In southern Italy, owl helminth communities were structured by both biological and ecological differences among hosts, and owls shared a pool of owl generalist taxa while still showing quantitative divergence linked to diet (Santoro et al., Reference Santoro, Mattiucci, Nascetti, Kinsella, Di Prisco, Troisi, D`alessio, Veneziano and Aznar2012a). Other studies also reported strong among-host contrasts in which taxa are common, even when hosts were sampled from the same geographic region and when similar carcass-based workflows are used (Borgsteede et al., Reference Borgsteede, Okulewicz, Zoun and Okulewicz2003; Ferrer et al., Reference Ferrer, Molina, Castellà and Kinsella2004). Some of these host–parasite associations recur across studies and therefore serve as clear candidates for hypothesis-driven tests of host specificity and transmission routes. For example, Centrorhynchus aluconis has been reported as the most prevalent helminth in tawny owls (Strix aluco) and is typically among the most abundant taxa, often interpreted as reflecting exposure via terrestrial prey pathways that include shrews (Ewald and Crompton, Reference Ewald and Crompton1993). Comparable datasets from other owl hosts show that Strigea strigis, Porrocaecum spirale and nematodes can dominate in some hosts but remain rare in others, resulting in host structuring at both presence and intensity levels (Borgsteede et al., Reference Borgsteede, Okulewicz, Zoun and Okulewicz2003; Ferrer et al., Reference Ferrer, Molina, Castellà and Kinsella2004).
Recent decades have been characterized by broad changes in prey availability and habitat use that can alter owl diets and, in turn, helminth transmission. If exposure pathways weaken, helminths that depend on them should decline. If exposure pathways persist or shift among prey types, the dominant taxa should change accordingly. Therefore, we tested the following hypotheses: H1: Helminth occurrence has decreased in recent decades, and this decline is expressed as negative temporal trends in (a) the probability that a host is infected, (b) total helminth abundance per host and (c) helminth taxon richness per host. H2: Temporal trends differ among owl species because of differences in dominant trophic exposure routes. H3: Dominant helminths show strong host specificity. H4: Temporal decline is taxon-specific and strongest in helminth taxa linked to prey pathways sensitive to ecological change. H5: Seasonal effects are detectable primarily at the level of individual helminth taxa and may differ among host species.
To test these hypotheses, we used a multidecadal dataset of owl helminths with strong representation of S. aluco and Asio otus, complemented by other owl hosts, to test whether (i) helminth communities remain stable through time or show directional change and (ii) the identity of dominant taxa differs systematically among host species in ways consistent with host-specific trophic exposure. The dataset also includes the sex and age of the host individuals, allowing us to evaluate whether demographic differences contribute to among-host variation after accounting for host identity and time. Because the underlying records represent long-term routine necropsies, the same settings enable both between-host comparisons and temporal inference using a single standardized response scale.
Materials and methods
Study material
The study was based on 645 owl individuals representing 10 host species: S. aluco (216 individuals), A. otus (287), Tyto alba (58), Bubo (38), Athene noctua (25), Strix uralensis (8), Asio flammeus (7), Otus scops (3), Glaucidium passerinum (2) and Aegolius funereus (1). The owls were collected between 1963 and 2026. For each examined individual, the available metadata included host identity, year of sampling, season and parasitological findings. The examined owls originated predominantly from Moravia and Czech Silesia, with most specimens coming from the rescue station in Bartošovice (n = 394), followed by the rescue station in Přerov (n = 66) and from Hodonín (n = 17), and additional material from numerous other localities across the eastern Czech Republic (see Table S1 for a detailed overview). Four samples, representing 0.62% of the total samples, originated from Slovakia. The examined dataset partially overlaps with that used by Sitko and Heneberg (Reference Sitko and Heneberg2019). The owls were examined in the years in which they were obtained. All dissections and parasite identifications were performed by the first author.
Each bird underwent a full helminthological necropsy. The subcutaneous tissues, body cavity, oesophagus, proventriculus and gizzard, intestines, cloaca, bursa of Fabricius, liver and gall bladder, spleen, lungs, trachea and bronchi, air sacs, kidneys and reproductive organs were examined under a stereomicroscope. Recovered trematodes were removed immediately and fixed in 70% ethanol. The obtained helminths were stained with borax carmine, dehydrated through a graded ethanol series, cleared in xylene and mounted in Canada balsam (Sitko and Heneberg, Reference Sitko and Heneberg2023).
Helminths were identified to the lowest possible taxonomic level using standard morphological keys and original taxonomic descriptions, supplemented by numerous recent revisions from taxonomic papers that are not listed individually due to their high volume. For trematodes, we used Skrjabin (1947–Reference Skrjabin1974), Yamaguti (Reference Yamaguti1958), Dubois (Reference Dubois1968, Reference Dubois1970), Sonin (Reference Sonin1985), Gibson et al. (Reference Gibson, Bray and Jones2002), Jones et al. (Reference Jones, Bray and Gibson2005) and Bray et al. (Reference Bray, Gibson and Jones2008). Cestodes were identified according to Yamaguti (Reference Yamaguti1959), Sonin (Reference Sonin1986) and Khalil et al. (Reference Khalil, Jones and Bray1994). For nematodes, Yamaguti (Reference Yamaguti1961), Sonin (Reference Sonin1986), Anderson et al. (Reference Anderson, Chabaud and Willmott2009) and Gibbons (Reference Gibbons2010) were used. Acanthocephalans were determined using Petrochenko (Reference Petrochenko1956, Reference Petrochenko1958), Yamaguti (Reference Yamaguti1963) and Schmidt (Reference Schmidt1985). Helminths were recorded as occurrence data and as counts of recovered individuals. Three standard epidemiological descriptors were used throughout. Prevalence was defined as the proportion of examined hosts infected with a given parasite taxon. The mean abundance was defined as the mean number of parasite individuals per examined host. The mean intensity of infection was defined as the mean number of helminth individuals per infected host only (Bush et al., Reference Bush, Lafferty, Lotz and Shostak1997). Because the sample sizes for several host species were small, the results for those species are presented descriptively.
Statistical analyses
Temporal patterns were summarized descriptively in the two most abundant host species, A. otus and S. aluco. Host species represented by small numbers of individuals were not used for graphical temporal summaries and were reported descriptively only. Annual observations were aggregated into the following calendar periods: 1963–1969, 1970–1979, 1980–1989, 1990–1999, 2000–2009, 2010–2019 and 2020–2026. For each host species and decade, pooled prevalence was calculated as the number of infected hosts divided by the number of examined hosts, and decade-level mean intensity was summarized for graphical presentation. Formal temporal inference was based on individual-host occurrence data fitted with generalized linear models with a binomial error structure. Each examined host was treated as a single data point. We fitted five taxon-specific temporal models, one for each parasite taxon meeting the inclusion threshold. In each model, host-level occurrence of the focal parasite taxon was used as the binary response variable, sampling year was included as the temporal predictor, and host species and season were included as additional explanatory variables. These models were fitted in the four principal helminth-positive host species, A. otus, S. aluco, B. bubo and A. noctua. Parasite taxa were included only if they were represented by at least 20 positive host records within this modelled host dataset. This threshold retained 5 taxa: S. strigis, C. aluconis, Baruscapillaria falconis, P. spirale and Cladotaenia globifera. Odds ratios per year and 95% confidence intervals were extracted from the fitted models.
Seasonal effects were evaluated using the same modelled host dataset and the same taxon inclusion threshold as the taxon-specific temporal analyses. Thus, the seasonal analysis was restricted to individual-host occurrence records from A. otus, S. aluco, B. bubo and A. noctua and to parasite taxa represented by at least 20 positive host records. The full available year range for these records was used, and the sampling year was retained in the models to account for long-term temporal change. For each of the 5 retained taxa, seasonal effects were evaluated by comparing additive models with and without season using likelihood ratio tests. Host-by-season interaction terms were examined only as exploratory checks within the same restricted modelled dataset. Because records were unevenly distributed among host species and seasons, these interaction tests were interpreted cautiously and were not used as primary evidence for the main temporal conclusions. Raw data are provided in Table S2.
All statistical analyses were performed in Python. The source tables were processed with pandas, numerical calculations were performed with NumPy and generalized linear models were fitted with the statsmodels package. Binomial models for parasite occurrence were fitted with a logit link. Odds ratios per year were calculated by exponentiating the estimated regression coefficient for sampling year, and 95% confidence intervals were obtained by exponentiating the corresponding confidence limits. Likelihood ratio tests for seasonal effects were calculated by comparing nested models with and without the relevant seasonal term, using SciPy to obtain P-values from the chi-square distribution.
Results
Overall patterns
In total, 262 out of the 645 examined individuals were infected with at least 1 helminth taxon, yielding an overall prevalence of 40.6% (Figure 1; Table 1; Table S3). Across all the hosts, 22 helminth taxa were recorded; the taxon richness was highest in S. aluco (15 taxa), followed by A. otus (10), B. bubo and S. uralensis (7 each), O. scops (6), A. noctua (4), A. flammeus (3) and A. funereus (1). No helminths were detected in T. alba or G. passerinum (Figure 2; Table S3). Descriptive summaries stratified by age and sex, and separately by locality, are provided in Table S1 and Table S4.
Host-level prevalence of helminth infection across owl species. Points show the prevalence of infection with any helminth; error bars show 95% Wilson confidence intervals; and point size is proportional to host sample size. The numeric labels indicate mean abundance, and the size legend shows cohort size for each host species.

Figure 1 Long description
The scatter plot illustrates the prevalence of helminth infection across various owl species. The horizontal axis lists different owl species: Strix aluco, Asio otus, Asio flammeus, Athene noctua, Bubo bubo, Aegolius funereus, Glaucidium passerinum, Strix uralensis, Otus scops and Tyto alba. The vertical axis represents the prevalence of any helminth infection, ranging from 0 to 100 percent. Each point on the plot corresponds to a species and indicates the prevalence of infection, with error bars showing the 95 percent Wilson confidence intervals. The size of each point is proportional to the cohort size, as indicated by the legend on the right, which categorizes cohort sizes into four groups: n equals 1, n equals 25, n equals 100 and n equals 300. Specific data points include Strix aluco with a prevalence of 51.9 percent and a cohort size of 216, Asio otus with 35.9 percent prevalence and a cohort size of 287 and Tyto alba with 0 percent prevalence and a cohort size of 58. Other species show varying prevalence and cohort sizes, with some species like Otus scops and Strix uralensis showing 100 percent prevalence but with smaller cohort sizes of 3 and 8, respectively.
Heatmap of helminth prevalence (%) across host species. Taxa are ordered by combined mean abundance in Strix aluco and Asio otus. Cells with zero prevalence are shown in grey. Taxonomic names were standardized across datasets.

Figure 2 Long description
Line graphs labeled A and B. A line graph with the horizontal axis labeled, Decade, with ticks 1960s, 1970s, 1980s, 1990s, 2000s, 2010s, 2020s. The vertical axis is labeled, Probability of any helminth infection, with a range from 0.0 to 1.0. A legend lists Asio otus and Strix aluco. Asio otus: (1960s, 0.30), (1970s, 0.55), (1980s, 0.42), (1990s, 0.40), (2000s, 0.45), (2010s, 0.35), (2020s, 0.15). Strix aluco: (1960s, 1.00), (1970s, 0.85), (1980s, 0.75), (1990s, 0.55), (2000s, 0.45), (2010s, 0.80), (2020s, 0.50). A line graph with the horizontal axis labeled, Decade, with ticks 1960s, 1970s, 1980s, 1990s, 2000s, 2010s, 2020s. The vertical axis is labeled, Mean infection intensity, with a range from 0 to 80. A legend lists Asio otus and Strix aluco. Asio otus: (1960s, 60), (1970s, 10), (1980s, 15), (1990s, 12), (2000s, 14), (2010s, 5), (2020s, 4). Strix aluco: (1960s, 5), (1970s, 20), (1980s, 30), (1990s, 5), (2000s, 5), (2010s, 6), (2020s, 7).
Host-level helminth infection summary

Table 1 Long description
Host species are listed with sample size, prevalence in percent, mean abundance plus or minus standard error, mean intensity plus or minus standard error, mean richness plus or minus standard error, and species observed. Asio otus has n 287, prevalence 35.9, mean abundance 5.5 plus or minus 1.2, mean intensity 15.5 plus or minus 3.1, mean richness 0.5 plus or minus 0.0, and species observed 10. Strix aluco has n 216, prevalence 51.9, mean abundance 4.5 plus or minus 1.0, mean intensity 8.7 plus or minus 1.9, mean richness 0.8 plus or minus 0.1, and species observed 15. Tyto alba has n 58, prevalence 0.0, mean abundance 0.0 plus or minus 0.0, mean intensity is not reported, mean richness 0.0 plus or minus 0.0, and species observed 0. Bubo bubo has n 38, prevalence 57.9, mean abundance 6.3 plus or minus 2.5, mean intensity 10.8 plus or minus 4.1, mean richness 0.9 plus or minus 0.2, and species observed 7. Athene noctua has n 25, prevalence 40.0, mean abundance 10.3 plus or minus 5.7, mean intensity 25.8 plus or minus 13.1, mean richness 0.4 plus or minus 0.1, and species observed 4. Strix uralensis has n 8, prevalence 100.0, mean abundance 21.0 plus or minus 8.2, mean intensity 21.0 plus or minus 8.2, mean richness 1.8 plus or minus 0.3, and species observed 7. Asio flammeus has n 7, prevalence 42.9, mean abundance 2.3 plus or minus 2.0, mean intensity 5.3 plus or minus 4.3, mean richness 0.4 plus or minus 0.2, and species observed 3. Otus scops has n 3, prevalence 100.0, mean abundance 74.0 plus or minus 45.9, mean intensity 74.0 plus or minus 45.9, mean richness 2.7 plus or minus 0.7, and species observed 6. Glaucidium passerinum has n 2, prevalence 0.0, mean abundance 0.0, mean intensity is not reported, mean richness 0.00, and species observed 0. Aegolius funereus has n 1, prevalence 100.0, mean abundance 1.0, mean intensity 1.0, mean richness 1.00, and species observed 1.
Sample size (n), prevalence of any helminth infection (%), mean total abundance ± SE (mean number of helminth individuals per host, including uninfected hosts), mean intensity ± SE (mean total abundance among infected hosts only), mean helminth richness ± SE (mean number of helminth taxa per host) and number of helminth taxa observed at least once in the host species.
Strix aluco
In S. aluco, 112 of 216 hosts were infected, corresponding to a prevalence of 51.9%, and the mean abundance was 4.5 parasitic individuals per examined host (Figure 1; Table S3). The assemblage included 15 species, making S. aluco the most species-rich host in the dataset (Figure 2; Table S3). The most prevalent and abundant species was C. aluconis (31.9%, mean abundance of 1.6, mean intensity of 5.1), followed by P. spirale (13.9%, mean abundance of 0.3, mean intensity of 2.4), S. strigis (10.2%, mean abundance of 1.3, mean intensity of 12.9) and C. globifera (6.5%, mean abundance of 0.3, mean intensity of 4.7) (Figure 3; Table S3). Decade-level summaries revealed a fluctuating overall prevalence in S. aluco, from 44.6% in the 2000s to 79.2% in the 2010s, with an intermediate value of 48.4% in the 2020s; the weighted mean intensity was highest in the 1980s (28.9) and otherwise remained between 3.8 and 7.0 in later decades (Figure 4; Table S5).
Relationship between prevalence (%) and mean intensity of helminth taxa in Strix aluco (A), Asio otus (B), Bubo bubo (C) and Athene noctua (D). The point size is proportional to the total number of helminth individuals recorded for each combination of host species and helminth species.

Figure 3 Long description
The heatmap displays prevalence percent of helminth taxa across various host species. Lighter shades indicate higher prevalence. Key observations include Strix aluco and Asio otus showing higher prevalence overall. The rows represent helminth taxa such as Centrorhynchus aluconis and Porrocaecum spirale, while columns represent host species like Strix aluco and Bubo bubo. The legend indicates prevalence percent with tick marks at 0, 20, 40, 60, 80 and 100. Notable clusters are seen in taxa like Cladotaenia globifera and Echinoparyphium recurvatum, which show elevated prevalence in specific hosts. Most cells indicate low prevalence, with a few exceptions showing significant values.
Temporal changes in helminth prevalence (A) and infection intensity (B). (A) Temporal trends in helminth prevalence for the 2 most abundant host species, Strix aluco and Asio otus. Values represent 10-year pooled prevalence estimates, and thin lines indicate ± SEM. (B) Temporal changes in helminth infection intensity for the 2 most abundant host species, Strix aluco and Asio otus. The values represent 10-year weighted mean intensity estimates, and the thin lines indicate ± SEM.

Figure 4 Long description
A bubble chart with labeled points. The horizontal axis label is, Prevalence percent, with a range from 0 to 30. The vertical axis label is, Mean intensity infected hosts, with a range from 0 to 80. Bubble size represents, Total individuals, with size labels 1, 10, 50, 100. Labeled points include, MicOsc, ApaGra, StrStr, CenAlu, PorSpi. The highest labeled mean intensity in this sub-image is MicOsc near the top of the axis. Several labeled points are positioned near low prevalence values. The image B showing a bubble chart with labeled points. The horizontal axis label is, Prevalence percent, with a range from 0 to 20. The vertical axis label is, Mean intensity infected hosts, with a range from 0 to 25. Bubble size represents, Total individuals, with size labels 1, 10, 50, 100. Labeled points include, StrStr, ClaGlo, SynLat, CenAlu, PorSpi, BarFal. The largest bubble is StrStr near the highest prevalence and highest mean intensity in this sub-image. Several other labeled points are positioned at lower prevalence values. The image C showing a bubble chart with labeled points. The horizontal axis label is, Prevalence percent, with a range from 0 to 35. The vertical axis label is, Mean intensity infected hosts, with a range from 0 to 30. Labeled points include, EchRev, ClaGlo, CyaAme, CenAlu, BarFal, StrStr, PorSpi. The highest labeled prevalence in this sub-image is PorSpi near the right end of the axis. StrStr and BarFal are positioned at mid to higher prevalence values compared with several other labels. The image D showing a bubble chart with labeled points. The horizontal axis label is, Prevalence percent, with a range from 0 to 30. The vertical axis label is, Mean intensity infected hosts, with a range from 0 to 40. Labeled points include, BarFal, CyaAme, LypPet, ClaGlo. CyaAme is positioned near the highest prevalence in this sub-image. BarFal is positioned at a lower prevalence value with a higher mean intensity value than the other labeled points.
Asio otus
In A. otus, 103 of the 287 hosts were infected, corresponding to a prevalence of 35.9%, and the mean abundance was 5.5 helminth individuals per examined host (Figure 1; Table S3). The assemblage contained 10 taxa, with S. strigis dominating the assemblage (19.2% prevalence, mean abundance 4.6, mean intensity 24.0), followed by B. falconis (10.8%, 0.5, 5.0), P. spirale (8.4%, 0.2, 1.8) and C. aluconis (4.2%, 0.1, 2.5) (Figure 3B; Table S3). In contrast to the S. aluco assemblage, the A. otus assemblage was centred on 1 strongly dominant species, S. strigis (Figure 3B). The decade-level prevalence in A. otus was 42.9% in the 1960s, 56.5% in the 1970s, 41.7% in the 1980s, 38.6% in the 1990s, 45.3% in the 2000s, 35.0% in the 2010s and 14.0% in the 2020s; the weighted mean intensity also declined from 60.0 in the 1960s to 2.5 in the 2020s, although data from the earliest decade was based on very few infected hosts (Figure 4A,B; Table S5).
Bubo bubo
In B. bubo, 22 of 38 hosts were infected, corresponding to a prevalence of 57.9%, and the mean abundance was 6.3 parasites per examined host (Figure 1; Table S3). Seven taxa were recorded in this host, and the most prevalent species was P. spirale (31.6%, mean abundance of 1.2, mean intensity of 3.7), followed by S. strigis (23.7%, 3.4, 14.3) and B. falconis (13.2%, 1.5, 11.4) (Figure 3C; Table S3). The prevalence–intensity pattern differed from that of the 2 most common hosts because S. strigis reached the highest abundance and intensity in B. bubo, whereas P. spirale remained the most prevalent species (Figure 3C).
Athene noctua
In A. noctua, 10 of 25 host individuals were infected, corresponding to a prevalence of 40.0%, and the mean abundance was 10.3 parasites per examined host (Figure 1; Table S3). Only four taxa were found, but the community was strongly dominated by Cyathostoma americana, with a mean prevalence of 28.0% and a mean intensity of 31.4. The three remaining taxa, B. falconis, C. globifera and Lyperosomum petiolatum, each exhibited a prevalence of 4.0% and low intensity (Figure 3D; Table S3). The high abundance of helminths in A. noctua was therefore driven almost entirely by a single species with both high prevalence and very high intensity rather than by greater taxonomic richness (Figure 3D).
Less sampled hosts
In S. uralensis (8/8 infected, 100%), the fauna was dominated by C. aluconis (75.0% prevalence, mean intensity of 18.5) and included seven taxa overall; in O. scops (3/3 infected, 100%), 6 taxa were recorded and the mean abundance reached 74.0 because of very heavy infections by Brachylecithum lobatum (66.7% prevalence, mean intensity of 95.5); in A. flammeus (3/7 infected, 42.9%), 3 taxa were detected; and in A. funereus (1/1 infected, 100%), a single specimen of C. globifera was recorded (Figures 1 and 2; Table S3). No helminths were detected in T. alba (0/58) or G. passerinum (0/2) (Figure 1; Table S3).
Community patterns
The community structure was host-specific (Figure 2; Table 2). The most prominent species were S. strigis, C. aluconis, B. falconis, Microtetrameres oshmarini, C. globifera and P. spirale (Figure 2). Some taxa, notably C. aluconis in S. aluco and S. uralensis, C. americana in A. noctua and B. lobatum in O. scops, were concentrated in one or a few hosts, whereas others, such as S. strigis and C. globifera, occurred across several host species at variable prevalence (Figure 2; Table S3).
Host specificity of selected helminths, addressing H3

Table 2 Long description
Rows list helminth taxa with two metrics, prevalence percent with 95 percent confidence intervals and mean intensity plus or minus standard error, across host columns Strix aluco, Asio otus, Bubo bubo, Athene noctua, Otus scops, and Tyto alba, plus columns for chi2 host and p host for prevalence. For prevalence, Brachylecithum lobatum is 66.7 percent in Otus scops and 0.0 percent in Strix aluco, Asio otus, Bubo bubo, Athene noctua, and Tyto alba, with chi2 host 417.3 and p host less than 0.001. Centrorhynchus aluconis prevalence is 31.9 percent in Strix aluco, 4.2 percent in Asio otus, 10.5 percent in Bubo bubo, 0.0 percent in Athene noctua, 66.7 percent in Otus scops, and 0.0 percent in Tyto alba, with chi2 host 102.3 and p host less than 0.001. Cyathostoma americana prevalence is 0.0 percent in Strix aluco, 0.3 percent in Asio otus, 2.6 percent in Bubo bubo, 28.0 percent in Athene noctua, 0.0 percent in Otus scops, and 0.0 percent in Tyto alba, with chi2 host 131.5 and p host less than 0.001. Porrocaecum spirale prevalence is 13.9 percent in Strix aluco, 8.4 percent in Asio otus, 31.6 percent in Bubo bubo, and 0.0 percent in Athene noctua, Otus scops, and Tyto alba, with chi2 host 68.9 and p host less than 0.001. Strigea strigis prevalence is 10.2 percent in Strix aluco, 19.2 percent in Asio otus, 23.7 percent in Bubo bubo, and 0.0 percent in Athene noctua, Otus scops, and Tyto alba, with chi2 host 26.3 and p host less than 0.001; Baruscapillaria falconis prevalence is 2.8 percent in Strix aluco, 10.8 percent in Asio otus, 13.2 percent in Bubo bubo, 4.0 percent in Athene noctua, and 0.0 percent in Otus scops and Tyto alba, with chi2 host 19.8 and p host 0.001. For mean intensity, Brachylecithum lobatum is 95.5 plus or minus 56.5 in Otus scops; Centrorhynchus aluconis is 5.1 plus or minus 1.0 in Strix aluco, 2.5 plus or minus 0.7 in Asio otus, 1.3 plus or minus 0.3 in Bubo bubo, and 2.0 plus or minus 1.0 in Otus scops. Cyathostoma americana mean intensity is 31.4 plus or minus 18.2 in Athene noctua, and Strigea strigis mean intensity is 12.9 plus or minus 7.7 in Strix aluco, 24.0 plus or minus 5.0 in Asio otus, and 14.3 plus or minus 7.2 in Bubo bubo.
Prevalence (%) with 95% binomial confidence intervals and mean intensity (mean number of individuals among infected hosts) ± SE are shown for selected helminth taxa across principal owl hosts (Strix aluco, Asio otus, Bubo bubo, Athene noctua and Tyto alba). For each helminth taxon, a χ 2 test (χ 2 statistic and P-value) was used to evaluate non-random occurrence across host species.
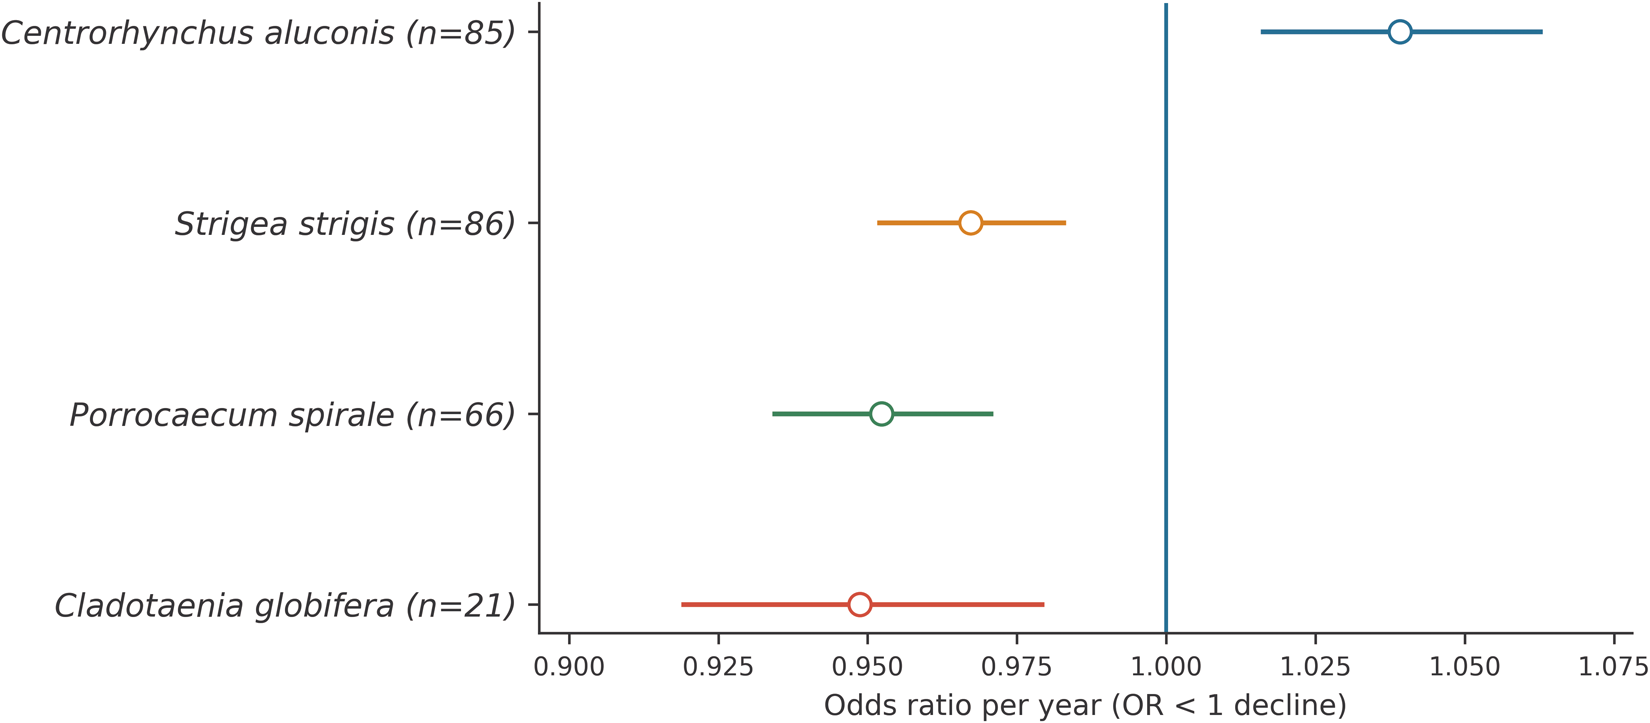
Descriptive decade-level temporal summaries were produced for the 2 most abundant hosts, A. otus and S. aluco. Overall helminth prevalence in A. otus remained comparatively stable across most decades before declining sharply in the 2020s, whereas helminths of S. aluco showed stronger decade-to-decade fluctuations in prevalence, with a peak in the 2010s (Figure 4A; Table S5). The decade-level mean intensity in A. otus also tended to decline over time, whereas S. aluco showed less directional variation in intensity than in prevalence (Figure 4B; Table S5). Formal host- and season-adjusted binomial models were fitted at the individual-host level in the 4 principal helminth-positive host species. Community-level temporal models addressing H1 are summarized in Table 3, and taxon-specific temporal models are summarized in Figure 5 and Table S6. Five parasite taxa met the inclusion threshold of at least 20 positive host records. Three taxa showed significant negative year effects: S. strigis, P. spirale and C. globifera. C. aluconis showed a weak positive year effect, whereas B. falconis did not show a significant temporal trend (Figure 5; Table S6). A complete list of coefficient estimates is provided in Table S7.
Year effects on helminth occurrence, adjusted for host species and season. Points show odds ratios per year, and horizontal lines show 95% confidence intervals. Only taxa with significant year effects (P < 0.05) are shown; values below 1 indicate a decrease in occurrence over time, whereas values above 1 indicate an increase in occurrence.

Community-level temporal models addressing H1

Table 3 Long description
Three models report effects for predictors on any infection as odds ratio, total abundance as incidence rate ratio, and richness as incidence rate ratio, each with confidence interval low and high and P. For any infection, year per 1 year increase has effect 1.02 with CI low 1.01 and CI high 1.03, P 0.001. For any infection, host effects versus the reference are Athene noctua 0.59 with CI 0.25 to 1.42, P 0.241; Bubo bubo 0.43 with CI 0.21 to 0.86, P 0.017; Strix aluco 0.45 with CI 0.31 to 0.65, P less than 0.001. For total abundance, year per 1 year increase has effect 0.97 with CI 0.95 to 0.98, P less than 0.001; host effects are Athene noctua 4.81 with CI 1.65 to 14.04, P 0.004; Bubo bubo 1.52 with CI 0.64 to 3.59, P 0.339; Strix aluco 1.21 with CI 0.75 to 1.97, P 0.431. For richness, year per 1 year increase has effect 0.99 with CI 0.98 to 0.99, P less than 0.001; host effects are Athene noctua 1.03 with CI 0.53 to 2.02, P 0.920; Bubo bubo 1.77 with CI 1.19 to 2.65, P 0.005; Strix aluco 1.71 with CI 1.34 to 2.17, P less than 0.001.
Estimated effects (with 95% CI and P-values) of sampling year (per 1-year increase) and host species (relative to the reference host in the fitted model) on (i) the probability of infection with any helminth taxon (odds ratio, OR), (ii) total helminth abundance per host (incidence rate ratio, IRR) and (iii) helminth taxon richness per host (IRR). Models were fitted at the individual-host level and included host species, sampling year and season as explanatory variables.
Seasonality was evaluated as a supporting analysis to assess whether seasonal sampling structure affected taxon-specific occurrence patterns. Among the 5 parasite taxa meeting the minimum inclusion threshold, no significant additive seasonal effect was detected after accounting for host identity and sampling year (Table S8). Exploratory host-by-season interaction tests indicated a host-dependent seasonal pattern only for B. falconis (LR = 25.31, df = 9, P = 0.003), but this result was treated cautiously because of uneven data distribution among host species and seasons.
Discussion
Owl helminth communities were host-structured, and the dominant taxa differed not only in prevalence but also in intensity and total abundance. Similarly, previous studies revealed that owl helminth assemblages share a limited core of recurrent taxa but are nevertheless strongly shaped by host ecology and feeding niches rather than by host taxonomy alone (Ewald and Crompton, Reference Ewald and Crompton1993; Ferrer et al., Reference Ferrer, Molina, Castellà and Kinsella2004; Santoro et al., Reference Santoro, Mattiucci, Nascetti, Kinsella, Di Prisco, Troisi, D`alessio, Veneziano and Aznar2012a).
In S. aluco, the high species richness and dominance of C. aluconis are consistent with British data, in which C. aluconis was also the dominant helminth of S. aluco, and P. spirale ranked among the major accompanying taxa. The recurrence of this pattern across studies suggests that the trophic pathways supporting transmission in S. aluco are stable across multiple regions (Ewald and Crompton, Reference Ewald and Crompton1993).
The long-term decline in S. strigis in the present dataset is probably linked to the reduced availability of amphibian intermediate hosts. Species of Strigea have complex life cycles in which larval development involves aquatic and terrestrial stages, including stages in the amphibian intermediate hosts. Moreover, mesocercarial or metacercarial transmission can continue through reptiles, birds and mammals that prey on infected amphibians, and the definitive hosts are predatory birds, including owls (Faltýnková et al., Reference Faltýnková, Jouet, Nielsen and Skírnisson2024). A decline in amphibian availability would therefore be expected to disrupt transmission across several trophic steps and could reduce the frequency of adult Strigea in owls over time (López-Jiménez et al., Reference López-Jiménez, González-García, Andrade-Gómez and García-Varela2023; Faltýnková et al., Reference Faltýnková, Jouet, Nielsen and Skírnisson2024). Amphibians were documented to be components of S. aluco diets in multiple European studies, especially during parts of the breeding season, even though small mammals usually dominate the overall prey composition. If amphibians have become rarer in agricultural and peri-urban habitats, the parasites that depend on amphibian-mediated transmission routes would decline even if the owls themselves persisted locally (Galeotti, Reference Galeotti2001; Gryz and Krauze-Gryz, Reference Gryz and Krauze-Gryz2019).
The near-absence of the usual helminth fauna in A. noctua and T. alba is of particular interest. Both of these species were previously reported to host substantially richer helminth assemblages, and A. noctua in particular were among the most intensively parasitized hosts in the Spanish material (Ferrer et al., Reference Ferrer, Molina, Castellà and Kinsella2004; Santoro et al., Reference Santoro, Mattiucci, Nascetti, Kinsella, Di Prisco, Troisi, D`alessio, Veneziano and Aznar2012a). Therefore, the absence or low prevalence of helminths observed in the present study is unlikely to reflect a general biological paucity of parasites in these owls. A likely explanation is a contraction of prey diversity around human settlements. If A. noctua and T. alba now feed predominantly on a narrow set of synanthropic or open-field prey, such as the house mouse and common vole, while feeding on fewer frogs, shrews and larger insects than in the past, opportunities for transmission of several trophically transmitted helminths would be reduced. In this scenario, the absence of frogs in the food of A. noctua and T. alba could contribute to the loss of Strigea spp. Reduced consumption of shrews, which can serve as paratenic hosts of C. aluconis, could limit its transmission (Ewald et al., Reference Ewald, Crompton, Johnson and Stoddart1991). Reduced predation on small mammals, particularly voles, could lower exposure to C. globifera (Hołówka et al., Reference Hołówka, Ionică, Ilea, Poșa, Cotuțiu, Bulacu, Sitko, Vasiliu, Mihalca and Gherman2024), whereas reduced consumption of insects could weaken transmission of Plagiorchis elegans and Prosthogonimus ovatus, whose life cycles involve insect second intermediate hosts (Gorman, Reference Gorman1980; Öztürk and Umur, Reference Öztürk and Umur2023). This interpretation remains a hypothesis but is consistent with published evidence demonstrating that changes in land use and farmland structure have reduced habitat quality and prey availability for A. noctua in Central Europe (Šálek and Schröpfer, Reference Šálek and Schröpfer2008; Šálek et al., Reference Šálek, Chrenková and Kipson2013).
The presence of Diplostomum spathaceum and Apatemon gracilis in S. aluco is also biologically informative. Both genera are linked to aquatic food webs involving fish-eating birds, snails and fish, and their occurrence in owls implies at least occasional access to prey connected with wet habitats. Fish are usually rare prey in the owl diet, but they have been repeatedly documented in the S. aluco diet, which is consistent with the occasional acquisition of fish-associated trematodes (Galeotti, Reference Galeotti2001; Pérez-del-Olmo et al., Reference Pérez-del-Olmo, Georgieva, Pula and Kostadinova2014). These records support the view that owl helminth faunas can retain traces of the occasional exploitation of aquatic prey or prey from wetland food webs, even when fish do not constitute a major fraction of the diet in pellet-based studies (Komorová et al., Reference Komorová, Sitko, Špakulová, Hurníková, Sałamatin and Chovancová2017). The contrast between historical helminth records and the reduced fauna seen here in synanthropic owl species suggests that parasite data may preserve information about past diet breadth that is not always obvious from contemporary dietary summaries. Owls have a wide trophic spectrum, but explicit comparisons between older and newer diet datasets are lacking. The temporal trends observed here may reflect not only changes in parasite species sensu stricto but also the long-term simplification of prey spectra in human-modified landscapes (Galeotti, Reference Galeotti2001; Gryz and Krauze-Gryz, Reference Gryz and Krauze-Gryz2019).
The significant increase of C. aluconis contrasts with the decreases recorded for S. strigis, P. spirale and C. globifera. This divergence indicates that long-term change was species-specific rather than community-wide and likely reflects differences in life cycles, intermediate hosts and host-feeding pathways. Therefore, pooling all helminths into a single infection metric would have obscured the weakening of some transmission routes. In contrast, other transmission routes remain stable or have even intensified (Santoro et al., Reference Santoro, Mattiucci, Nascetti, Kinsella, Di Prisco, Troisi, D`alessio, Veneziano and Aznar2012a).
H1: Community-level decline
Our analyses provided partial support for the hypothesis of a community-level decline. Total helminth abundance and taxon richness decreased significantly over time, whereas the probability of infection with at least one helminth showed a significant (but negligible) increase. Thus, temporal change was not concordant across all three community-level endpoints. The decline was expressed primarily as lower parasite loads and reduced taxonomic richness, rather than as a decrease in the probability of carrying any helminth. Because these endpoints respond differently to changes in transmission (e.g. reduced exposure can lower prevalence; reduced recruitment can lower abundance and the loss of rare taxa can lower richness), these results suggest a reduction in effective transmission rather than the simple redistribution of taxa. Such system-wide declines are consistent with the general expectation that parasites with complex trophic links are sensitive to disruptions or weakening of host–prey–parasite pathways, and that losses can be detected as reductions in parasite diversity and occurrence even when definitive hosts remain present (Lafferty, Reference Lafferty2012).
A useful point of comparison comes from our long-term helminth datasets in other avian systems, where directional change is often most clearly expressed as shifts in the dominant taxa and the simplification of component communities, rather than as uniform changes across all species (Sitko and Heneberg, Reference Sitko and Heneberg2023). The mechanism identified in the present study in examined owls fits this pattern: despite the presence of many rare taxa, the clearest temporal signals are concentrated in taxa that are frequent enough to drive community-level metrics and to provide sufficient power for trend detection.
H2: Host-specific trajectories over time
Identical declines in helminths did not occur across hosts. Host-specific time effects indicate that temporal trajectories diverge among owl species, as expected when hosts differ in the prey routes that sustain transmission and in the taxa that dominate their component communities. This host dependence is a central theme in the comparative helminth ecology of raptors and owls and has been explicitly demonstrated when Strigiformes are analysed alongside diurnal raptors: helminth communities are not simply raptor parasites, but form distinct assemblages that differ among raptor orders and among species within those orders (Santoro et al., Reference Santoro, Mattiucci, Nascetti, Kinsella, Di Prisco, Troisi, D`alessio, Veneziano and Aznar2012a, Reference Santoro, Kinsella, Galiero, Degli Uberti and Aznar2012b; Sitko and Heneberg, Reference Sitko and Heneberg2019). Therefore, the decline should not be considered as a single, uniform phenomenon across owls. Instead, the strongest and most informative tests are host-by-host tests, with the expectation that the direction and magnitude of change depend on which transmission pathways are most important for each host (Santoro et al., Reference Santoro, Mattiucci, Nascetti, Kinsella, Di Prisco, Troisi, D`alessio, Veneziano and Aznar2012a; Sitko and Heneberg, Reference Sitko and Heneberg2019). Asio otus provides the clearest example in our dataset because it couples a strong signal indicating time-dependent variation in a dominant trematode with a community composition that differs markedly from that of S. aluco (see below). Conversely, hosts whose infection is driven by strongly host-associated taxa that remain common may show weaker apparent declines at the community level even when other taxa diminish.
H3: Host specificity of dominant taxa
Host specificity is strongly supported and extends beyond a few illustrative examples. The clearest signature association in our dataset is the high odds of C. aluconis in S. aluco, which is consistent with prior owl community studies identifying C. aluconis as a numerically important and frequently encountered taxon in multiple owl hosts (Santoro et al., Reference Santoro, Mattiucci, Nascetti, Kinsella, Di Prisco, Troisi, D`alessio, Veneziano and Aznar2012a), and with broader raptor-wide work showing substantial fractions of helminths confined to a single raptor order and additional sets with core hosts in only one order (Sitko and Heneberg, Reference Sitko and Heneberg2019). The second particularly strong host-specific signal corresponds to C. americana in A. noctua. Although Cyathostoma is not as frequently discussed in the general owl helminth literature as Centrorhynchus or Strigea are, the pattern we observe is consistent with the broader conclusion from owl community comparisons that ‘owl generalists’ coexist with taxa that show strong host or guild associations, producing stable differences among hosts (Santoro et al., Reference Santoro, Mattiucci, Nascetti, Kinsella, Di Prisco, Troisi, D`alessio, Veneziano and Aznar2012a).
Host specificity in our material is not limited to these two taxa. When taxa are screened across the principal host species, additional helminths show strongly host-structured distributions (e.g. P. spirale, B. falconis and selected cestodes), reinforcing the notion that host identity is a primary axis that structures helminth occurrence. Host identity as a main driver is precisely what would be expected if exposure is governed by prey-route differences rather than by host phylogeny alone, an interpretation that has been repeatedly emphasized in comparative raptor and owl helminth datasets (Santoro et al., Reference Santoro, Mattiucci, Nascetti, Kinsella, Di Prisco, Troisi, D`alessio, Veneziano and Aznar2012a; Sitko and Heneberg, Reference Sitko and Heneberg2019).
H4: Taxon-specific declines
The decrease in signal is taxon-specific rather than uniform across the helminth fauna. The most prominent example is S. strigis, whose prevalence decreases over time, whereas the prevalence of other taxa remains stable or changes in different ways. This pattern, a prominent change concentrated in only a subset of taxa, suggests that what declines is not helminths in general, but particular transmission routes (Sitko and Heneberg, Reference Sitko and Heneberg2023). A similar logic holds in owls from southern Italy, where differences among owl species were disproportionately driven by a small number of taxa that accounted for most of the dissimilarity among hosts (Santoro et al., Reference Santoro, Mattiucci, Nascetti, Kinsella, Di Prisco, Troisi, D`alessio, Veneziano and Aznar2012a).
From a system perspective, taxon-specific decline is more informative than a uniform decline because this observation narrows mechanistic inference: it suggests that the weak link is more likely the availability of particular intermediate/paratenic hosts or key prey types, rather than a generic reduction in definitive host competence. If most helminths are specialists at the order level, then changes in trophic ecology within an order (e.g. within Strigiformes) can affect some taxa strongly but leave others comparatively unchanged (Sitko and Heneberg, Reference Sitko and Heneberg2019).
The contrasting trajectories of the dominant taxa in the 2 best-represented hosts are particularly informative. The decline of S. strigis, which was especially prominent in A. otus, is consistent with weakening amphibian-mediated trophic pathways. In contrast, the increase of C. aluconis, which was concentrated primarily in S. aluco, suggests that terrestrial prey-mediated transmission remained stable or intensified. These divergent patterns indicate that long-term ecological change affected specific trophic links rather than producing a uniform decline across owl helminth communities.
H5: Seasonality is pathway- and host-dependent
This hypothesis received little support. Among the parasite taxa meeting the minimum inclusion threshold, seasonality did not emerge as a consistent predictor after accounting for host identity and sampling year. The only retained evidence for seasonal structure was a host-by-season interaction in B. falconis, indicating that this pattern was host-dependent rather than a general seasonal signal across owl helminths. This result contrasts with our earlier work on central European grebes and loons, in which seasonality was a clearer component of helminth community structure (Sitko and Heneberg, Reference Sitko and Heneberg2015). Thus, seasonality did not represent a major driver of the long-term patterns observed here, but its inclusion helped verify that the main temporal results were not explained by seasonal sampling structure.
Other remarks
The inclusion of 58 T. alba individuals, all of which were helminth-free, provided a striking contrast to the other owl hosts in our dataset and strengthened the inference that host identity (and/or the ecological context associated with it) can drive very large differences in helminth occurrence. However, published European datasets indicate that T. alba does not universally lack helminths; rather, infection has been detected in multiple regions in studies of various designs. These studies included the 41 T. alba examined by Santoro et al. (Reference Santoro, Mattiucci, Nascetti, Kinsella, Di Prisco, Troisi, D`alessio, Veneziano and Aznar2012a) in Calabria (southern Italy), 49 T. alba collected from Spanish recovery centres by Sanmartín et al. (Reference Sanmartín, Alvarez, Barreiro and Leiro2004), 15 T. alba examined in the Netherlands by Borgsteede et al. (Reference Borgsteede, Okulewicz, Zoun and Okulewicz2003) and 3 T. alba examined in Slovakia by Komorová et al. (Reference Komorová, Sitko, Špakulová, Hurníková, Sałamatin and Chovancová2017). Therefore, the 58/58 helminth-free dataset in our material represents an extreme outcome. One possible explanation for the helminth-negative T. alba dataset is unusually low exposure due to the local food web structure. Another possibility, raised here as a testable hypothesis, is that agricultural chemical pressure suppresses helminths directly or indirectly. In particular, azole fungicides are ubiquitous in agriculture, and triazole/azole scaffolds, originally developed as antifungals, are increasingly recognized as having broader antiparasitic potential, including activity against helminths, in drug discovery and pharmacological contexts (Paprocka et al., Reference Paprocka, Kołodziej, Wiese-Szadkowska, Helmin-Basa and Bogucka-Kocka2022). This does not demonstrate that agricultural azoles act as field-scale anthelmintics in owl prey webs, but it does make the hypothesis chemically plausible: persistent exposure of intermediate/paratenic hosts (or free-living stages) to compounds with antiparasitic activity could reduce transmission efficiency. Under this hypothesis, the key prediction is spatial: the absence of helminths in T. alba should covary with proxies of agricultural fungicide use and with prey composition rather than being consistent across regions. This prediction can be evaluated by combining future T. alba necropsies with locality-level agricultural intensity indices and by comparing helminth outcomes among T. alba from differing land use contexts.
Limitations
The main limitation of the study is the strong imbalance in host sample sizes. Robust inference is concentrated in A. otus and S. aluco, whereas the results for several other owl species are necessarily descriptive because of the small sample size. A second limitation is the lack of direct long-term dietary data linked to the parasitological material. Several interpretations proposed here, especially those concerning amphibians, shrews, insects and fish as transmission links, are biologically well grounded but remain inferential rather than directly demonstrated. Temporal analyses were simplified into decade-level summaries for descriptive purposes and linear year effects for formal modelling. This approach improves interpretability, but may miss non-linear changes or shorter pulses in transmission. Furthermore, the material spans a long history of collection.
Conclusions
Helminth communities of owls are not random collections of parasites but rather sensitive ecological signals that reflect host diet, transmission pathways and long-term environmental change. The results of the present study revealed that parasite assemblages were strongly host-specific, that several common taxa decreased significantly over time and that these shifts were not uniform across the community, with S. strigis decreasing and C. aluconis increasing. The most compelling interpretation is that these changes mirror a simplification of trophic links in modern landscapes: when amphibians, shrews, insects and other prey associated with diverse transmission routes are no longer present in the diet, the parasites that depend on them disappear as well. In this sense, helminths do more than document infection; they preserve evidence of changes in owl feeding ecology over decades. Owl helminths should therefore be viewed not only as components of biodiversity but also as informative indicators of hidden ecological loss, revealing the erosion of prey diversity and food-web complexity that may otherwise be difficult to detect.
Supplementary material
The supplementary material for this article can be found at https://doi.org/10.1017/S0031182026102698.
Data availability statement
Representative specimens of the trematodes analysed in this study are available in the collections of the Comenius Museum in Přerov. All data are available in the main text and its supplementary materials.
Acknowledgements
We thank the governmental and local authorities for providing the necessary permissions to conduct this long-term research. We also thank the landlords and the staff of local rescue stations for providing us with carcasses of untreatable birds.
Author contributions
J.S. and P.H. conceived the study; J.S. collected the data; P.H. analysed the data and wrote the manuscript; and both authors revised the manuscript and agreed on its final version.
Financial support
The study was supported by the Ministry of Culture of the Czech Republic project DE07P04OMG007.
Competing interests
The authors declare that there are no conflicts of interest.
Ethical standards
Not applicable. All the host birds were obtained dead, and, therefore, no ethics permit was required by the Czech law. The research was authorized by the Ministry of the Environment of the Czech Republic; the most recent permit was issued on 3 August 2009, under No. 11171/ENV/09-747/620/09-ZS 25. The collection of birds that originated from the Bartošovice Rescue Station was permitted by the Ministry of the Environment of the Czech Republic, permit No. 2020/630/2473, dated 13 October 2020.




 Open access

