




Introduction
The adoption of low-protein (LP) diets in poultry production has emerged as a key strategy for improving sustainability, as it reduces reliance on soybean meal, lowers feed costs, and mitigates nitrogen emissions (Sun et al. Reference Sun, Liu and Shi2015; Wen et al. Reference Wen, Wang and Zheng2018). Our previous studies suggested that an LP dietary strategy may influence the absorption, metabolism, and excretion of trace minerals in laying hens (Zhang et al. Reference Zhang, Shi and Li2026, Reference Zhang, Wang and Zhao2025). Protein nutrition is closely linked to mineral metabolism because many processes involved in mineral absorption, transport, and storage depend on protein-mediated mechanisms (Wapnir Reference Wapnir1989). For example, the intestinal uptake of trace minerals such as Fe, Mn, Zn, and Cu is mediated by specific transporter proteins, whereas their systemic transport and storage depend on proteins such as transferrin, ferritin, and metallothionein (Chavez-abiega et al. Reference Chavez-Abiega, Mos, Centeno and Islam2019; Nishito and Kambe Reference Nishito and Kambe2018). In addition, amino acids can form complexes with metal ions, thereby potentially influencing mineral bioavailability and utilization (Ashaolu et al. Reference Ashaolu, Lee and Ashaolu2023). Therefore, changes in dietary protein supply may alter the absorption, tissue distribution, and metabolic regulation of trace minerals in poultry.
Among the essential trace elements in poultry nutrition, Fe, Mn, Zn, and Cu play critical roles in maintaining physiological functions and production performance (Arredondo and Núñez Reference Arredondo and Núñez2005; Stefanidou et al. Reference Stefanidou, Maravelias and Dona2006; Sun et al. Reference Sun, Liu and Shi2015; Von Drygalski and Adamson Reference Von Drygalski and Adamson2013). These minerals serve as cofactors for numerous enzymes involved in oxidative metabolism, antioxidant defense, connective tissue formation, and eggshell matrix development (Spears Reference Spears2003; Zidenberg-cherr and Keen Reference Zidenberg-cherr and Keen1991). Zn and Mn participate in enzymatic systems associated with eggshell formation and bone metabolism, whereas Cu is involved in collagen synthesis and in maintaining the structural integrity of eggshell membranes (Bittner et al. Reference Bittner, Kraus and Schäkermann2017). Fe plays a central role in oxygen transport and cellular metabolism, both of which are essential for sustaining productive activity in laying hens (Sun et al. Reference Sun, Liu and Shi2015). Adequate supply and efficient utilization of these trace minerals are therefore crucial for maintaining egg production and egg quality. Because of their essential biological functions, in commercial production systems, trace minerals are often supplemented in excess to ensure optimal performance (Malheiros et al. Reference Malheiros, Malheiros and Anderson2025). Such practices may result in inefficient mineral utilization and excessive mineral excretion in manure, thereby contributing to environmental contamination (Bao et al. Reference Bao, Choct and Iji2010; Wang et al. Reference Wang, Liu and Wang2019). Therefore, reducing unnecessary mineral excretion while maintaining production performance has become an important objective in the development of precision trace mineral nutrition strategies. In response to this challenge, there is increasing interest in developing more precise trace mineral nutrition strategies to improve nutrient utilization efficiency while reducing environmental pollution.
Another challenge in optimizing trace mineral nutrition lies in the complex interactions among different minerals (O’dell Reference O’dell1997). Previous studies have demonstrated that excessive levels of certain minerals may interfere with the absorption and utilization of others. For example, high dietary levels of Zn and Cu may antagonize iron absorption, whereas excessive Mn may impair Fe utilization, particularly when these minerals are supplied in inorganic forms (Baker and Halpin Reference Baker and Halpin1991; O’dell Reference O’dell1984). In addition, deficiencies in individual minerals may alter feed intake and indirectly affect the intake of other trace elements (Bao et al. Reference Bao, Choct and Iji2009). These interactions indicate that the optimal level of an individual mineral is not fixed but depends on the concentrations of other minerals present in the diet. When the nutritional background of the diet changes substantially, as occurs under LP feeding strategies, the overall metabolic status of the animal may also shift.
Our previous studies demonstrated that reducing dietary crude protein (CP) to 15.0–15.5% significantly improved overall nutrient utilization efficiency and Mn utilization in laying hens (Zhang et al. Reference Zhang, Shi and Li2026). Building upon these findings, the present study further investigated the interactive effects of Fe, Cu, Mn, and Zn on production performance, egg quality, and mineral excretion in laying hens fed an LP diet containing 15% CP. The aim was to provide a scientific basis for the precision supplementation of trace minerals under LP dietary conditions. Considering the multifactorial and interactive nature of trace mineral nutrition, a uniform design was employed to efficiently evaluate the combined effects of multiple minerals at different levels. Compared with traditional factorial or orthogonal experimental designs, uniform design enables a more uniform distribution of experimental points across a multidimensional space while requiring fewer experimental runs. This approach is particularly advantageous for studies involving multiple trace elements and their complex interactions, as it improves the efficiency of detecting key factors influencing response variables. The results of this study may provide preliminary evidence for optimizing trace minerals supplementation strategies in LP diets for laying hens.
Material and methods
Animals, diets, and experimental design
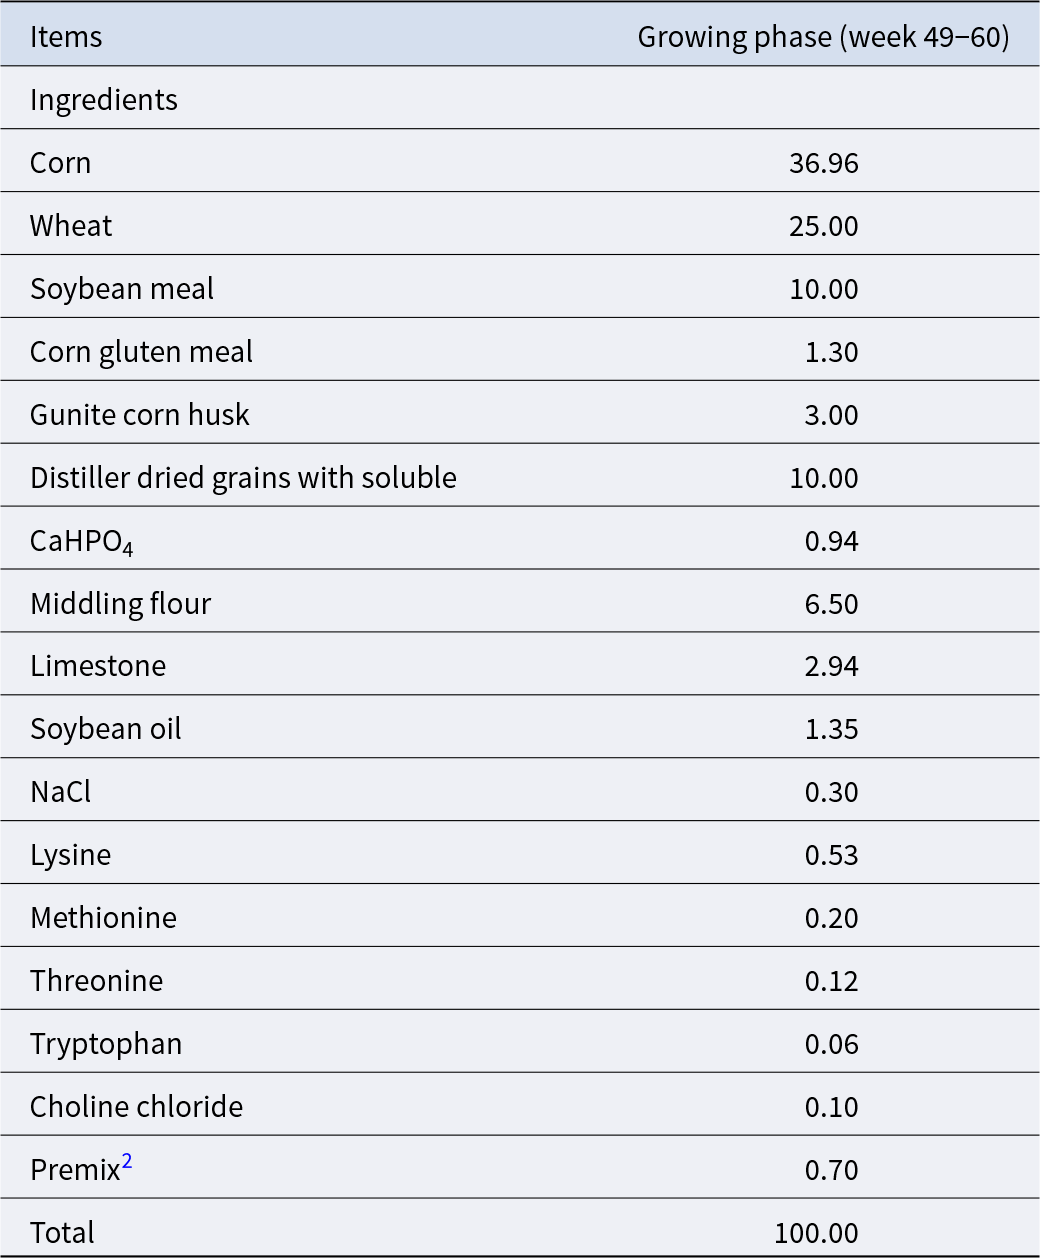
A total of 1,008 47-week-old Hy-Line Brown laying hens were divided into 12 dietary treatments according to body weight and laying rate using a completely randomized design, with 7 replicates per treatment and 12 hens per replicate. The birds were housed in a three-tier battery cage system in an environmentally controlled facility, with three hens allocated to each cage. The temperature was maintained at 20 ± 3°C, and the photoperiod was set at 16 h of light per day. Feed and water were provided ad libitum throughout the experimental period. Routine vaccinations, disinfection, and other management practices were carried out in accordance with the rearing manual. The experiment consisted of a 2-week acclimation period followed by a 12-week formal trial (from 49 to 60 weeks of age). Diets were formulated according to the feeding standards for Hy-Line Brown laying hens in Shaanxi Province. A corn–soybean meal-based basal diet was used, with CP adjusted to 15%. Except for the trace mineral elements evaluated in this study, all other nutrient levels met or exceeded the nutritional requirements of the hens (Table 1).
The composition of basic diets and nutrient levels (%, air-dry basis)1

Table 1 Long description
Ingredient composition for a growing-phase diet during weeks 49 to 60 is reported as percent of the air-dry diet. Corn is the largest component at 36.96%, followed by wheat at 25%. Protein and energy supplements include soybean meal at 10%, distillers dried grains with soluble at 10%, middling flour at 6.50%, and corn gluten meal at 1.30%. Fiber and mineral sources include gunite corn husk at 3.00%, limestone at 2.94%, and calcium hydrogen phosphate at 0.94%, with salt at 0.30%. Added fats and amino acids are soybean oil at 1.35% and crystalline lysine 0.53%, methionine 0.20%, threonine 0.12%, and tryptophan 0.06%. Micronutrient additions include choline chloride at 0.10% and a premix at 0.70%. Values sum to a complete diet totaling 100%.
1 The analyzed nutrient levels of each treatment diet are shown in Table 4.
2 The premix provided the following per kg of diet: I 0.35 mg, Se 0.3 mg, VA 8,000 IU, VD3 1,600 IU, VE 30 IU, VK3 1.5 mg, VC 200 mg,VB1 4 mg, VB2 13 mg, VB5 15 mg, VB3 20 mg, VB6 6 mg, VB7 0.15 mg, VB9 1.5 mg, and VB12 0.02 mg.
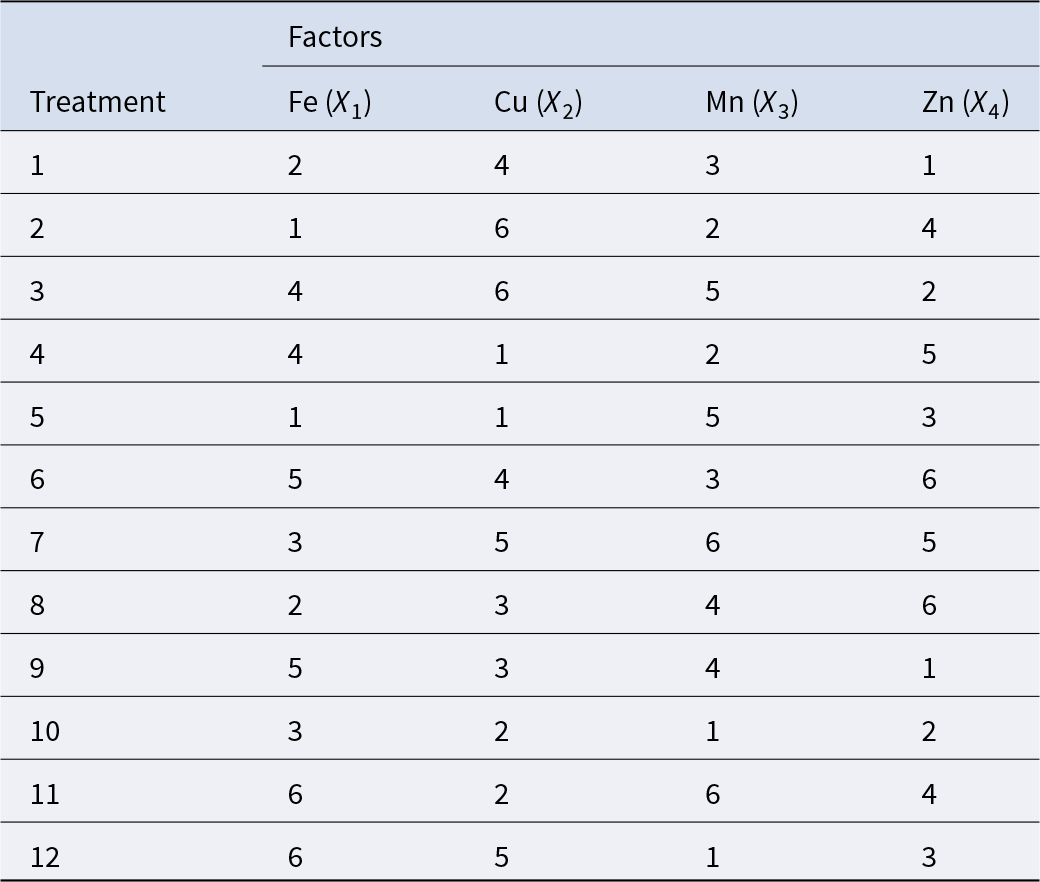
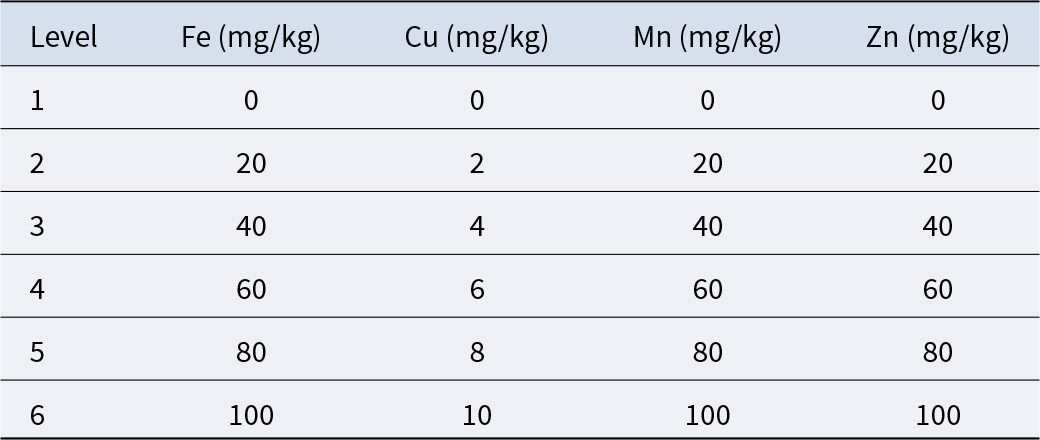
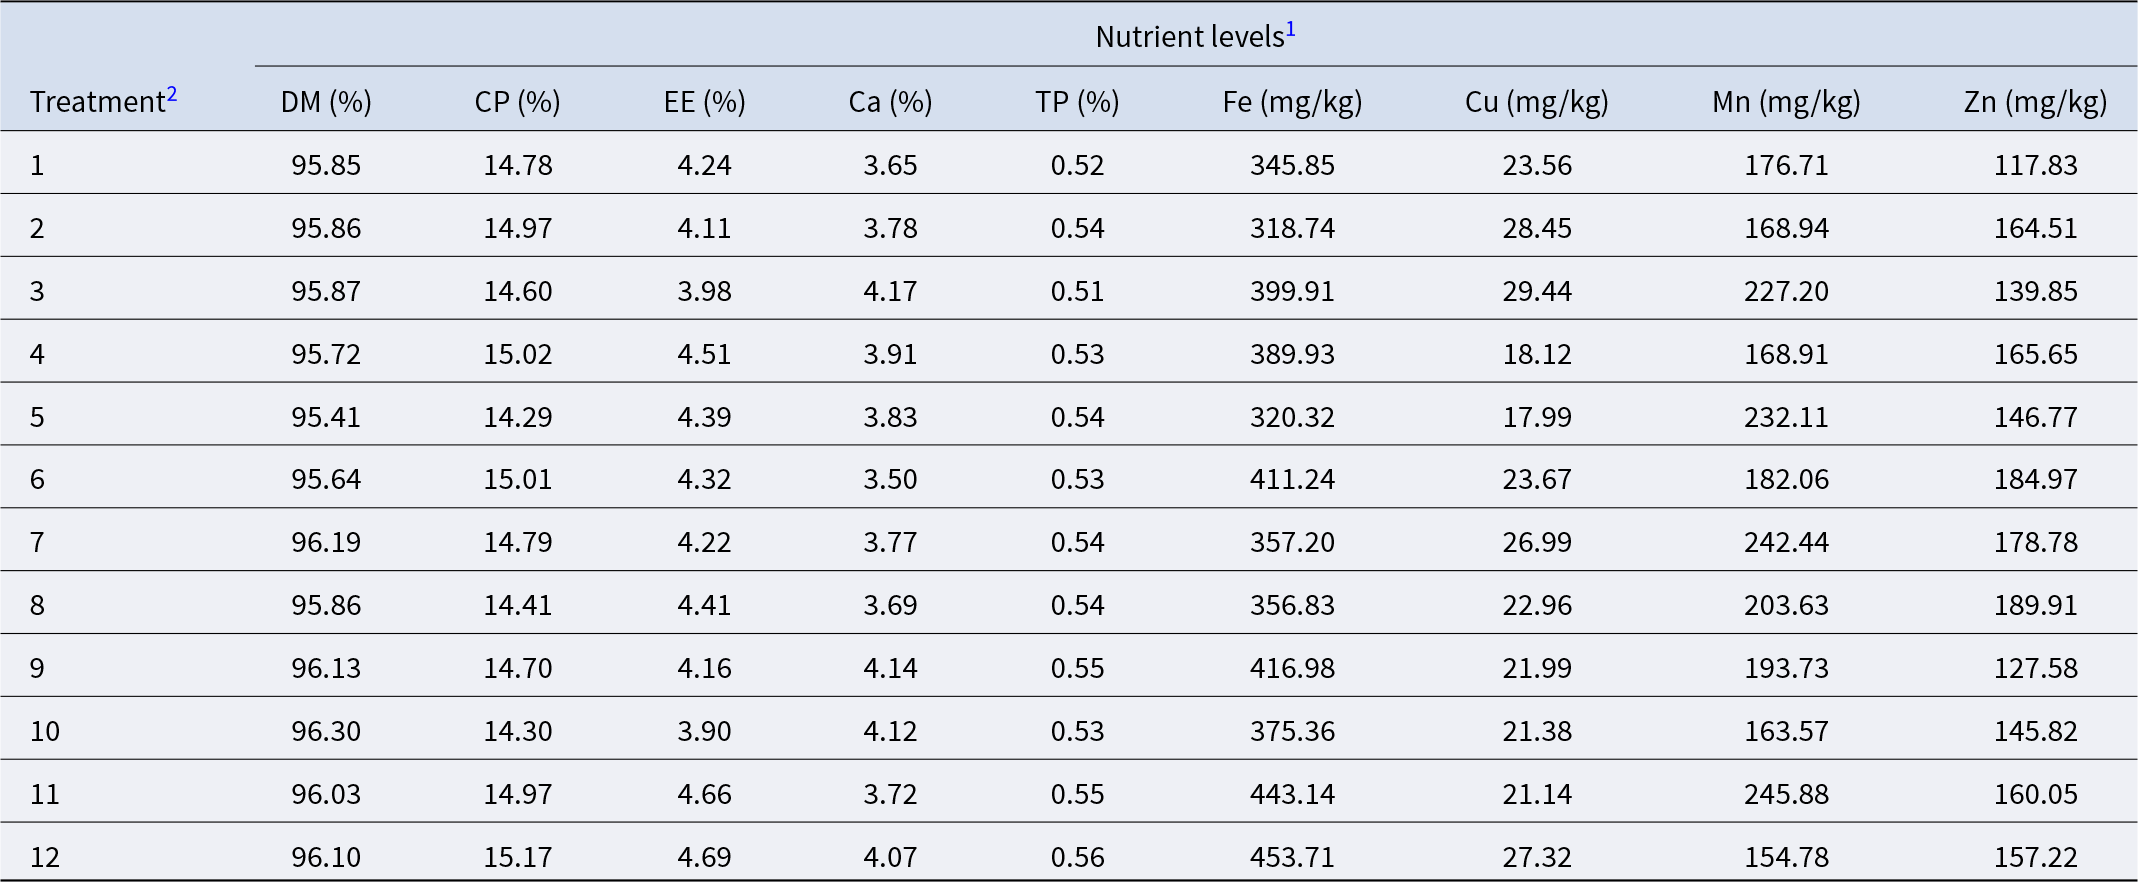
Experimental diets for each treatment were prepared according to a uniform experimental design table generated by the DPS data processing system (Table 2), comprising four factors (Fe, Cu, Mn, and Zn) at six levels each (Table 3). All four trace mineral elements were provided in the form of their sulfate salts. The mineral supplementation levels were established based on the nutrient requirements of laying hens reported by the National Research Council (1994) and ranges commonly used in commercial layer diets, particularly for Hy-Line Brown hens. The lowest levels involved no additional supplementation of trace minerals, representing the basal dietary levels, whereas the highest levels represented reinforced supplementation commonly used in nutritional studies while remaining within safe limits. The analyzed nutrient composition of the diets for the 12 treatments is shown in Table 4.
Uniform design matrix for Fe, Cu, Mn, and Zn supplementation
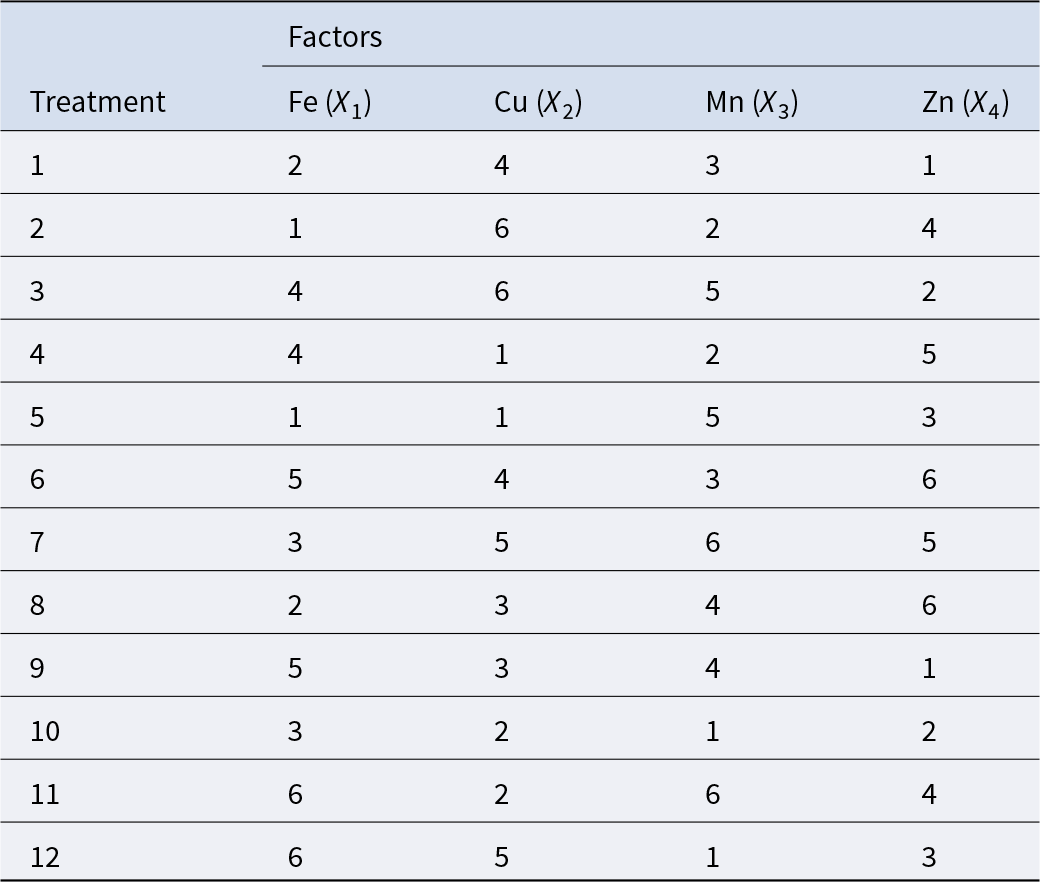
Table 2 Long description
Twelve experimental treatments specify level settings for four supplementation factors: iron, copper, manganese, and zinc, each coded from level 1 through level 6. Each treatment lists one level for each factor, creating a uniform spread of combinations rather than repeating a single pattern. Across the 12 treatments, every factor uses each level exactly twice, indicating balanced coverage of the level range. Examples include treatment 1 with all factors at level 1, treatment 6 with Fe 6, Cu 6, Mn 4, Zn 5, and treatment 9 with Fe 3, Cu 6, Mn 1, Zn 5. Zinc spans from level 1 in treatment 8 to level 6 in treatments 2 and 12, while manganese ranges from level 1 in treatment 9 to level 6 in treatments 4 and 8. The values are coded levels rather than measured outcomes, so the table supports experimental planning and comparison of factor settings, not conclusions about effects.
Note: The uniform design table U12(64) was generated using the DPS software.
Mineral supplementation levels used in the uniform design
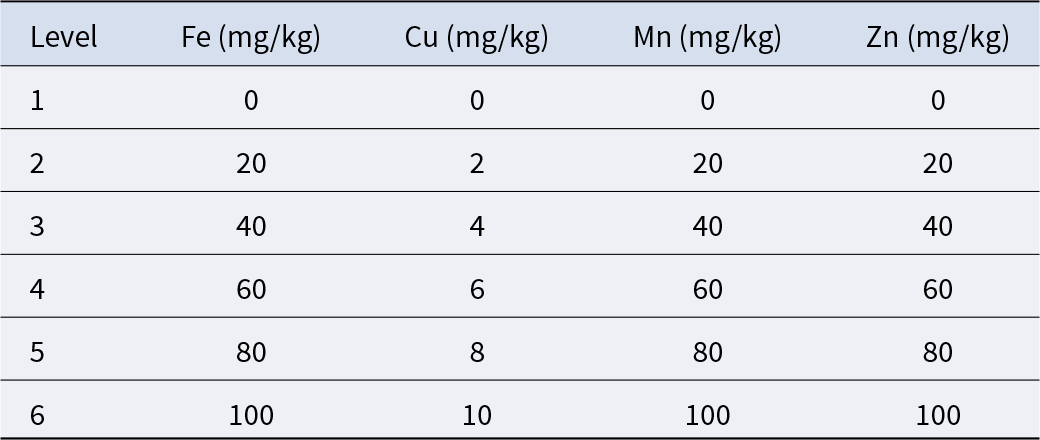
Table 3 Long description
Mineral supplementation levels are listed for iron, copper, manganese, and zinc, with amounts given in milligrams per kilogram. There are six levels, starting at level 1 with zero for all four minerals. Each higher level increases all minerals by a constant increment: iron, manganese, and zinc rise by 20 mg/kg per level, while copper rises by 2 mg/kg per level. Level 2 provides 20 mg/kg Fe, 2 mg/kg Cu, 20 mg/kg Mn, and 20 mg/kg Zn, and level 6 reaches 100 mg/kg Fe, 10 mg/kg Cu, 100 mg/kg Mn, and 100 mg/kg Zn. Iron, manganese, and zinc match each other at every level, while copper is consistently one tenth of those values. Values appear to be planned target supplementation amounts rather than measured concentrations.
Analyzed nutrient composition of the basal diet (air-dry basis)
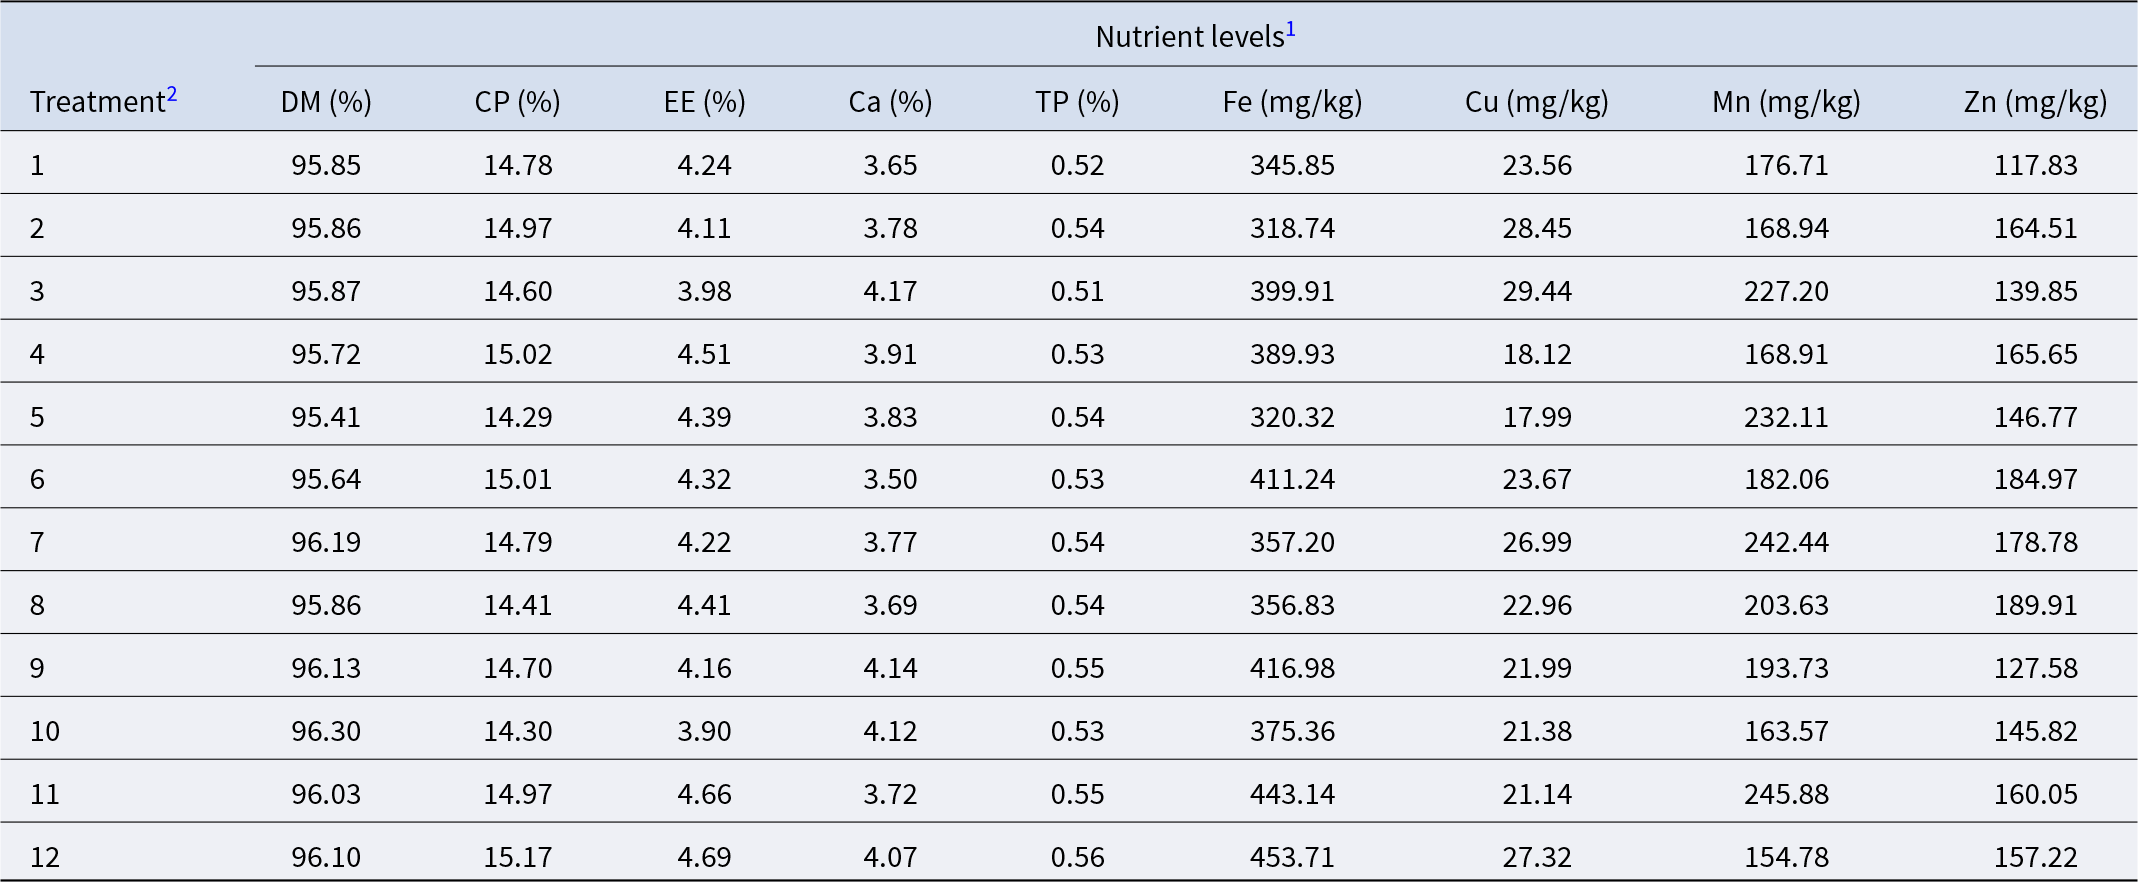
Table 4 Long description
Nutrient composition is reported for 12 diet treatments, listing dry matter, crude protein, ether extract, calcium, total phosphorus, and the trace minerals iron, copper, manganese, and zinc. Dry matter is very consistent across treatments at about 95.4 to 96.3 percent. Crude protein ranges from 14.29 to 15.17 percent, and ether extract ranges from 3.90 to 4.69 percent. Calcium varies from 3.50 to 4.17 percent, while total phosphorus stays near 0.51 to 0.56 percent. Trace minerals show the largest spread: iron ranges from 318.74 mg per kg in treatment 2 to 453.71 mg per kg in treatment 12; copper ranges from 17.99 mg per kg in treatment 5 to 29.44 mg per kg in treatment 3. Manganese ranges from 154.78 mg per kg in treatment 12 to 245.88 mg per kg in treatment 11, and zinc ranges from 117.83 mg per kg in treatment 1 to 189.91 mg per kg in treatment 8. Overall, macronutrient measures are relatively stable across treatments, while trace mineral concentrations differ notably by treatment, consistent with differing supplementation levels.
DM = dry matter; CP = crude protein; EE = ether extract; TP = total phosphorus.
1 Values in the table represent the analyzed nutrient contents of the basal diet.
Sample collection and measurements
During the formal trial period, the number of eggs collected and individual egg weights were recorded daily. Weekly measurements of remaining feed were taken to calculate the egg production rate of housed, feeding day egg production, the feed conversion ratio (FCR), average daily feed intake (ADFI) and average egg weight. At the end of weeks 2, 4, 6, 8, 10, and 12 of the trial period, two eggs were randomly selected from each replicate for egg quality evaluation.
Apparent digestibility measurements were conducted using the indicator method (0.5% chromium trioxide as an indigestible marker) for 3 consecutive days at the end of weeks 6 and 12 of the experiment. Approximately 150 g of feces were collected from each replicate group, placed in sealed bags, thoroughly mixed, and sprayed with 10% hydrochloric acid to fix nitrogen. After the collection period, fecal samples were pooled by replicate, dried at 65°C in a forced-air oven, and rehydrated for 24 h. Using the quartering method, approximately 100 g of the fecal sample was taken, pulverized and sieved through a 40-mesh screen. The sieved material was placed in sealed bags and stored in a dark, dry location for subsequent determination of routine indicators such as proximate nutrient composition, calcium and phosphorus concentrations, and trace element content.
Egg quality measurement
The length and width of eggs were routinely measured using electronic calipers to calculate the egg shape index. Eggshell color was determined using a colorimeter (CR410, Japan). Eggshell strength was measured using an eggshell strength tester (EFG-0503, Robotmation, Japan). Eggshell thickness was measured using an eggshell thickness tester (ETG-1061, Robotmation, Japan). Eggshell, yolk, and albumen weights were measured using a precision electronic balance, and their relative proportions (as a percentage of egg weight) were calculated. Yolk color, Haugh unit, and thick albumen height were measured using an egg quality analyzer (EMT-5200, Tokyo, Japan). Haugh unit was calculated as 100 × log (H + 7.57 − 1.7 • W0.37), where H is the height of the albumen (mm), and W is the weight of the egg (g) according to Haugh (Reference Haugh1937).
Determination of apparent digestibility
The contents of dry matter, CP, ether extract (EE), ash, Ca, and P in feed and feces samples were determined in accordance with national standards, namely GB/T 6435-2014, GB/T 6432-2018, GB/T 6433-2006, GB/T 6438-2007, GB/T 6436-2018, GB/T 6437-2018, and GB/T 30727-2014. The apparent digestibility of nutrients was calculated using the external indicator method, with chromium trioxide serving as the external marker, according to the following formula:
 \begin{align*}
\text{Apparent digestibility}_{\text{nutrient}} (\mathrm{\%})&= 100-100\cr
&\times \!\!({I}_{\text{Cr, Diet}} (\mathrm{\%}) / {I}_{\text{Cr, Feces}} (\mathrm{\%})) \cr
&\times \!\!({{I}}_{\text{nutrient, Feces}} (\mathrm{\%}) / {{I}}_{\text{nutrient, Diet}} (\mathrm{\%})\!)
\end{align*}
Determination of trace element excretion levels
Determination of mineral concentrations was carried out using an inductively coupled plasma atomic emission spectrometer. After the ash samples had been prepared, 10 mL of hydrochloric acid solution (1 + 1, v/v) was added while the crucible was rotated to prevent splashing, and the mixture was evaporated to near dryness. Subsequently, 5 mL of hydrochloric acid solution (1 + 1, v/v) was added to dissolve the residue. The solution was filtered through quantitative filter paper into a 50-mL volumetric flask. The crucible was rinsed, the rinse solution was transferred to the volumetric flask, and the solution was brought to volume with deionized water. Standard solutions were prepared from Fe, Cu, Zn, and Mn working standard solutions to construct calibration curves. The instrument was used to automatically generate the calibration curves, after which the samples were analyzed.
Extraction of RNA and real-time PCR analysis
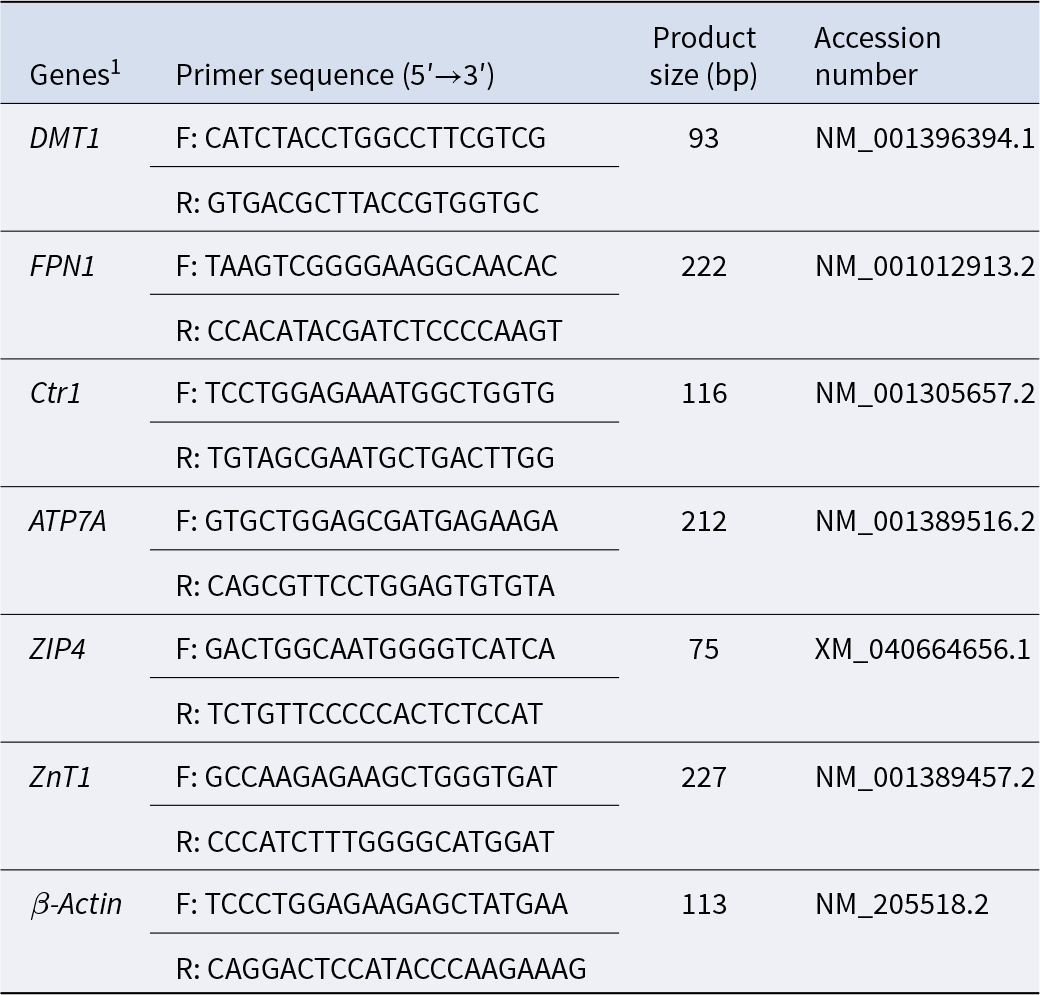
Total RNA was extracted from duodenal mucosa using the TRIzol method, and its concentration was measured with a microspectrophotometer. The RNA was then reverse-transcribed into cDNA using the HiScript III RT SuperMix (AG11701, Accurate Biology) kit. Finally, mRNA expression of DMT1, FPN1, Ctr1, ATP7A, ZIP4, ZnT1, and β-actin was quantified. Primers for the target genes were designed based on sequences obtained from the NCBI database. The expression of all target genes was calculated using 2−ΔΔCt with β-actin as the reference gene (Livak and Schmittgen Reference Livak and Schmittgen2001). The primer sequences are shown in Table 5.
Primer sequences for quantitative real-time PCR analysis

Table 5 Long description
QPCR primer information is provided for DMT1, FPN1, Ctr1, ATP7A, ZIP4, ZnT1, and the reference gene beta actin, including forward and reverse sequences, expected amplicon length, and accession number. Amplicon sizes range from 75 base pairs for ZIP4 to 227 base pairs for ZnT1. Other product sizes are 93 for DMT1, 222 for FPN1, 116 for Ctr1, 212 for ATP7A, and 113 for beta actin. Each gene entry includes one forward primer and one reverse primer written in the five prime to three prime direction. Accession identifiers are listed per target, for example NM_001396394.1 for DMT1 and NM_205518.2 for beta actin. The table is a primer reference and does not report expression levels, assay efficiency, or validation results.
DMT1 = divalent metal transporter 1; FPN1 = ferroportin 1; CTR1 = copper transport 1; ATP7A = ATPase copper transporting alpha; ZIP4 = Zrt- and Irt-like Protein 4; ZnT1 = Zinc transporter 1.
Statistical analysis
Data on production performance, egg quality, apparent digestibility, mineral excretion, and metal ion transporter expression were analyzed by one-way analysis of variance using SPSS 26.0 software, with dietary treatment as the main effect. Differences among treatment means were separated by Duncan’s multiple range test, with significance declared at P < 0.05 and trends considered at 0.05 ≤ P < 0.10.
Subsequently, all data with P < 0.05 were further subjected to quadratic polynomial stepwise regression analysis using DPS software (version 9.50) to model the response variables (Y) as a function of the supplemental levels of Fe (X₁), Cu (X₂), Mn (X₃), and Zn (X₄). The general form of the model was:
 \begin{equation*}{{Y = }}{{\beta }_{\text{0}}}{\text{ + }\Sigma }{{\beta }_{\text{i}}}{{{X}}_{\text{i}}}{\text{ + }\Sigma }{{\beta }_{{\text{ii}}}}{{X}}_{\text{1}}^{\text{2}}{\text{ + }\Sigma \Sigma }{{\beta }_{{\text{ij}}}}{{{X}}_{\text{i}}}{{{X}}_{\text{j}}}\end{equation*}
In this model, β₀ is the constant, βᵢ are linear coefficients, βᵢᵢ are quadratic coefficients, and βᵢⱼ are interaction coefficients. The coefficient of determination (R 2), adjusted correlation coefficient (Ra), the significance and partial correlation of the regression models were calculated and reported. Statistical significance was defined as P < 0.05, and highly significant correlations were defined as P < 0.01. The models were used to estimate the optimal levels of mineral supplementation.
Results
Production performance
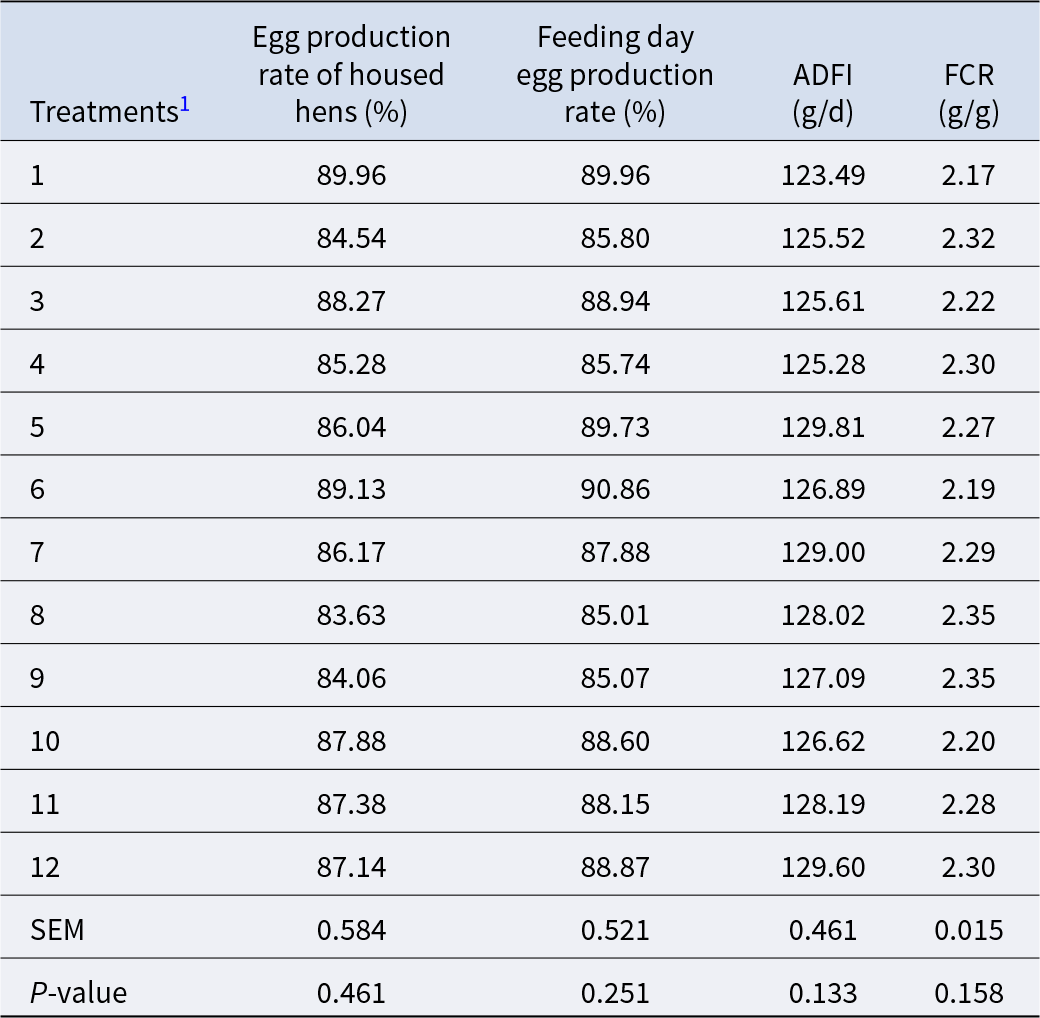
Dietary supplementation of Fe, Cu, Mn, and Zn did not have a statistically significant effect on egg production rate of housed hens, feeding day egg production rate, ADFI, or FCR in laying hens (P > 0.05; Table 6).
Effects of trace mineral combinations on production performance of laying hens fed low-protein diets

Table 6 Long description
Production performance metrics are reported for 12 trace mineral supplementation treatments in laying hens: egg production rate of housed hens, feeding day egg production rate, average daily feed intake, and feed conversion ratio. Egg production for housed hens ranges from 83.63 percent (treatment 8) to 89.96 percent (treatment 1), while feeding day egg production ranges from 85.01 percent (treatment 8) to 90.86 percent (treatment 6). Average daily feed intake spans 123.49 to 129.81 grams per day, lowest in treatment 1 and highest in treatment 5. Feed conversion ratio ranges from 2.17 (treatment 1) to 2.35 (treatments 8 and 9), indicating slightly poorer efficiency in treatments 8 and 9 compared with the best-performing group. Overall, values cluster closely across treatments, and the reported p-values for all four outcomes are above 0.05, so differences among treatments are not statistically significant in this dataset. Precision indicators are provided as standard error of the mean for each column.
ADFI = average daily feed intake; FCR = feed conversion ratio.
1 The treatment groups (1–12) correspond to different supplementation levels of trace minerals (Fe, Cu, Mn, Zn) added to the basal diet, as defined in Tables 2 and 3.
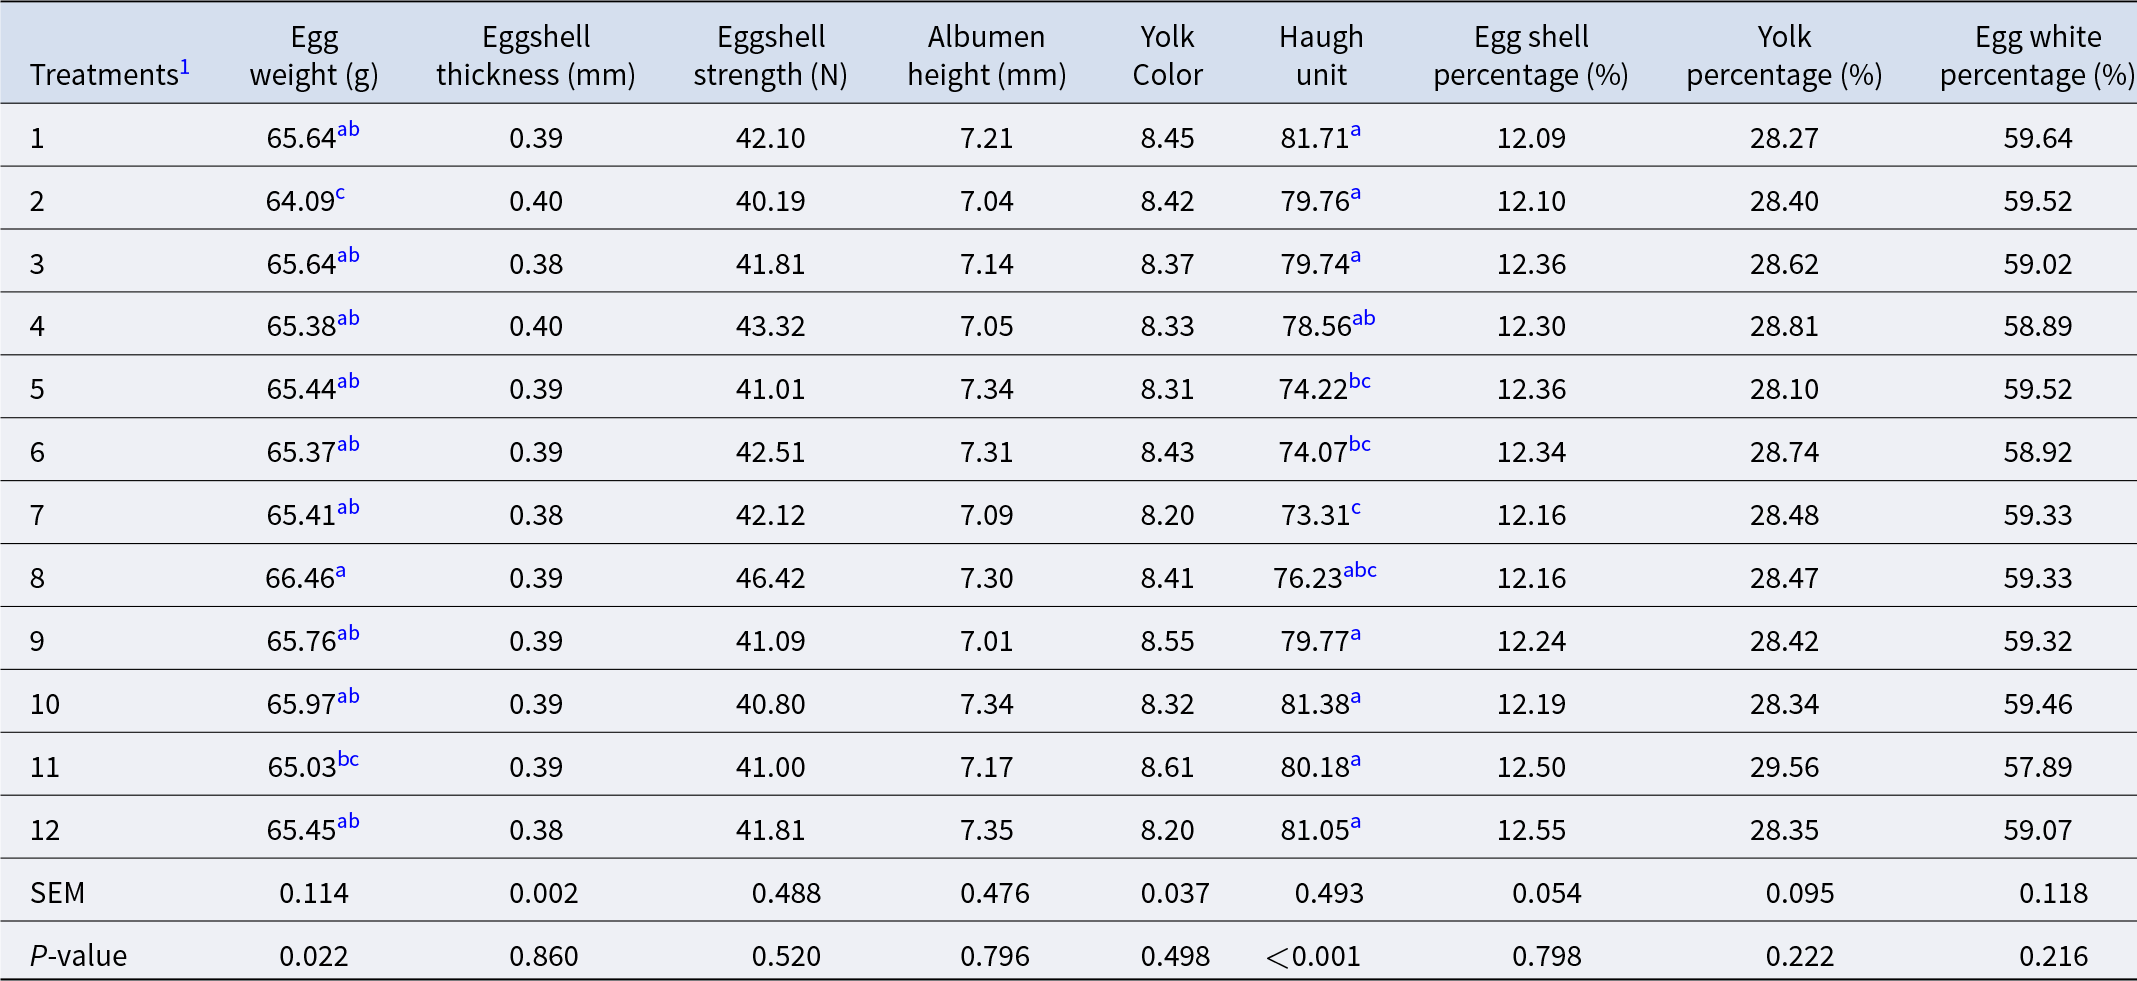
Means within a column lacking a common superscript differ (n = 7, P < 0.05).
Egg quality
No significant differences were observed among the 12 treatment groups for eggshell thickness, eggshell strength, albumen height, yolk color, eggshell-specific gravity, yolk-specific gravity, or albumen-specific gravity (P > 0.05; Table 7). Treatment group 8 exhibited a significantly higher egg weight (3.74% increase) than Treatment group 2 (P < 0.05). The Haugh unit in Treatment group 1 increased significantly by 11.5% compared to Treatment group 7 (P < 0.05). To determine the optimal conditions for the parameters, a quadratic polynomial regression was constructed with Fe (X 1), Cu (X 2), Mn (X 3), and Zn (X 4) as independent variables and egg weight and Haugh unit as response variables (Y).
Effect of different combinations of trace mineral levels on the quality of laying eggs
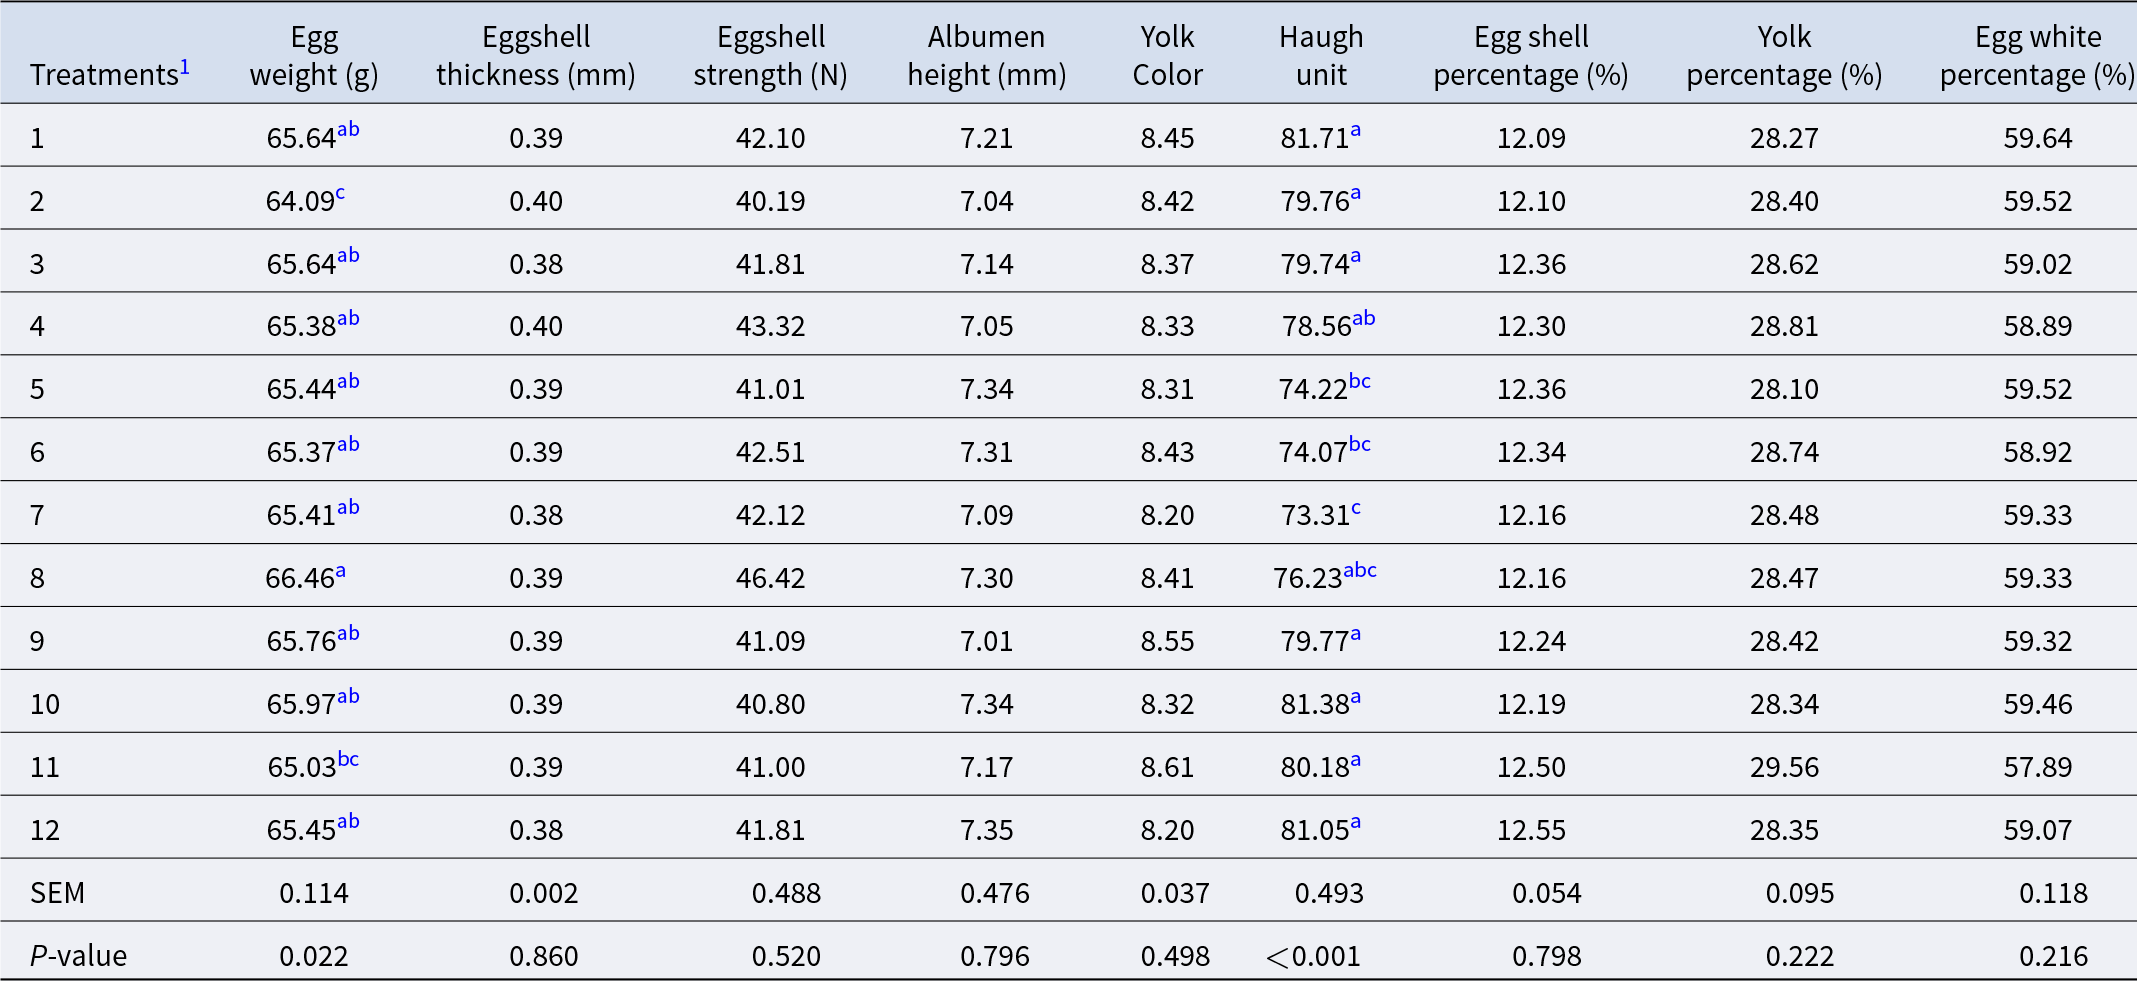
Table 7 Long description
Egg quality outcomes are compared across 12 trace-mineral supplementation treatments, reporting egg weight, shell thickness and strength, albumen height, yolk color, Haugh unit, and shell, yolk, and white percentages. Most measures were similar across treatments: egg weight stayed near 64.1 to 66.5 grams, shell thickness near 0.38 to 0.40 millimeters, and shell strength near 40.2 to 46.4 newtons. Albumen height ranged roughly 7.0 to 7.35 millimeters and yolk color about 8.2 to 8.61. Haugh unit showed the clearest treatment effect, with the highest value in treatment 1 at 81.71 and the lowest in treatment 7 at 73.31; several treatments clustered near 79.7 to 81.4. Shell, yolk, and white proportions were stable, with shell about 12.09 to 12.55 percent, yolk about 28.10 to 29.56 percent, and white about 57.89 to 59.64 percent. Statistical results indicate only Haugh unit and egg weight varied by treatment, while other traits did not show meaningful differences; letter groupings mark which treatment means differ within a column.
When egg weight is used as the response variable, the regression equation is as follows:
 \begin{align}{{Y}} &= {\text{65}}{\text{.72 - 0}}{\text{.00028}}{{{X}}_{\text{3}}}^{\text{2}}{\text{ + 0}}{\text{.0025}}{{{X}}_{\text{1}}}{{{X}}_{\text{2}}}{\text{ - 0}}{\text{.0002}}{{{X}}_{\text{1}}}{{{X}}_{\text{4}}}{\text{ - 0}}{\text{.0033}}{{{X}}_{\text{2}}}{{{X}}_{\text{4}}}\cr
&\quad{\text{ + 0}}{\text{.0053}}{{{X}}_{\text{3}}}{{{X}}_{\text{4}}}{\text{.}}\end{align}
The quadratic polynomial regression model (Equation 1) showed a good fit to the experimental data, with a coefficient of determination (R 2) of 0.8254, indicating that 82.54% of the variation in egg weight was explained by the independent variables included in the model. The adjusted correlation coefficient (Ra) was 0.8245, which was comparable to R 2, suggesting that the model was adequate without evidence of overfitting. The overall model was statistically significant, as confirmed by the F-test (F(5, 6) = 5.6709, P = 0.0283). Model diagnostics indicated a low residual standard deviation (S = 0.3189) and an acceptable Durbin–Watson statistic (d = 1.7303), suggesting satisfactory model adequacy and no serious autocorrelation of residuals.
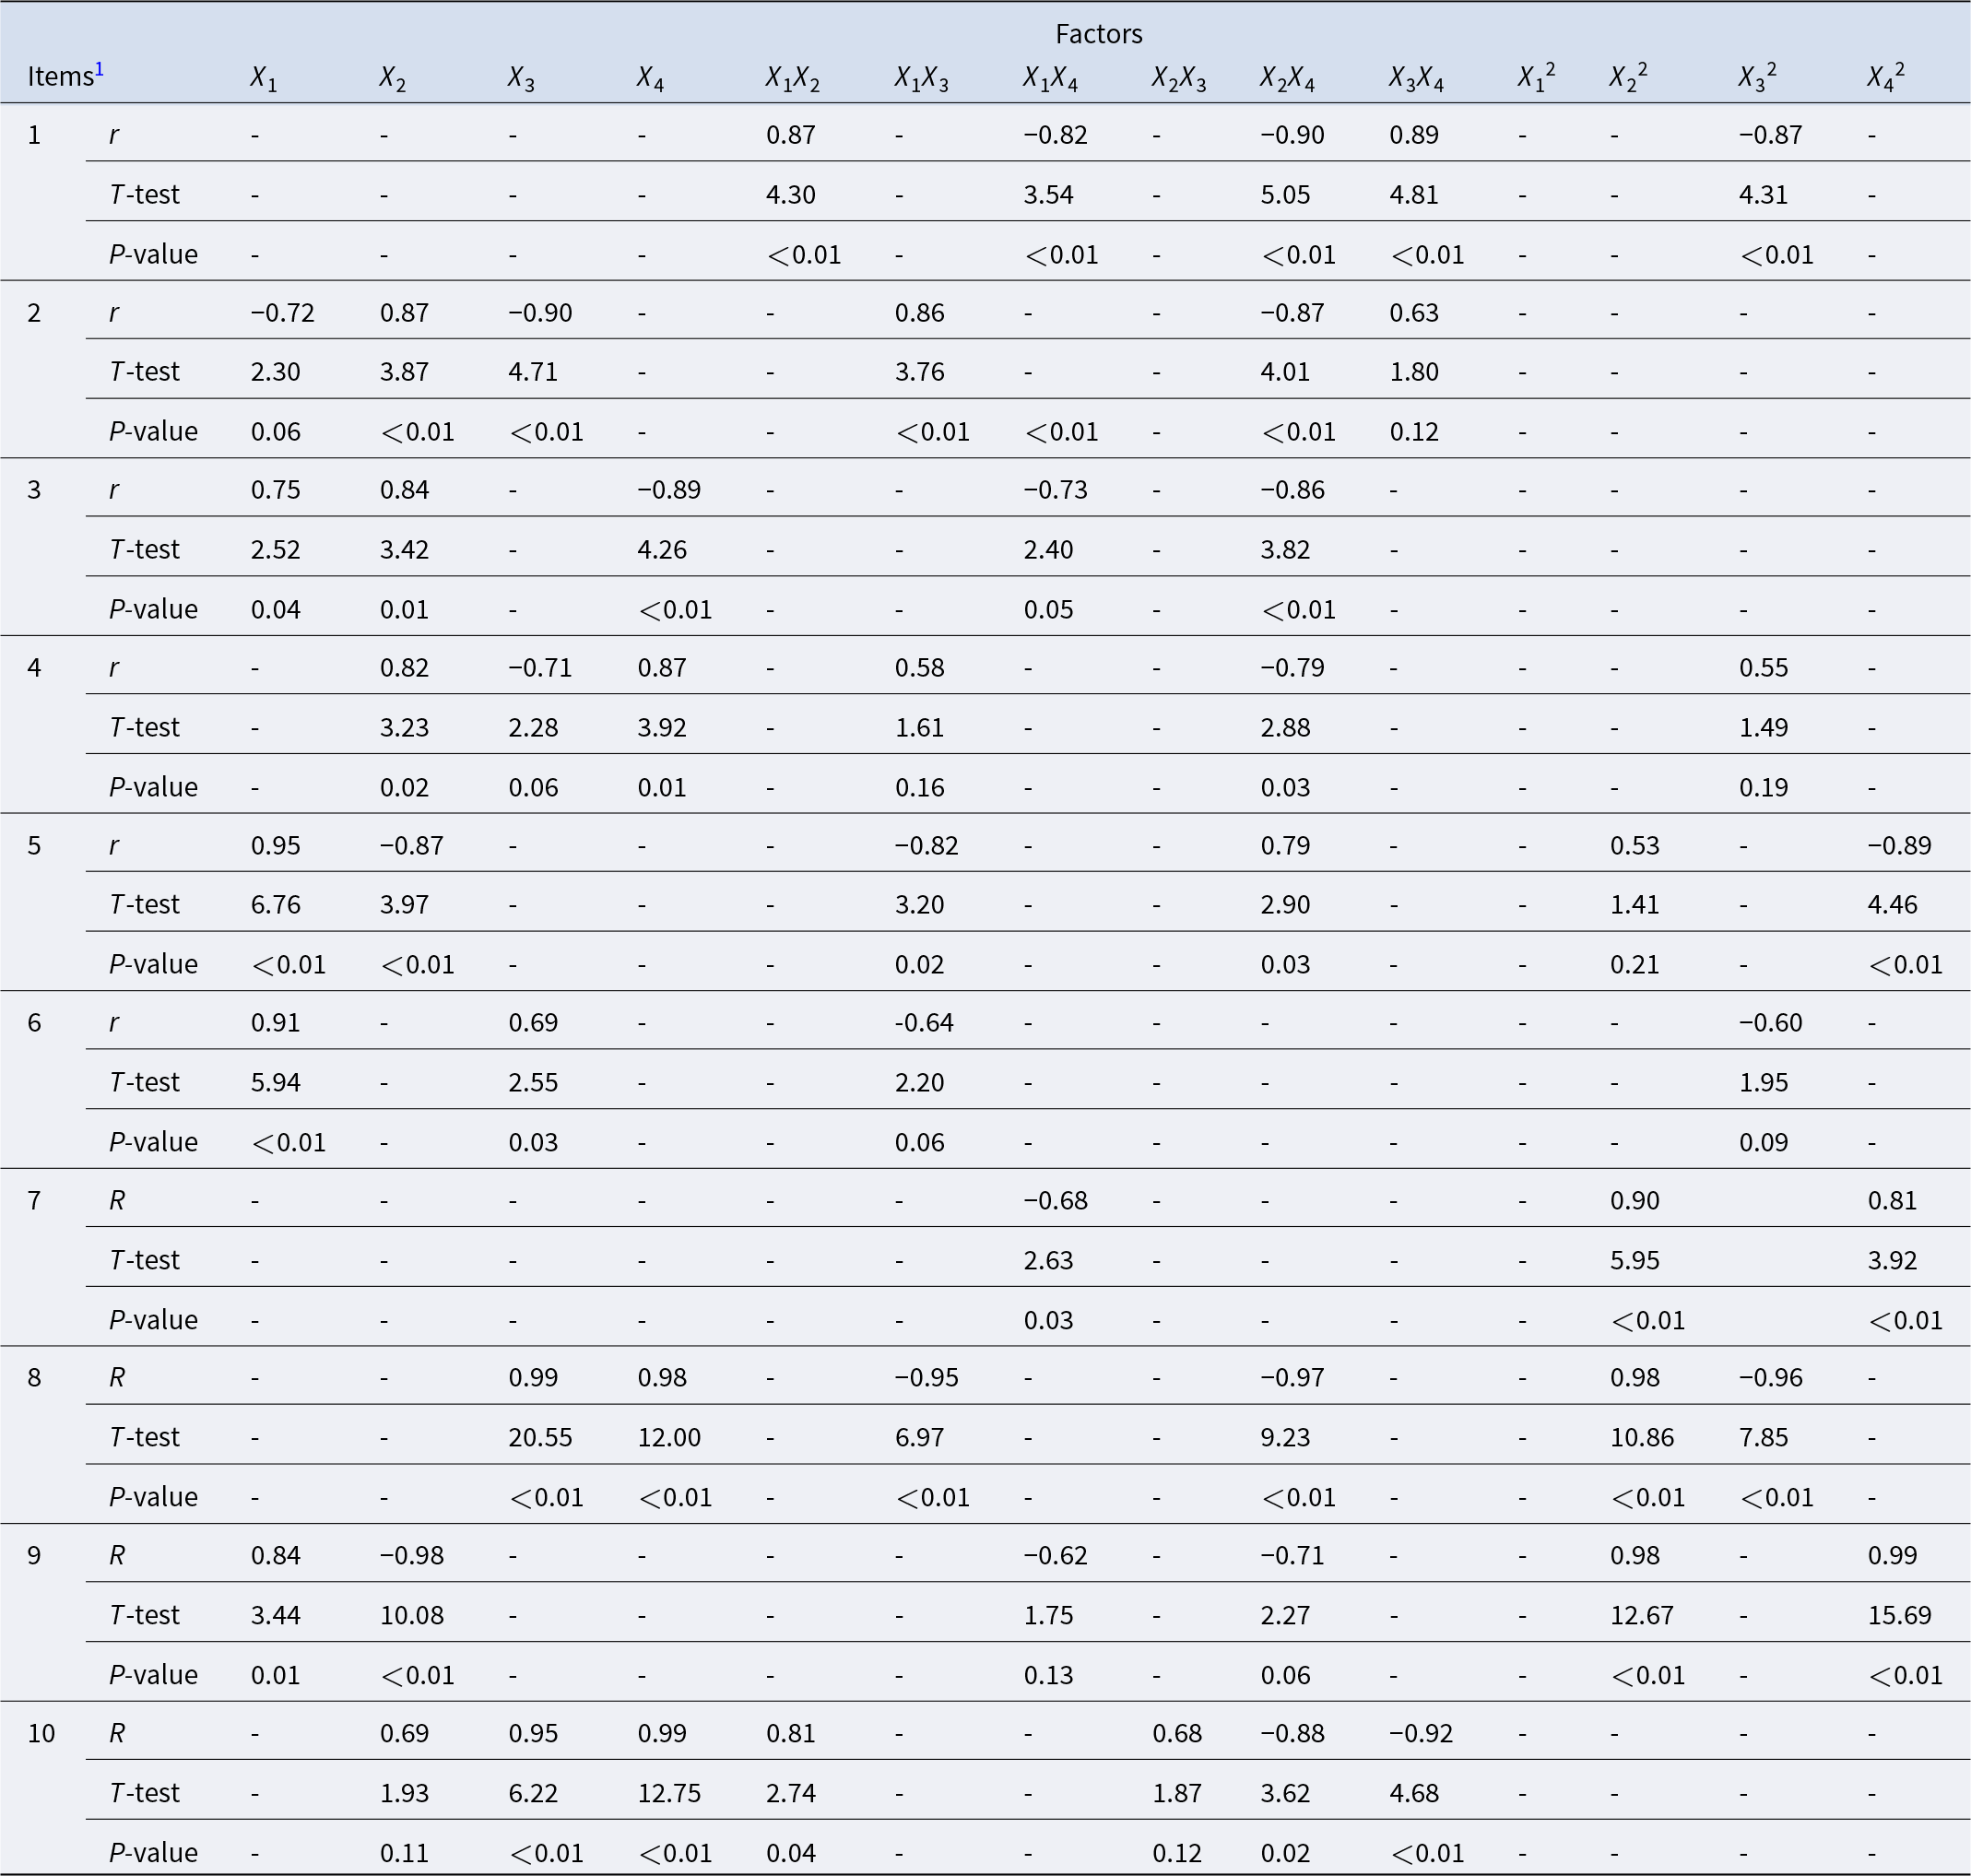
Partial correlation analysis (Table 10) revealed that the interaction term X 2X 4 exhibited a significant negative association with egg weight (P < 0.01) and was identified as the primary factor influencing egg weight. In contrast, the interaction term X 3X 4 showed a significant positive effect (P < 0.01). Additionally, the quadratic term X₃2 and the interaction terms X₁X₂ and X₁X₄ were also significant (P < 0.01), indicating the presence of nonlinear effects and complex interactions among the trace elements. Based on the established regression model, parameter optimization was conducted to determine the dietary trace element levels that maximized egg weight. The model predicted a theoretical maximum egg weight of 68.20 g when the supplementation levels of Fe, Cu, Mn, and Zn in the diet were 7.60, 0, 98.56, and 100 mg/kg, respectively.
When Haugh unit is used as the response variable, the regression equation is as follows:
 \begin{align}{{Y}} &= {\text{82}}{\text{.04 - 0}}{\text{.038}}{{{X}}_{\text{1}}}{\text{ + 0}}{\text{.88}}{{{X}}_{\text{2}}}{\text{ - 0}}{\text{.13}}{{{X}}_{\text{3}}}{\text{ + 0}}{\text{.001}}{{{X}}_{\text{1}}}{{{X}}_{\text{3}}}{\text{ - 0}}{\text{.017}}{{{X}}_{\text{2}}}{{{X}}_{\text{4}}}\cr
&\quad{\text{ + 0}}{\text{.00075}}{{{X}}_{\text{3}}}{{{X}}_{\text{4}}}\end{align}
The regression model (Equation 2) was highly significant (F(6, 5) = 13.06, P = 0.0064) and showed a good fit (R 2 = 0.9400, Ra = 0.9317), with diagnostic statistics (S = 1.11, d = 1.78) indicating that model assumptions were satisfied. Partial correlation analysis results (Table 10) revealed a highly significant negative correlation between X 3 and Haugh unit, while X 2 showed a significant positive correlation with Haugh unit (P < 0.01). Regarding interactions, X 2X 4 exhibited a significant negative effect, while X 1X 3 showed a significant positive effect (P < 0.01). The effects of variable X₁ and the interaction term X 3X 4 did not reach statistical significance (P > 0.05). Based on the established model, parameter optimization was performed. When the Fe, Cu, Mn, and Zn supplementation levels in the feed were 0.02, 10, 0.06, and 0.01 mg/kg, respectively, the Haugh unit values reached the theoretical maximum of 90.84.
Apparent digestibility
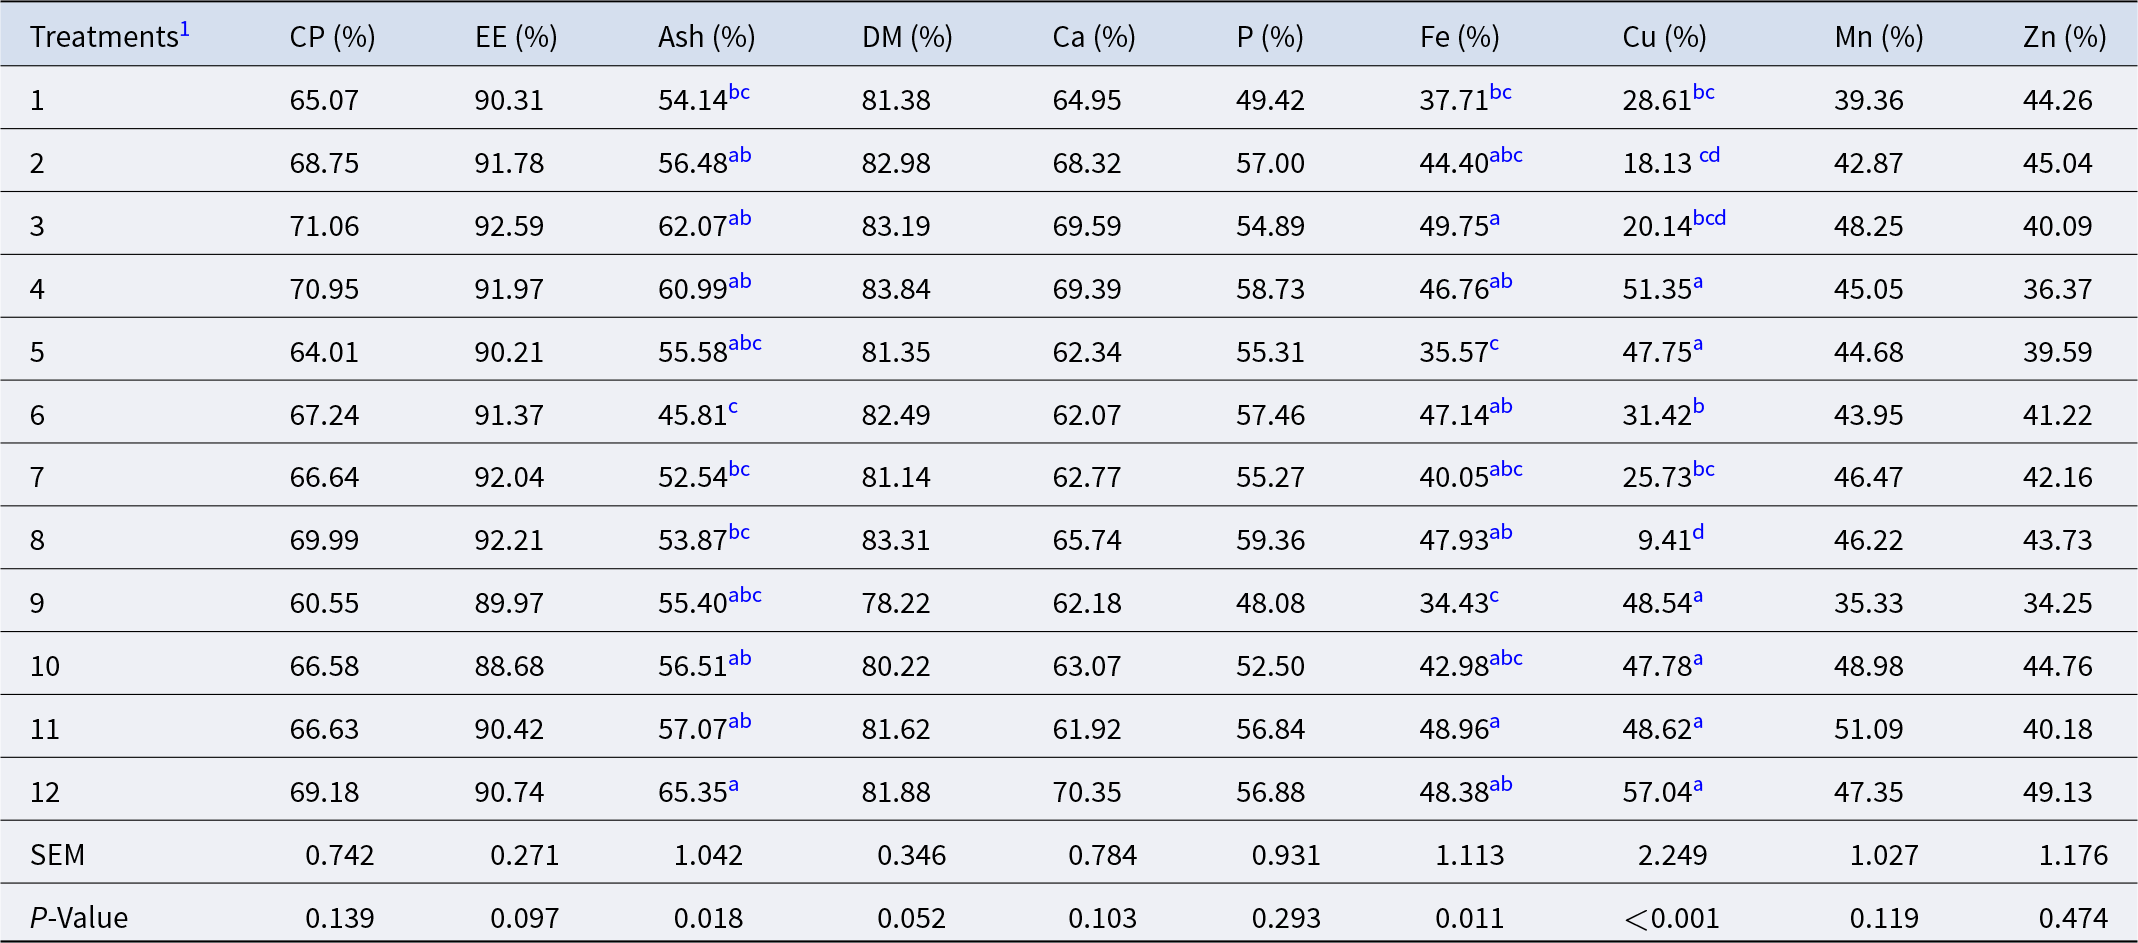
The apparent digestibility indices of major nutrients in the feed for laying hens are shown in Table 8. No significant differences were observed in the apparent digestibility of CP, Ca, P, EE, DM, Mn, Zn, Fe, and Cu among treatment groups (Table 8, P > 0.05). In contrast, the apparent digestibility of ash differed significantly among treatments (P < 0.05). Specifically, compared with Treatment group 6, Treatment group 12 increased the apparent digestibility of ash by 42.65% (P < 0.05).
The effect of different trace mineral combinations on the apparent digestibility of nutrients in laying hens

Table 8 Long description
Quadratic stepwise regression results list partial correlation coefficients, test statistics, and p-values for ten outcomes (Items I to X) across main factors, pairwise interactions, and squared terms. Item VIII shows the largest effects: very high positive correlations for factor three and factor four, and very high negative correlations for the interaction of factors three and four and for factor one with factor four; all reported tests are highly significant. Item X also has very high positive correlations for factors two and three, and strong negative correlations for the interaction of factors three and four and for the interaction of factors one and four, with most p-values below 0.01 and one interaction near 0.04. Item IX is dominated by a strong negative correlation for factor two and very strong positive correlations for the squared term of factor three and for the squared term of factor four, both highly significant, while some smaller effects are not significant. Item V shows a very strong positive correlation for factor one and a strong negative correlation for factor two, plus a strong negative correlation for the squared term of factor four, all significant, while the squared term of factor two is not significant. Items I to IV and VI to VII include fewer selected terms, mixing moderate to strong positive and negative correlations; several entries have p-values around 0.05 to 0.19, indicating weaker or non-significant contributions. Dashes indicate terms not retained or not reported for that item, so comparisons should focus on the reported coefficients and their p-values rather than assuming missing terms are zero.
CP = crude protein; EE = ether extract; ash = crude ash; DM = dry matter.
1 The treatment groups (1–12) correspond to different supplementation levels of trace minerals (Fe, Cu, Mn, Zn) added to the basal diet, as defined in Tables 2 and 3.
a–c Means in a column with no common superscript differs significantly (n = 5, P < 0.05).
When apparent digestibility of ash was used as the response variable, the regression equation was as follows:
 \begin{align}{{Y}} &= {\textrm{41}}{\textrm{.93 + 0}}{\textrm{.103}}{{{X}}_{\textrm{1}}}{\textrm{ + 1}}{\textrm{.57}}{{{X}}_{\textrm{2}}}{\textrm{ + 0}}{\textrm{.47}}{{{X}}_{\textrm{4}}}{\textrm{ - 0}}{\textrm{.0023}}{{{X}}_{\textrm{4}}^{\textrm{2}}}{\textrm{ - 0}}{\textrm{.002}}{{{X}}_{\textrm{1}}}{{{X}}_{\textrm{4}}}\cr
&\quad{\textrm{ - 0}}{\textrm{.032}}{{{X}}_{\textrm{2}}}{{{X}}_{\textrm{4}}}\end{align}
The regression model (Equation 3) was statistically significant (F(6, 5) = 8.054, P = 0.0185) and showed a good fit (R 2 = 0.9062, Ra = 0.8909), with diagnostic statistics (S = 2.27, d = 2.86) indicating acceptable model performance. Partial correlation analysis (Table 10) identified X 4 as the primary influencing factor, showing a highly significant positive correlation with ash (P < 0.01). Both X 2 and X 1 also had significant positive effects (P < 0.01). Furthermore, a highly significant negative correlation for the X 42 term revealed a pronounced nonlinear trend in its effect on ash (P < 0.01). A significant negative interaction was observed for X 2X 4 (P < 0.05), whereas the X 1X 4 interaction was not significant (P > 0.05). Based on the established model, parameter optimization was performed. The results indicated that when the feed contained Fe, Cu, Mn, and Zn at supplementation levels of 99.72, 10, 72.58, and 1.41 mg/kg, respectively, the optimal predicted value for apparent digestibility of ash was 67.91%.
When apparent digestibility of Fe was used as the response variable, the regression equation was as follows:
 \begin{align}{{Y}} &= {\text{32}}{\text{.41 + 2}}{\text{.14}}{{{X}}_{\text{2}}}{\text{ - 0}}{\text{.22}}{{
{X}}_{\text{3}}}{\text{ + 0}}{\text{.26}}{{
{X}}_{\text{4}}}{\text{ + 0}}{\text{.0015}}{{
{X}}_{\text{3}}}^{\text{2}}\cr
& \quad{\text{ + 0}}{\text{.0008}}{{\text{X}}_{\text{1}}}{\text{*}}{{{X}}_{\text{3}}}{\text{ - 0}}{\text{.035}}{{{X}}_{\text{2}}}{\text{*}}{{\text{X}}_{\text{4}}}\end{align}
The regression model (Equation 4) approached statistical significance (F(6,5) = 4.5678, P = 0.0584) and demonstrated a good fit (R 2 = 0.8457, Ra = 0.8128), with diagnostic statistics (S = 3.18, d = 3.15) suggesting potential negative autocorrelation in the residuals. Partial correlation analysis (Table 10) revealed that X 2 showed a statistically significant positive correlation (P < 0.05), ranking second in terms of influence. Regarding the interaction terms, X₂X₄ demonstrated a statistically significant negative correlation (P < 0.05). However, the interaction effects of X 3, X 4, X 1X 3, and X₃2 were not statistically significant (P > 0.05). Based on the established model, parameter optimization was performed. The results indicated that when the feed contained Fe, Cu, Mn, and Zn at supplementation levels of 42.73, 0, 0.13, and 100 mg/kg, respectively, the optimal predicted value for apparent digestibility of Fe was 58.17%.
When apparent digestibility of Cu was used as the response variable, the regression equation was as follows:
 \begin{align}{{Y}} &= {\text{52}}{\text{.25 + 0}}{\text{.37}}{{{X}}_{\text{1}}}{\text{ - 7}}{\text{.03}}{{
{X}}_{\text{2}}}{\text{ + 0}}{\text{.22}}{{{X}}_{\text{2}}}^{\text{2}}{\text{ - 0}}{\text{.004}}{{{X}}_{\text{4}}}^{\text{2}}{\text{ - 0}}{\text{.002}}{{{X}}_{\text{1}}}{\text{*}}{{{X}}_{\text{3}}}\cr
&\quad{\text{ + 0}}{\text{.045}}{{
{X}}_{\text{2}}}{\text{*}}{{
{X}}_{\text{4}}}\end{align}
The regression model (Equation 5) demonstrated excellent statistical significance (F(6,5) = 17.30, P = 0.0034) and provided an excellent fit to the data (R 2 = 0.9541, Ra = 0.8990). Diagnostic statistics (S = 2.85, d = 2.29) indicated that the model assumptions were satisfactorily met, with no evidence of residual autocorrelation. Partial correlation analysis identified X 1 as the primary influencing factor, exhibiting a highly significant positive correlation (P < 0.01). This was followed by X 42, which exhibited a highly significant negative correlation (P < 0.05). X 2 also showed a highly significant negative correlation (P < 0.01). Among interaction terms, X 1X 3 showed a significant negative correlation, whereas X 2X 4 showed a significant positive correlation (P < 0.05). The quadratic term X 22 was not significant (P > 0.05). Based on the established model, parameter optimization was performed. The results indicated that when the feed contained Fe, Cu, Mn, and Zn at supplementation levels of 99.01, 0, 0.02, and 36.23 mg/kg, respectively, the optimal predicted value for apparent digestibility of Cu was 84.16%.
Mineral excretion
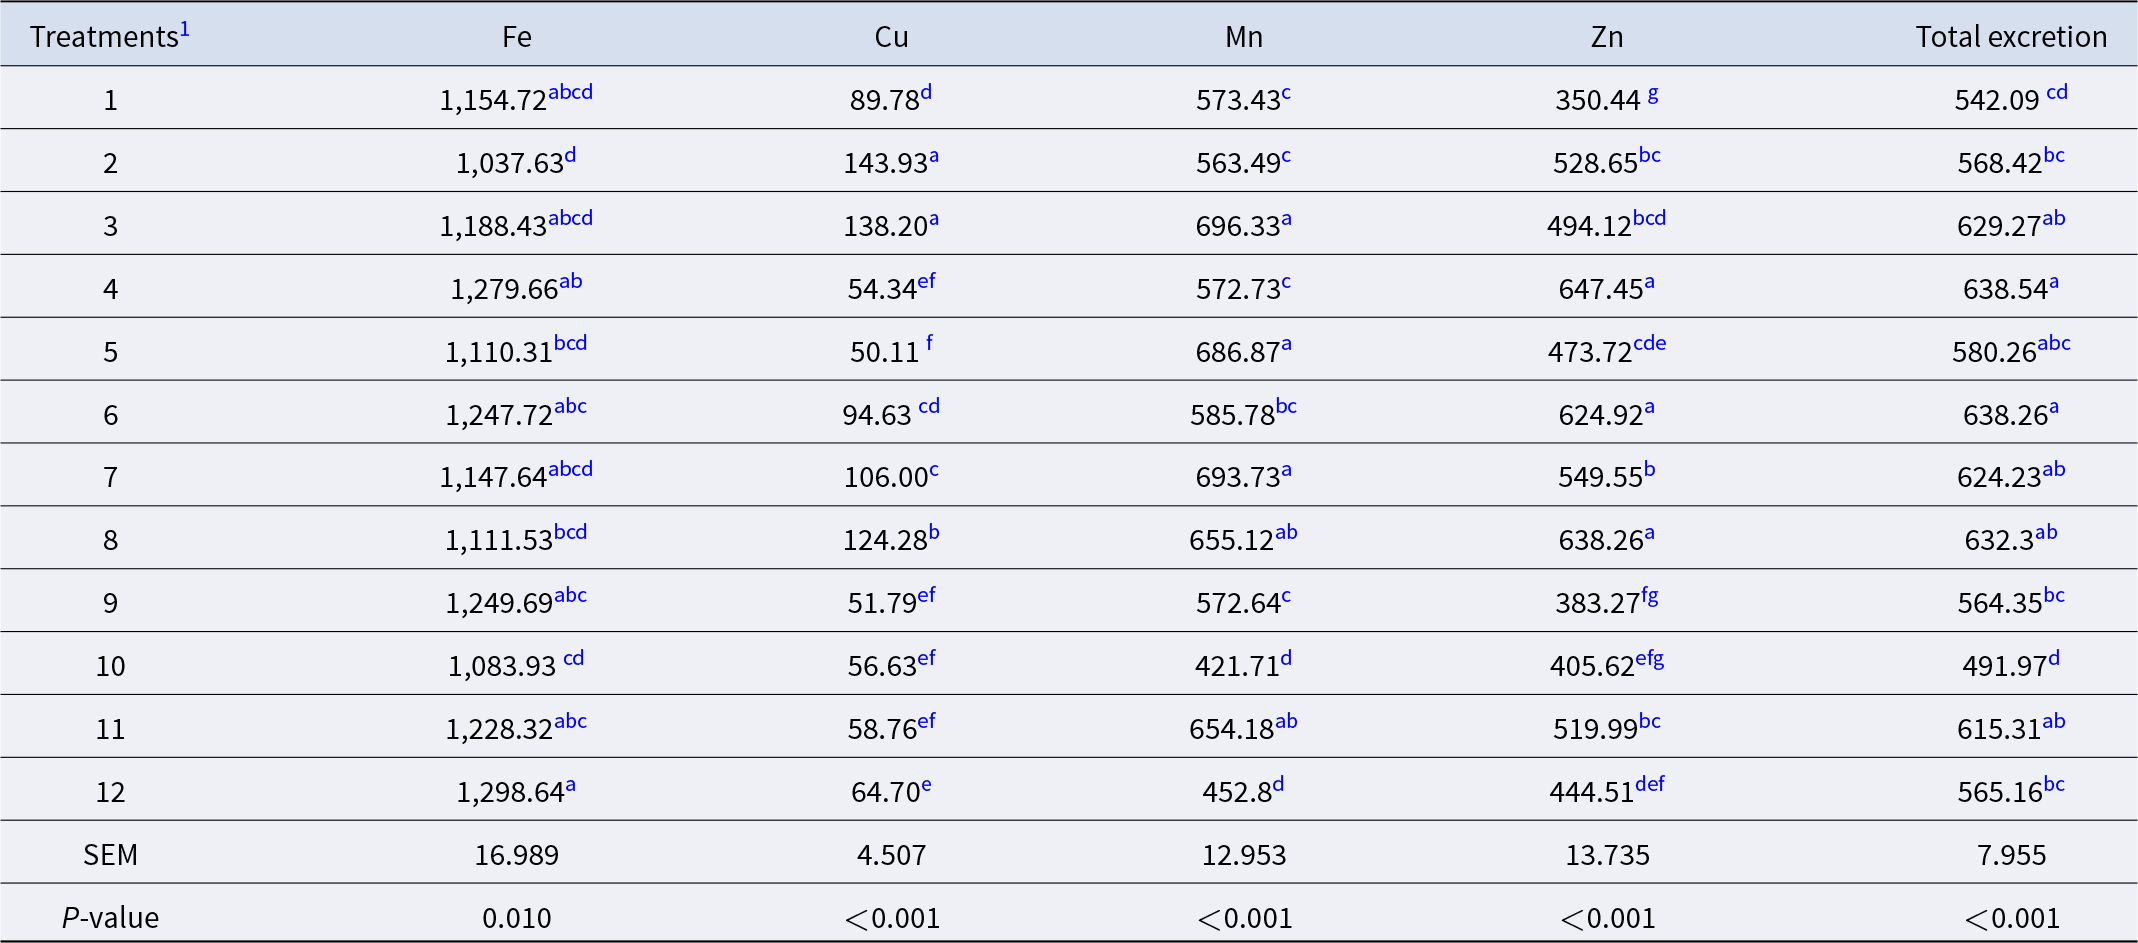
As shown in Table 9, increasing dietary Fe supplementation from 0 mg/kg (Treatment group 2) to 100 mg/kg (Treatment group 12) resulted in a 25.15% increase in fecal Fe content (P < 0.05). Similarly, when dietary Cu supplementation was increased from 0 mg/kg (Treatment group 5) to 10 mg/kg (Treatment group 2), fecal Cu content increased by 93.82% (P < 0.05). A 64.5% increase in fecal Mn (P < 0.05) was observed when dietary Mn supplementation was increased from 0 mg/kg (Treatment group 5) to 120 mg/kg (Treatment group 8), while an 82.13% increase in fecal Zn was observed when dietary Zn supplementation was increased from 0 mg/kg (Treatment group 1) to 100 mg/kg (Treatment group 8) (P < 0.05).
The influence of different trace mineral combinations on the excretion amounts of Fe, Cu, Mn, and Zn in laying hen feces (mg/kg)

Table 9 Long description
Apparent digestibility percentages are reported for crude protein, ether extract, ash, dry matter, calcium, phosphorus, and the trace minerals iron, copper, manganese, and zinc across 12 dietary treatments, with SEM and p-values. Copper shows the widest spread, from 9.41 percent in treatment 8 to 57.04 percent in treatment 12, and differs strongly among treatments (p less than 0.001). Iron digestibility also differs among treatments (p 0.011), ranging from 34.43 percent in treatment 9 to 49.75 percent in treatment 3. Ash digestibility varies significantly (p 0.018), lowest in treatment 6 at 45.81 percent and highest in treatment 12 at 65.35 percent. Crude protein and ether extract digestibility are relatively stable, about 60.55 to 71.06 percent for crude protein and 88.68 to 92.59 percent for ether extract, with no clear treatment effect by p-value. Dry matter is similar across treatments but dips in treatment 9 (78.22 percent) compared with most others near 81 to 84 percent, with a borderline p-value. Calcium and phosphorus digestibility show moderate ranges, with calcium highest in treatment 12 (70.35 percent) and phosphorus highest in treatment 8 (59.36 percent), and neither shows a significant overall difference by p-value. Manganese and zinc digestibility vary by treatment but are not statistically different overall, with manganese highest in treatment 11 (51.09 percent) and zinc highest in treatment 12 (49.13 percent). Superscript letters indicate which treatment means differ within a column, and results are based on five replicates per treatment.
1 The treatment groups (1–12) correspond to different supplementation levels of trace minerals (Fe, Cu, Mn, Zn) added to the basal diet, as defined in Tables 2 and 3.
a–f Means in a column with no common superscript differs significantly (n = 5, P < 0.05).
Total excretion represents the mean value of Fe, Cu, Mn, and Zn.
When Fe excretion was used as the response variable, the regression equation was as follows:
 \begin{equation}Y=988.56+3.15X_1+3.12X_3-0.021X_3^2-0.019X_1X_3\end{equation}
Analysis of variance indicated that the regression model (Equation 6) was highly significant (F(4,7) = 13.70, P = 0.0020). The model demonstrated a good fit (R 2 = 0.8867, Ra = 0.9067). Diagnostic statistics (S = 35.19, d = 2.09) indicated that model assumptions were satisfied, with no evidence of residual autocorrelation. Partial correlation analysis (Table 10) revealed a highly significant positive correlation between X 1 and Fe excretion, thereby identifying X 1 as the primary influencing factor (P < 0.01). X 3 was also positively correlated with Fe excretion (P < 0.01). In contrast, both the quadratic term X 32 and the interaction term X 1X 3 were negatively correlated with Fe excretion, although neither reached statistical significance (P > 0.05). Based on the optimized model parameters, Fe excretion was predicted to be minimized at 988.56 mg/kg when dietary Fe, Cu, Mn, and Zn were supplemented at 0, 8, 0, and 58 mg/kg, respectively.
When Cu excretion serves as the response variable, the regression equation is as follows:
 \begin{equation}Y = 50.67 + 0.74{X_2}^2 + 0.0062{X_4}^2 - 0.0058{X_1}{X_4}\end{equation}
Analysis of variance indicated that the regression model (Equation 7) as a whole was highly significant (F(3,8) = 17.15, P = 0.0008). The model exhibited a good fit (R 2 = 0.8654, Ra = 0.9027). Diagnostic statistics (S = 15.10, d = 2.53) indicated satisfactory model performance. Partial correlation analysis results (Table 10) showed that X 22 exhibited a highly significant positive correlation with Cu excretion, thereby identifying it as the primary factor influencing this metric (P < 0.01). X 42 also demonstrated a highly significant positive correlation with Cu excretion (P < 0.01). Concurrently, the interaction term X 1X 4 exerted a significant negative effect on Cu excretion (P < 0.01). Based on the established model, parameter optimization indicated that Cu excretion was predicted to reach a theoretical minimum of 37.34 mg/kg when dietary Fe, Cu, Mn, and Zn were supplemented at 100, 0, 98.09, and 46.69 mg/kg, respectively.
When Mn excretion was used as the response variable, the regression equation was as follows:
 \begin{align}Y &= 395.06\, +\, 4.24{X_3}\, +\, 1.32{X_4}\, +\, 1.08{X_2}^2\, -\, 0.016{X_3}^2\cr
& \quad -\, 0.0068{X_1}{X_3} -\, 0.17{X_2}{X_4}\end{align}
Analysis of variance indicated that the regression model (Equation 8) as a whole was highly significant (F(6,5) = 318.58, P < 0.0001) and exhibited an excellent fit (R 2 = 0.9974, Ra = 0.9971). Diagnostic statistics (S = 6.79, d = 1.57) indicated satisfactory model performance. Partial correlation analysis results (Table 10) revealed that X 3 and X 4 exhibited extremely significant positive correlations with Mn excretion, thereby identifying them as key factors influencing this metric (P < 0.01). Simultaneously, X 22 demonstrated a highly significant positive effect on Mn excretion (P < 0.01). Conversely, X 32, X 1X 3, and X 2X 4 all showed extremely significant negative correlations with Mn excretion, thereby indicating pronounced nonlinear relationships and interactions affecting Mn excretion (P < 0.01). Based on the established model, parameter optimization indicated that Mn excretion was predicted to reach a theoretical minimum of 395.11 mg/kg when dietary Fe, Cu, Mn, and Zn were supplemented at 37.91, 0.05, 0, and 0.03 mg/kg, respectively.
When Zn excretion was used as the response variable, the regression equation was as follows:
 \begin{align}Y &= {\text{428}}{\text{.77 + 0}}{\text{.69}}{X_{\text{1}}} - {\text{41}}{\text{.25}}{X_{\text{2}}}{\text{ + 4}}{\text{.39}}{X_{\text{2}}}^{\text{2}}{\text{ + 0}}{\text{.033}}{X_{\text{4}}}^{\text{2}}\cr
& \quad - {\text{0}}{\text{.0056}}{X_{\text{1}}}{X_{\text{4}}} - {\text{0}}{\text{.077}}{X_{\text{2}}}{X_{\text{4}}}\end{align}
Analysis of variance indicated that the regression model (Equation 9) was highly significant (F(6,5) = 165.21, P < 0.0001) and showed an excellent fit (R 2 = 0.9950, Ra = 0.9945). Diagnostic statistics (S = 10.44, d = 1.96) indicated that model assumptions were satisfied, with no evidence of residual autocorrelation. Partial correlation analysis (Table 10) revealed a highly significant negative correlation between X 2 and Zn excretion, whereas X 1 exhibited a significant positive correlation (P < 0.01). Notably, both the quadratic terms X 22 and X 42 were highly significant and positively correlated with Zn excretion, suggesting pronounced nonlinear effects of these factors (P < 0.01). In contrast, the interaction terms X 1X 4 and X 2X 4 were not statistically significant (P > 0.05). Based on the optimized model parameters, Zn excretion was predicted to reach a theoretical minimum of 330.94 mg/kg when dietary Fe, Cu, Mn, and Zn were supplemented at 0, 4.82, 30.87, and 5.49 mg/kg, respectively.
Results of quadratic polynomial stepwise regression

Table 10 Long description
Fecal excretion amounts for iron, copper, manganese, zinc, and their combined total are reported for 12 dietary trace-mineral treatments in laying hens, in milligrams per kilogram. Iron ranges from about 1038 in treatment 2 (lowest) to about 1299 in treatment 12 (highest). Copper shows the widest spread, from about 50 in treatment 5 (lowest) to about 144 in treatment 2 (highest), with treatments 3 also high at about 138. Manganese is lowest in treatment 10 at about 422 and highest in treatment 3 at about 696, with treatments 5 and 7 similarly high near 687 to 694. Zinc is lowest in treatment 1 at about 350 and highest in treatment 4 at about 647, with treatments 6 and 8 also high near 625 to 638. Total excretion is lowest in treatment 10 at about 492 and highest in treatments 4 and 6 at about 639, with several others clustered around 615 to 632. Reported p-values indicate statistically significant treatment effects for all minerals and the total, and letter groupings mark which treatment means differ within each column.
Abbreviations: r = partial correlation coefficient.
1 Items 1–10, respectively, represent the equation of egg weight, Haugh unit, apparent digestibility of Ash, Fe and Cu, Fe, Cu, Mn, and Zn excretion, and total excretion.
When total excretion was used as the response variable, the regression equation was as follows:
 \begin{align}Y &= {\text{444}}{\text{.40 + 4}}{\text{.99}}{X_{\text{2}}}{\text{ + 1}}{\text{.23}}{X_{\text{3}}}{\text{ + 2}}{\text{.39}}{X_{\text{4}}}{\text{ + 0}}{\text{.032}}{X_{\text{1}}}{X_{\text{2}}}\cr
&\quad{\text{ + 0}}{\text{.039}}{X_{\text{2}}}{X_{\text{3}}} - {\text{0}}{\text{.13}}{X_{\text{2}}}{X_{\text{4}}} - {\text{0}}{\text{.017}}{X_{\text{3}}}{X_{\text{4}}}_{}^{}\end{align}
Analysis of variance indicated that the regression model (Equation 10) was highly significant (F(7,4) = 48.20, P = 0.0011) and showed an excellent fit (R 2 = 0.9883, Ra = 0.9838). Diagnostic statistics (S = 8.31, d = 2.75) suggested generally acceptable model performance, although slight negative autocorrelation may be present. Partial correlation analysis (Table 10) revealed that X 4 had a highly significant positive correlation with total excretion, thereby identifying it as the primary influencing factor (P < 0.01). X 3 also exhibited a highly significant positive correlation (P < 0.01). Among the interaction terms, both X 3X 4 and X 2X 4 were significantly negatively correlated with total excretion, whereas X 1X 2 was significantly positively correlated (P < 0.01). In contrast, neither X 2 nor the interaction term X 2X 3 had a statistically significant effect (P > 0.05). Based on the fitted model, parameter optimization indicated that the theoretical minimum total excretion of 444.40 mg/kg was predicted to be achieved when dietary Fe, Cu, Mn, and Zn were supplemented at 32.78, 0, 0, and 0 mg/kg, respectively.
Metal ion transporter
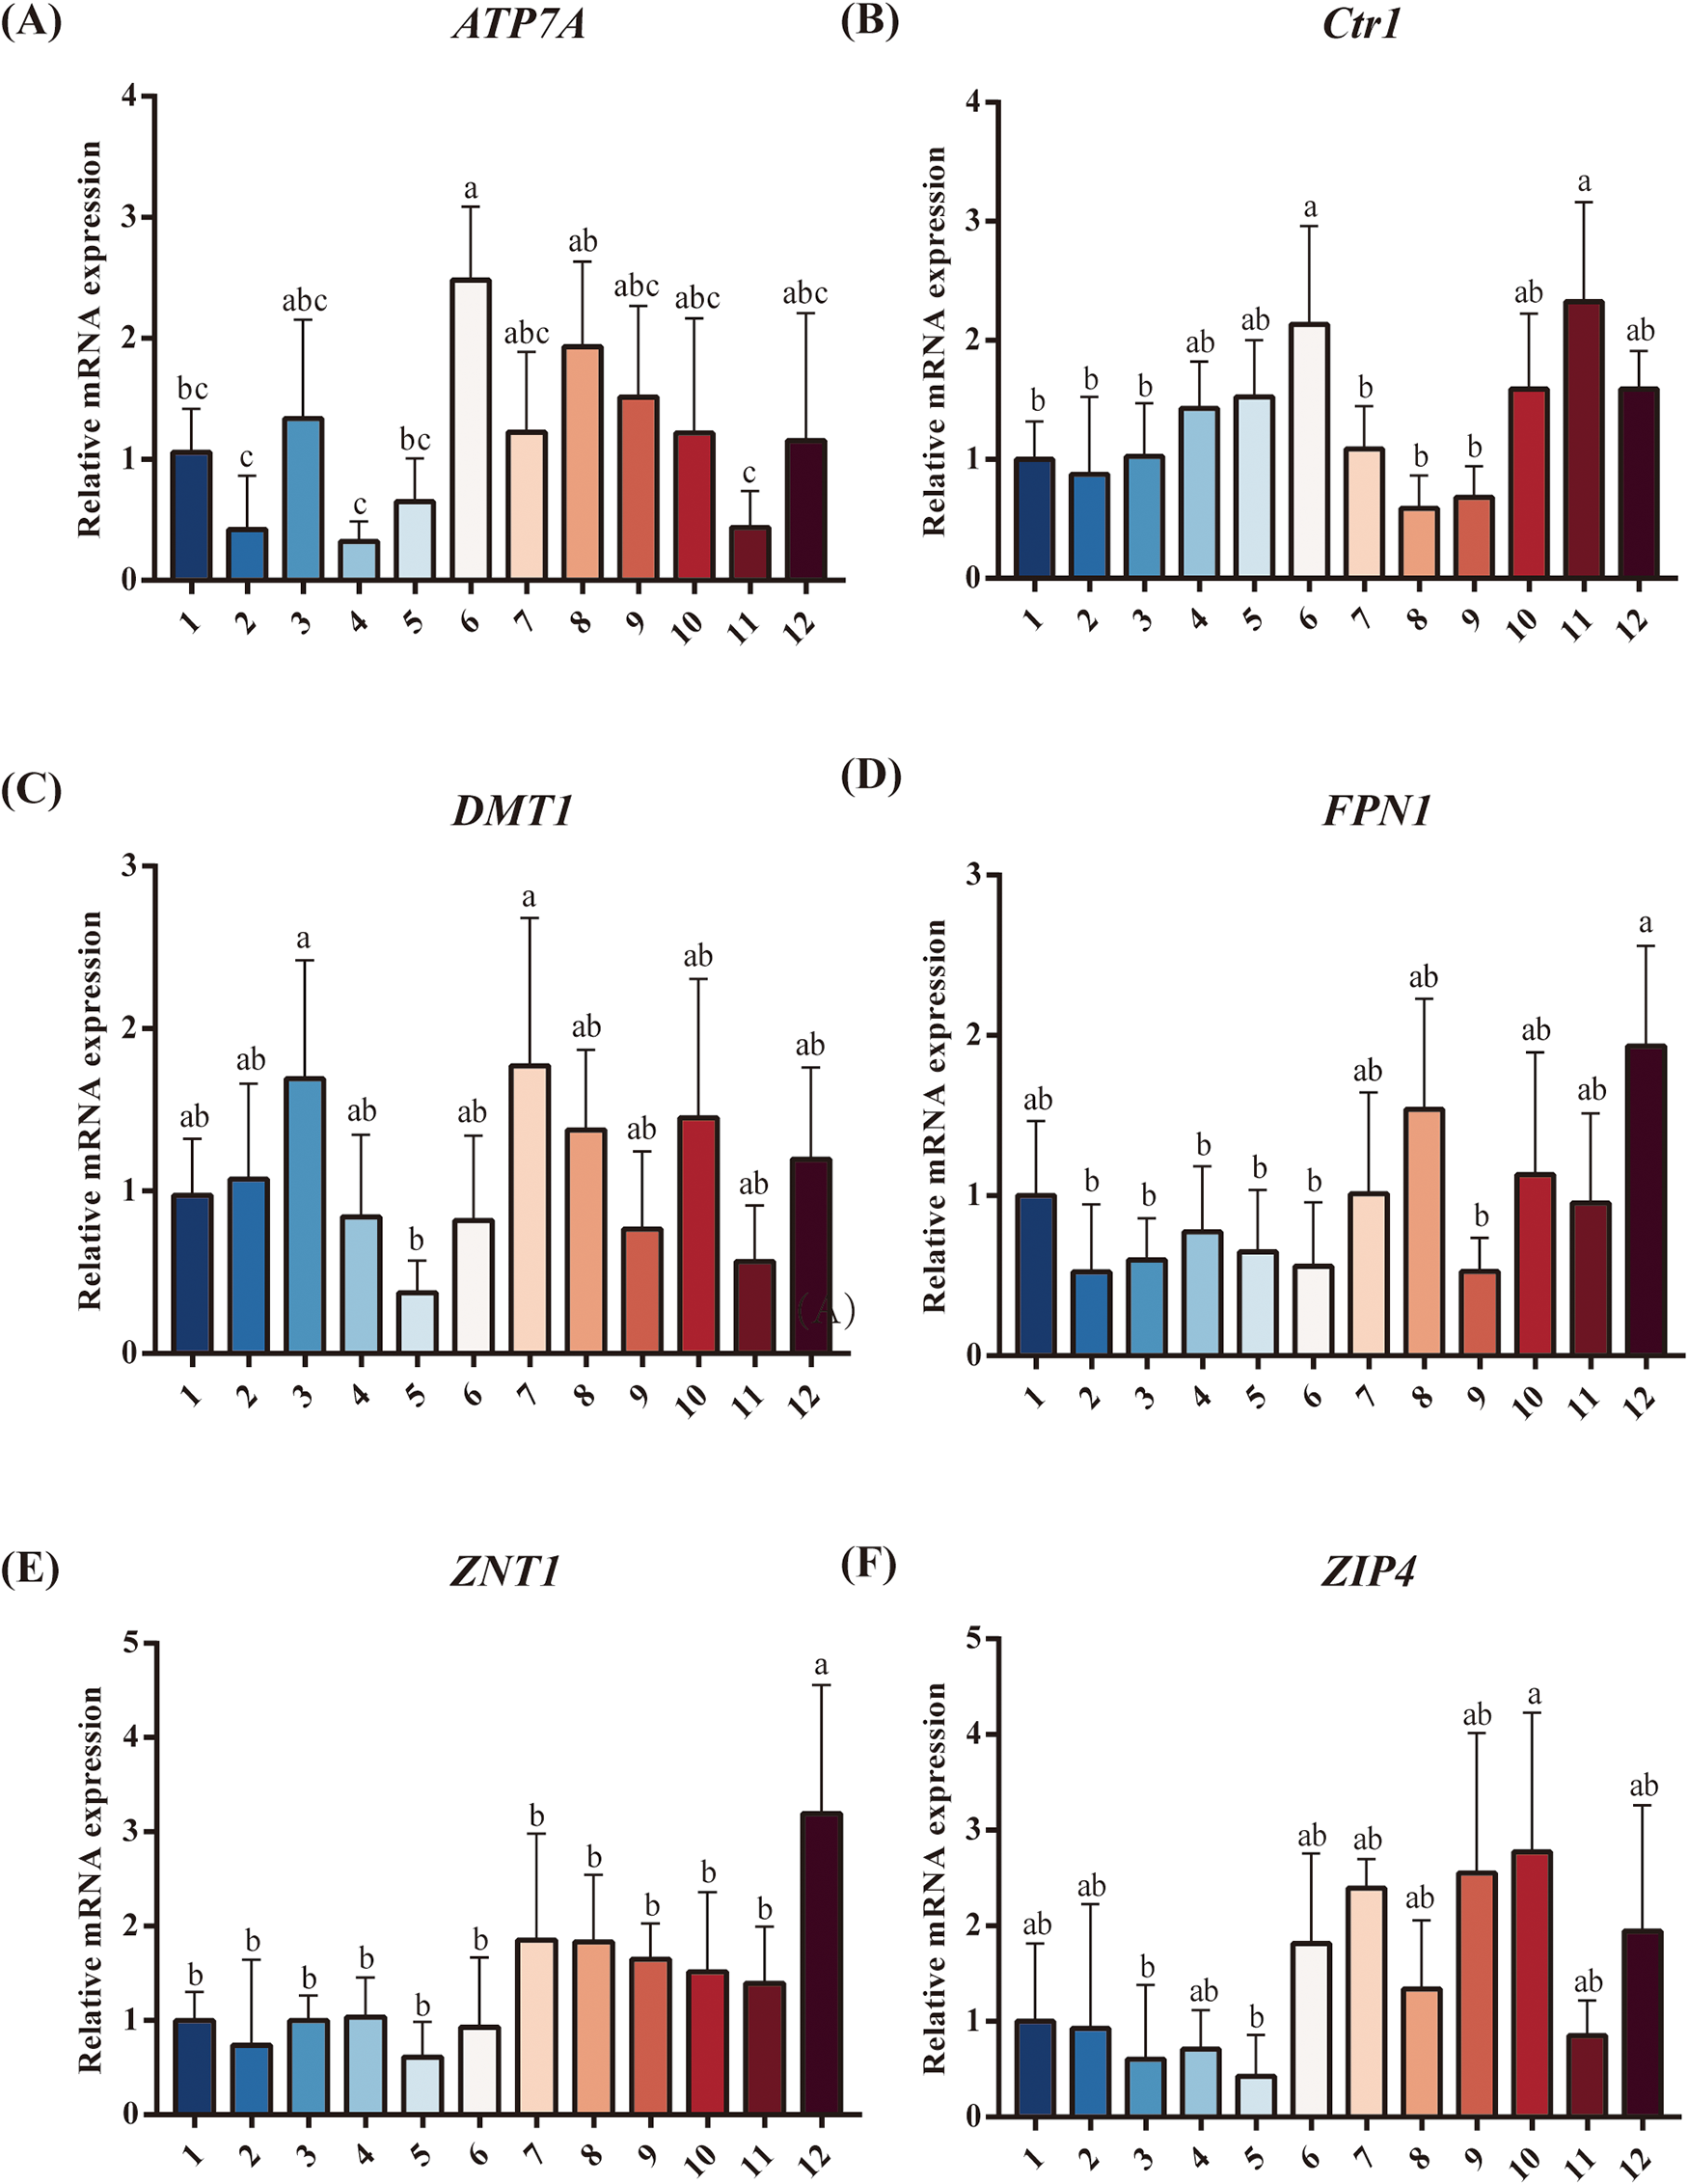
Under a LP diet, the expression levels of duodenal metal ion transporters in the 12 treatment groups were evaluated and are presented in Figure 1. The relative mRNA expression of ATP7A in Treatment groups 6 and 8 was significantly higher than that in Treatment groups 2, 4, and 11 (P < 0.05, Figure 1A). The relative mRNA expression of Ctr1 in Treatment groups 6 and 11 was significantly higher than that in Treatment groups 1, 2, 3, 7, 8, and 9 (P < 0.05, Figure 1B). The relative mRNA expression of DMT1 in Treatment groups 3 and 7 was significantly higher than that in Treatment group 5 (P < 0.05, Figure 1C). The relative mRNA expression levels of FPN1 and ZIP4 in Treatment group 12 were significantly higher than those in Treatment groups 2, 3, 4, 5, 6, and 9 (P < 0.05, Figure 1D, F). The relative mRNA expression of ZNT1 in Treatment group 12 was significantly higher than that in all other treatment groups (P < 0.05, Figure 1E).
Effects of different mineral element combinations on duodenal metal transporter mRNA expression in laying hens. (A) The relative mRNA expression of ATP7A, (B) Ctr1, (C) DMT1, (D) FPN1, (E) ZNT1, and (F) ZIP4.

Figure 1 Long description
Six bar graphs compare the relative mRNA expression of different metal transporters across 12 treatment groups. Each graph has the vertical axis labeled as Relative mRNA expression. The horizontal axis shows groups 1 to 12. Statistical significance is indicated by letter annotations above the bars. Graph A shows ATP7A expression, with groups 6 and 8 having the highest expression levels. Graph B shows Ctr1 expression, with groups 6 and 11 having the highest levels. Graph C shows DMT1 expression, with groups 3 and 7 having the highest levels. Graph D shows FPN1 expression, with group 12 having the highest level. Graph E shows ZNT1 expression, with group 12 having the highest level. Graph F shows ZIP4 expression, with group 12 having the highest level. Bars are color-coded to differentiate groups and error bars indicate variability. Key patterns include higher expression in specific groups for each transporter, highlighting differences in mRNA expression across treatments.
Discussion
Trace elements, including Fe, Cu, Mn, and Zn, are involved in numerous critical biochemical reactions and serve as essential nutrients for maintaining animal health (Sun et al. Reference Sun, Ma and Liu2022). Imbalanced mineral supplementation not only leads to inefficient utilization of mineral resources but also imposes substantial environmental burdens through increased excretion (Bao et al. Reference Bao, Choct and Iji2010). With the growing adoption of LP diets in poultry production, conventional trace minerals supplementation strategies – largely developed under normal protein conditions – may no longer be optimal. Therefore, under LP dietary regimes, precise regulation of trace element supply is critical to balancing production performance, egg quality, apparent digestibility, and mineral excretion. This study employed a uniform design to evaluate the combined effects of multiple trace elements within an integrated experimental framework. It should be noted that the primary objective of the regression models was to identify key influencing factors and to approximate optimal supplementation strategies within the experimental range, rather than to develop highly generalized predictive models.
Previous studies have indicated that supplementation with 100–200 mg/kg of inorganic or organic Fe in a basal diet containing 14.23% CP did not alter the production performance of 60-week-old Hy-Line Brown laying hens (Kim et al. Reference Kim, Kim and Kwon2023). Increasing Zn supplementation in the diet of Golden Montserrat laying hens from 0 to 150 mg/kg of inorganic or organic Zn significantly increased egg Zn concentration while not adversely affecting egg production (Bahakaim et al. Reference Bahakaim, Abdel Magied and Osman2014). Proportional additions of Fe, Cu, Mn, and Zn to the basal diets of Hy-Line Brown layers at different growth stages (1–6, 7–12, and 13–18 weeks) have been used to balance trace element levels in the feed. Results showed that there were no statistically significant differences in feed intake, final body weight, or tibia length among groups throughout the experiment, although protein metabolism capacity was improved (Zhong et al. Reference Zhong, Yao and Cheng2007). In this study, supplementing a 15% CP basal diet with different levels of Fe, Cu, Mn, and Zn did not result in significant differences in egg production rate, average daily gain, or feed-to-egg ratio among the groups. These findings indicate that, when trace element supply is essentially sufficient to meet the production needs of laying hens, the sensitivity of livestock and poultry production performance to variations in trace element supply is relatively low (Bao et al. Reference Bao, Choct and Iji2010).
Numerous studies have investigated the effects of trace minerals supplementation in poultry diets on egg quality (Bahakaim et al. Reference Bahakaim, Abdel Magied and Osman2014, Kim et al. Reference Kim, Kim and Kwon2023). The results of this experiment indicated that egg weight was maximized when Fe, Cu, Mn, and Zn were supplemented at levels of 20, 4, 60, and 100 mg/kg, respectively, in a basal diet containing 15% CP. Conversely, egg weight was minimized when these elements were supplemented at 0, 10, 20, and 60 mg/kg, respectively, in the same basal diet. Simultaneously, through equation I and partial correlation results, we observed a highly significant negative correlation in the Cu × Zn interaction term. This finding is consistent with our observations for metal ion transporter expression, where high Zn supplementation (Treatment groups 2 and 4) downregulated Cu transporter expression (CTR1 and ATP7A) in the duodenum. Since intestinal Cu absorption relies on the coordinated functions of Ctr1 for uptake and ATP7A for systemic export, their downregulation impairs this critical pathway (Hung et al. Reference Hung, Suzuki and Yamaguchi1997; Petris et al. Reference Petris, Mercer and Culvenor1996). Consequently, optimizing production parameters like egg weight requires careful consideration of the balance between dietary Cu and Zn levels. Additionally, the Mn × Zn interaction term exhibited a significant positive correlation with egg weight. Research indicates that both Mn and Zn are essential components of multiple dehydrogenases and carboxypeptidases, jointly contributing to energy metabolism (McCall et al. Reference McCall, Huang and Fierke2000; Rozenberg et al. Reference Rozenberg, Kamynina and Sorokin2022). Therefore, adequate levels of Mn and Zn may exert synergistic effects on carbohydrate metabolism, which could contribute to improved energy availability for follicular protein synthesis and, consequently, increased egg weight. Haugh unit serve as a crucial indicator for assessing egg freshness and intrinsic quality; higher values indicate more viscous albumen, greater freshness, and superior quality (Wei et al. Reference Wei, Yang and Zhang2022). This study found that Haugh unit was lowest when Fe, Cu, Mn, and Zn were supplemented at 40, 8, 100, and 80 mg/kg, respectively, and highest when they were supplemented at 20, 6, 40, and 0 mg/kg, respectively. Bahakaim et al. (Reference Bahakaim, Abdel Magied and Osman2014) demonstrated that Haugh unit decreased with increasing dietary Zn supplementation, which appears to contradict the findings of this study and may be related to interactions among the elements. Simultaneously, through equation II, a significant negative correlation between the Cu × Zn interaction effect and Haugh unit was observed. Related studies have also found that high Zn intake inhibits Cu absorption, reducing its entry into the bloodstream and leading to Cu deficiency (Peters Reference Peters2006). This interaction may partially explain the observed changes in Haugh unit with increasing Zn supplementation. Kim et al. (Reference Kim, Kim and Kwon2023) observed that increasing inorganic Fe supplementation from 100 to 200 mg/kg in a basal diet with 14.23% CP was associated with a reduction in Haugh unit, consistent with the findings of this study. These results suggest that, under LP conditions, excessive trace minerals supplementation may interfere with protein metabolism, thereby influencing albumen viscosity. However, the specific mechanisms underlying this relationship still require further investigation.
Apparent digestibility, as a key indicator of feed nutrient absorption efficiency, has a decisive impact on FCR and egg quality (Liu et al. Reference Liu, Liu and Li2007). Numerous studies have indicated that trace element type and supplementation level influence apparent nutrient digestibility throughout the gut (Liu et al. Reference Liu, Liu and Chen2016). For example, supplementation with Cu methionine in a basal diet containing 19.3% CP has been shown to enhance broilers’ apparent digestibility of EE and gross energy (Wu et al. Reference Wu, Dai and Hua2019). In this trial, different trace element combinations significantly altered the apparent digestibility of ash. Using quadratic polynomial stepwise regression (Equations 3–5), the interaction between Cu × Zn was found to significantly affect the apparent digestibility of ash, Fe and Cu. This effect warrants particular attention in the specific context of LP diets and may be related to changes in digestive enzyme activity under such conditions. Multiple digestive enzymes secreted by the pancreas (e.g., carboxypeptidase and amylase) are Zn-dependent enzymes, while Cu is a key component of respiratory chain enzymes such as cytochrome c oxidase (Bittner et al. Reference Bittner, Kraus and Schäkermann2017). Under LP conditions, amino acid resources available for synthesizing digestive enzymes and renewing intestinal mucosa become relatively scarce. This amplifies the importance of balanced Zn and Cu supplementation – critical cofactors for enzymes – and magnifies the impact of their interactions on nutrient digestibility (Ketata et al. Reference Ketata, Guay and Létourneau-montminy2022; Sans et al. Reference Sans, Crozier and Vogel2021). Zn transporters ZnT1 and ZIP4 play vital roles in maintaining cellular Zn homeostasis (Li et al. Reference Li, Gong and Wang2019). In intestinal Fe and Mn metabolism, DMT1 mediates the absorption of dietary divalent metal ions across the apical membrane of intestinal cells, while FPN1 performs the core function of their efflux from the basolateral membrane into the bloodstream. Together, they form the key pathway for Fe absorption (Hentze et al. Reference Hentze, Muckenthaler and Galy2010). Our research indicates that when diets are severely deficient in Fe and Cu and contain high Mn (0, 0, 80, 40 mg/kg), the gene expression of ZIP4, ZnT1, DMT1, and FPN1 is significantly suppressed. This may lead to marked impairment in the absorption and utilization processes of Zn and Mn, even when dietary levels are adequate. Consequently, Zn may be insufficient to fully support its physiological roles as a cofactor for digestive enzymes. When trace elements were relatively balanced (100, 8, 0, 40 mg/kg), the mRNA expression of ZIP4, ZnT1, DMT1, and FPN1 was significantly highest. Therefore, especially in LP diets, the appropriate ratio of trace elements plays an important role in optimizing nutrient digestibility and alleviating the potential adverse effects of protein restriction (Yin et al. Reference Yin, Zhai and Lu2022). Additionally, the decline in apparent ash digestibility may directly stem from competition and antagonism between Cu and Zn during absorption, leading to increased excretion of unabsorbed minerals in feces. In contrast, adding different combinations of Fe, Cu, Mn, and Zn did not significantly alter the apparent digestibility of CP. This suggests that at current LP levels, proteinase synthesis is not severely constrained, or that trace elements exert their effects primarily through energy and mineral metabolism pathways.
The excretion of mineral elements in feces primarily occurs through two pathways: first, the excretion of exogenous trace elements added to the diet in excess of the animal’s physiological requirements; second, the excretion of endogenous trace elements that are absorbed by the intestine and subsequently expelled via the biliary secretion system. Research indicates that fecal trace element content was positively correlated with dietary supplementation levels when mineral elements were added to an 18.25% CP basal diet fed to 40-week-old yellow-feathered broilers for 10 weeks (Wang et al. Reference Wang, Liu and Wang2019). In Ross broilers fed for 35 days on a basal diet containing 19.68% CP supplemented with graded levels of Cu, Mn, and Zn, fecal excretion of these elements was significantly increased in the group receiving the highest dose. When dietary trace element supplementation exceeds actual animal requirements, absorption and utilization efficiency markedly decline. A substantial surplus is ultimately excreted in feces, leading to resource waste and environmental pollution (Burkett et al. Reference Burkett, Stalder and Powers2009). This study found that, under different trace element combination patterns, higher inclusion levels of a single trace element were associated with a greater proportion excreted in feces, consistent with previous research. However, under the LP diet used in this study, the model-predicted optimal reduction combination (Fe: 33, Cu: 0, Mn: 0, Zn: 0 mg/kg) has particular practical significance. This result strongly suggests that, within this specific LP diet system, the Cu, Mn, and Zn supplied by the basal ingredients alone are sufficient to meet the physiological needs of laying hens. This conclusion is corroborated by molecular evidence from metal ion transporter genes in this study: in treatments with minimal Cu, Mn, and Zn supplementation (Fe: 40, Cu: 2, Mn: 0, Zn: 20 mg/kg), mRNA expression of all metal transporters remained elevated. This suggests that the endogenous mineral supply is sufficient to maintain normal metabolic homeostasis without requiring enhanced absorption via upregulation of transporter expression. Therefore, under LP conditions, excessive trace element supplementation relative to basal dietary supply may offer limited additional benefits and could disrupt mineral homeostasis, thereby increasing fecal excretion and environmental load. These findings suggest that trace element requirements should be reconsidered in the context of dietary protein levels. It should be noted that the optimized trace minerals supplementation strategy identified in the present study was derived under specific experimental conditions, including Hy-Line Brown laying hens aged 49–60 weeks, a 15% CP diet, and a defined basal ingredient composition. Therefore, the applicability of this recommendation may be limited, and it should not be directly extrapolated to other poultry strains, age-groups, dietary protein levels, or feed formulations without further validation.
Within the LP diet system established in this study, partial correlation analysis further revealed a complex network of interactions among trace elements, including Fe, Cu, Mn, and Zn. First, Cu × Zn exhibited significant negative correlations across all equations, indicating an antagonistic relationship between Cu and Zn. Fe × Zn also exhibited a negative correlation, further suggesting an antagonistic relationship between Fe and Zn. High Zn supplementation may impair Fe absorption and utilization, thereby reducing Fe bioavailability. Additionally, Cu × Mn showed significant negative correlations, indicating potential competition between Cu and Mn in certain physiological processes. In contrast to the aforementioned antagonistic effects, Mn × Zn exhibited a significant positive correlation. This suggests potential synergistic effects between them in energy metabolism or enzyme system activation, which may promote protein synthesis and deposition and thereby positively influence production performance, such as egg weight. The positive correlation between Fe × Cu suggests functional complementarity in key metabolic pathways, such as hemoglobin synthesis or redox reactions. The remaining individual variables showed distinct correlation patterns across different indicators due to their distinct functional roles. These findings further underscore the need for precise control of trace element ratios in LP diets to avoid excessive supplementation of any single element, thereby ensuring optimal production efficiency and animal health.
Conclusions
In summary, this study confirms that laying hens fed a 15% CP diet can receive lower trace minerals supplementation than conventional recommendations without compromising production performance. Using a uniform design approach, we identified optimized mineral combinations that maintained productivity while supporting egg quality, enhancing nutrient digestibility, and reducing mineral excretion. Specifically, fecal excretion of Fe, Cu, Mn, Zn, and total minerals increased with dietary supplementation levels. Regression analysis predicted that minimal total mineral excretion could be achieved with approximately 33 mg/kg supplemental Fe and no additional supplementation of Cu, Mn, or Zn, while maintaining production performance. These findings provide a scientific basis for precision-feeding strategies aimed at improving nutrient utilization and minimizing environmental impact.
Acknowledgements
This study was supported by the National Key R & D program of China (2022YFD1300504) and Xianyang Science and Technology Bureau (L2024-ZDKJ-ZDCGZH-0007).
Author Contributions
R.L.: Writing – original draft, data curation, and conceptualization. C.H.: Formal analysis and validation. H.J.: Formal analysis and investigation. X.W.: Formal analysis and investigation. J.S.: Resources. X.Z.: Resources. F.Z.: Resources. J.H.: Resources. Y.L.: Resources. X.Y.: Resources. Z.R.: Writing – review and editing, supervision, and funding acquisition.
Conflict(s) of Interest
The authors declare that they have no competing interests.
Ethical Standards
All animal studies were conducted in compliance with the ethical guidelines approved by the Animal Ethics Committee of the Northwest A&F University under Protocol DK2022007.

 Open access

