1. Introduction
Fluid–fluid immiscible displacements in porous media are important in many fields of industry, such as carbon dioxide storage, and oil recovery and soil infiltration (Berg & Ott Reference Berg and Ott2012; Huppert & Neufeld Reference Huppert and Neufeld2014; Tsuji, Jiang & Christensen Reference Tsuji, Jiang and Christensen2016; Odier et al. Reference Odier, Levaché, Santanach-Carreras and Bartolo2017; Tran, Neogi & Bai Reference Tran, Neogi and Bai2017; Vishnudas & Chaudhuri Reference Vishnudas and Chaudhuri2017), and one major concern is to increase or decrease trapping of the defending fluid. The fluid invasion process is governed by the viscous force and the capillary force, which depends on flow rate, viscosity, interfacial tension, wettability and porous structure. Interplay between different factors produces different distributions of trapped ganglia size (Avendaño et al. Reference Avendaño, Lima, Quevedo and Carvalho2019; Wang, Pereira & Gan Reference Wang, Pereira and Gan2020), and displacement patterns ranging from fractal and ramified to compact, when either viscous force (Chen & Wilkinson Reference Chen and Wilkinson1985; Måløy, Feder & Jøssang Reference Måløy, Feder and Jøssang1985; Lenormand, Touboul & Zarcone Reference Lenormand, Touboul and Zarcone1988; Aker, Måløy & Hansen Reference Aker, Måløy and Hansen2000; Rabbani et al. Reference Rabbani, Or, Liu, Lai, Lu, Datta, Stone and Shokri2018; Gu, Liu & Wu Reference Gu, Liu and Wu2021) or capillary force (Lenormand & Zarcone Reference Lenormand and Zarcone1985; Cieplak & Robbins Reference Cieplak and Robbins1988; Lenormand et al. Reference Lenormand, Touboul and Zarcone1988; Holtzman & Segre Reference Holtzman and Segre2015; Trojer, Szulczewski & Juanes Reference Trojer, Szulczewski and Juanes2015) dominates. The purpose of this work is to investigate the statistical behaviour of trapping during capillary displacement. For simplicity, in the following text the invading and defending fluids are respectively referred to as water and oil. With negligible viscous impact, the governing factors are wettability and structure (Zhao, MacMinn & Juanes Reference Zhao, MacMinn and Juanes2016), and in the literature (Cieplak & Robbins Reference Cieplak and Robbins1988; Holtzman & Segre Reference Holtzman and Segre2015; Blunt Reference Blunt2017) it is suggested that a water-wet condition and homogeneous structure produce a compact displacement pattern with the help of a cooperative effect. Yet the interplay between heterogeneous wettability distribution and heterogeneous structure relatively lacks study (Wang et al. Reference Wang, Chauhan, Pereira and Gan2019; Wang, Pereira & Gan Reference Wang, Pereira and Gan2021), which is of more importance especially when there is wettability alteration (Berg et al. Reference Berg, Cense, Jansen and Bakker2010; Liu & Wang Reference Liu and Wang2020; Taheriotaghsara et al. Reference Taheriotaghsara, Bonto, Eftekhari and Nick2020). In this work, we study the trapping patterns by numerical simulations of water invasion on two-dimensional (2-D) networks of disordered media, which are initially filled with oil, with various wettability distributions and structure to clarify their impacts.
2. Methods
We perform numerical simulations of water invasion on 2-D networks of disordered media, which are initially filled with oil. Under such physical settings, layer flow and snap-off can be ignored (Al-Gharbi & Blunt Reference Al-Gharbi and Blunt2005; Singh et al. Reference Singh, Jung, Brinkmann and Seemann2019; Esmaeilzadeh et al. Reference Esmaeilzadeh, Qin, Riaz and Tchelepi2020). The algorithm follows the idea of pore-network modelling, where the network is viewed as a collection of pores and throats, and the elements (pore or throat) are filled in ascending order of their entry pressure (Blunt Reference Blunt1998; Zhao et al. Reference Zhao, MacMinn, Primkulov, Chen, Valocchi, Zhao, Kang, Bruning, McClure and Miller2019). In the traditional pore-network model, the entry pressure of a throat depends on its size and contact angle as  $P_{c}=\sigma \cos \theta / r$, where
 $\sigma$ is the interfacial tension,
 $r$ is the radius of the element and
 $\theta$ is the contact angle of oil. The entry pressure of a pore additionally depends on the number of connected throats filled with water, namely the cooperative effect, and it is often introduced by a parametric model:
 $P_{c}=\sigma \cos \theta / r-\sigma \sum _{1}^{n} A_{i} x_{i}$, where
 $n$ is the number of connecting oil-filled throats,
 $x_{i}$ are random numbers and
 $A_{i}$ are arbitrary parameters (Valvatne & Blunt Reference Valvatne and Blunt2004). We make two modifications in our algorithm. First, we introduce a geometric parameter, the diverging angle
 $\phi$, to capture the inevitable diverging feature at a throat–pore junction (Payatakes Reference Payatakes1982) shown in figure 1. This is a simplified treatment for a 2-D structure that has been applied recently in generalized network modelling (Raeini, Bijeljic & Blunt Reference Raeini, Bijeljic and Blunt2018). Second, we propose that the multiple adjacent throats filled with water do not necessarily lead to cooperative pore filling. The relevant pores must be partly filled so that the interface encounters other throats. Therefore we track the interface within pores for more exact description of the cooperative effect. The numerical realization is as follows. We allow pores to be partly filled instead of either filled or unfilled. An unfilled pore has a primary capillary entry pressure
 $Pc_{1}$ that determines whether the interface can advance to contact other throats and become a partly filled pore, and a partly filled pore has a secondary entry pressure
 $Pc_{2}$ that determines whether it can be fully filled. In other words, a pore is now filled in two steps instead of one. More complex topology can lead to more than two steps of pore filling. Inside the diverging channel,
 $P_{c}=(\sigma +\phi ) \cos \theta / r$, where
 $r$ is a variable ranging from the radius of the relevant throat and pore, and
 $Pc_{1}$ is the largest of the
 $Pc$. Here,
 $Pc_{2}$ depends on the number of cooperative throats, namely throats filled with invading fluid, and touches the interface:
 $P_{c}=C_{n}(\sigma +\phi ) \cos \theta / r$; and
 $C_{n}$ are coefficients related to structure and can in theory vary for different pores. Two requirements should be met:
 $C_{2}=1$, meaning that the radius of curvature is the same as the radius of the pore when only one throat is unfilled for cooperative pore filling, a requirement recognized in previous works; and
 $C_{0}>C_{1}>C_{2}$, which is a general geometrical requirement. In this work we use a simple treatment that
 $C_{0}=2$,
 $C_{1}=1.4$,
 $C_{2}=1$. The necessity of such modifications and benchmark for our algorithm are shown in the Appendix.
Illustration of the diverging feature at a throat–pore junction. A geometric parameter, diverging angle  $\phi$, is introduced to capture it. This allows better description of porous structure than in the traditional pore-network model.

The topology of networks is fixed throughout this study as a  $400\times 400$ square lattice, while distributions of the wettability, the pore size and the geometric parameter are varied. For given distributions, each element is assigned a size, a contact angle and diverging angles in a random and independent way spatially. Trapping occurs when oil is surrounded by water, and every simulation ends when all oil phase is fully trapped. This work cares only about the capillary-dominated trapping process, while the post-trapping oil ganglion dynamics (Rücker et al. Reference Rücker, Berg, Armstrong, Georgiadis, Ott, Schwing, Neiteler, Brussee, Makurat and Leu2015) will not be considered.
3. Results and discussion
The trapping patterns are summarized by analysing the simulation results. The statistical behaviour of trapping in plain words is how many and what kinds of elements are being trapped. In the model of the present work, each element can be characterized by its entry pressure and its state, a pore or a throat. Therefore the percentage and the distribution of trapped pores and throats along the sequence of their entry pressure fully capture the statistical information, which are defined as the trapping pattern for a given set of distributions (contact angle, pore size and diverging angle). Note that the same set of distributions corresponds to numerous spatially different networks, which may produce different displacing sequences, yet their trapping patterns are proved to be the same statistically, with a standard deviation less than 1 %.
It is noted that the combination of all three distributions yields numerous possibilities and it is unpractical to cover all cases directly. We propose several dimensionless parameters, which can be calculated from the distributions, essentially controlling the trapping pattern, thus all possible trapping patterns can be obtained by varying these parameters. First, we consider the simplified case that the pore filling is negligible and the entry pressure of pores is calculated in the same way as for throats. This makes the model reduce to invasion percolation (IP) with trapping (Wilkinson & Willemsen Reference Wilkinson and Willemsen1983; Sheppard et al. Reference Sheppard, Knackstedt, Pinczewski and Sahimi1999; Sahini & Sahimi Reference Sahini and Sahimi2003). It is recognized that the hierarchy of entry pressures instead of the absolute value actually determines the result of IP, which is equivalent to knowing the order relation between any two elements. We further note that when an element is adjacent to elements with a higher entry pressure, whether the element itself will be invaded is fully dependent on its neighbours. We call such an element ‘locally non-dominant’ and its neighbours ‘locally dominant’ ones, and the trapping pattern will depend only on the order relation of the locally dominant elements. The order relation between pores or between throats is symmetric and does not affect the trapping pattern, and as a result the control parameters need only to capture the order relation between a pore and a throat. We define the local pore-dominance  $PD_{L}$ as the percentage of locally dominant pores among all pores. Here,
 $PD_{L}=0$ and
 $PD_{L}=1$ correspond to site-percolation and bond-percolation, respectively (Stauffer & Aharony Reference Stauffer and Aharony2018). Among the locally dominant elements, we define the non-local pore-dominance
 $PD_{N}$ as the probability of a pore with a higher entry pressure than a throat. Thus both
 $PD_{L}$ and
 $PD_{N}$ range from 0 to 1.
It is validated here whether  $PD_{L}$ and
 $PD_{N}$ control the trapping patterns by IP. For each set of
 $PD_{L}$ and
 $PD_{N}$, at least four distinctively different sets of distributions are adopted, and for each set of distributions, at least 16 spatially different networks are generated. The details of the distributions are explained as follows. Each distribution, either the distribution of the element size or contact angle, is a combination of multiple normal distributions. Each normal distribution has its average value, standard deviation and probability weight, which can all be adjusted to change the values of
 $PD_{L}$ and
 $PD_{N}$. In this work, the average value of each normal distribution of the element size ranges from 1 to 2000, the standard deviation ranges from 0 % to 100 % of the corresponding average value, and the probability weight is naturally between 0 and 1. The contact angle naturally ranges from 0 to 180
 $^{\circ }$, and we set the deviation to be between 0
 $^{\circ }$ and 40
 $^{\circ }$.
 $PD_{L}$ and
 $PD_{N}$ produced by different sets of distributions are considered to be the same if the standard deviation is smaller than 0.1 %. It is found that the networks with the same
 $PD_{L}$ and
 $PD_{N}$ have similar trapping percentage (percentage of trapped elements in number) with standard deviation less than 2 % and similar distributions of trapped elements along the sequence of entry pressure. Therefore, for IP in random networks,
 $PD_{L}$ and
 $PD_{N}$ are the two essential control parameters. This finding is consistent with one previous report, which studied the throat-dominated case, corresponding to
 $PD_{L}=0$ in our work, and found that the residual saturation was invariant of the structure (Chandler et al. Reference Chandler, Koplik, Lerman and Willemsen1982).
Figure 2 illustrates the average trapping percentage of pores and throats when  $PD_{L}$ and
 $PD_{N}$ range from 0 to 1. The results indicate that larger
 $PD_{L}$ and
 $PD_{N}$ lead to more trapping of pores and less trapping of throats. The overall trapping percentage of elements is high regardless of
 $PD_{L}$ and
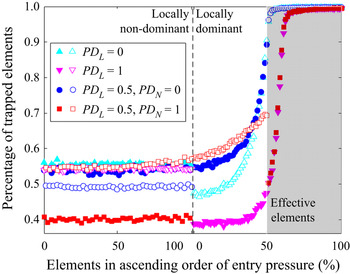
 $PD_{N}$, namely regardless of the wetting condition, consistent with existing knowledge (Cieplak & Robbins Reference Cieplak and Robbins1988). Figure 3 shows the distribution of trapped elements from four sets of
 $PD_{L}$ and
 $PD_{N}$, with elements divided into locally dominant and non-dominant ones. Locally non-dominant elements have a trapping percentage irrelevant to their order relation of entry pressure, as expected. An important feature presented in both figures 2 and 3 is that the trapping percentage is most affected by the portion of elements that are most dominant, namely hardest to invade, and in our results this portion is approximately the higher half in entry pressure of locally dominant elements, one-quarter of all elements. This can be directly observed from the zero slope in figure 2, which indicates that variations of
 $PD_{L}$ here do not affect the trapping percentage, because the most dominant quarter of elements is unchanged. The distribution of trapped elements in figure 3 may provide an explanation: half of the locally dominant elements with higher entry pressure are almost fully trapped, while the rest have a considerably lower trapping percentage similar to the locally non-dominant elements. As a result, the overall trapping percentage is mainly determined by the portion fully trapped.
The trapping percentages of pores and throats with varying  $P{{D}_{L}}$ and
 $P{{D}_{N}}$, calculated by IP. Results are averaged from at least four distinctively different sets of distributions and at least 16 spatially different networks for each set of distributions. The standard deviation is less than 2 %.

The distribution of trapped elements arranged in the order of entry pressure, with elements divided into locally dominant and non-dominant ones, at four sets of  $P{{D}_{L}}$ and
 $P{{D}_{N}}$. The filled symbols are pores and unfilled symbols are throats, as in figure 2.

The impact of wettability and structure on trapping can be interpreted from the trapping patterns. Note that in applications, the amount or volume of the trapped oil is the major concern, instead of the percentage of trapped elements in number. Quantitatively,  $PD_{L}$ and
 $PD_{N}$ can be calculated from given wettability and structures, and the corresponding trapping patterns along with input distributions yield the amount of trapping. We thus obtain a general rule from the feature that the most dominant portion is fully trapped, and that the least trapping condition is ‘the most dominant elements having small volume’. Therefore, for the same structure, homogeneous oil-wet is better than homogeneous water-wet because under an oil-wet condition, smaller elements have a higher entry pressure. Similarly, deductions can be made that a water-wet condition favours a homogeneous pore size distribution, while an oil-wet condition favours a heterogeneous one.
The full model with pore filling included is now considered. We propose that pore filling brings two more control parameters compared with IP. The first is the efficacy of anisotropy  $E_{aniso}$. Now a pore can have multiple entry pressures from different directions as the diverging angle varies. Consequently, the order relation involving a pore becomes flexible as a pore may have a higher entry pressure in one direction but a lower one in the other. This should reduce trapping as the flow forward restricts the direction and loses the flexibility, leading to more flat displacing front. Here,
 $E_{aniso}$ also depends on the heterogeneity of the network, as the order relation is less affected by anisotropy in more heterogeneous cases. The second control parameter is the efficacy of cooperative effect
 $E_{coop}$. Cooperative effect is recognized as being capable of reducing trapping, but it contributes only to displacements when the interface is impeded before cooperation and not impeded after. The interface being impeded within a pore requires the primary capillary pressure of this pore to be higher than for adjacent throats, and the secondary capillary pressure of this pore to be higher than the primary one, which means that the pore has to be locally dominant and water-wet. It not being impeded after cooperation requires that the resulting decrease of entry pressure changes the order relation involving this pore, otherwise cooperation will not change the displacing sequence. As a result, the cooperative effect favours homogeneous distribution of capillary pressure. Since the percentage of locally dominant pores is captured by
 $PD_{L}$,
 $E_{coop}$ can be defined as function of the percentage of water-wet pores among locally dominant ones and the heterogeneity of the network.
Without giving the exact expressions of  $E_{aniso}$ and
 $E_{coop}$, we can find their upper and lower bounds for fixed
 $PD_{L}$ and
 $PD_{N}$. Anisotropy has no efficacy when the range of entry pressures from different directions of one pore never overlaps with that of another pore. In this way there is still a clear order relation of pores. On the contrary, it has the most efficacy when the entry pressures of pores are assigned independently, regardless of which pore they belong to. Cooperative effect has no efficacy when the difference in entry pressure between any two pores is large enough, so that the cooperation does not change the sequence. On the contrary, it has the most efficacy when all locally dominant pores are water-wet and the entry pressures of pores are close, so that the occurrence of cooperative effect always leads to filling of an otherwise impeded pore. Two bounds of these two parameters give four groups, and by varying
 $PD_{L}$ and
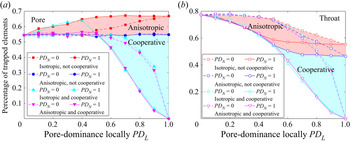
 $PD_{N}$, the full range of trapping patterns can be obtained in figure 4.
The trapping percentages of pores and throats with all four control parameters varied, calculated by the full model. Similar to figure 2, results are averaged and the standard deviation is small.

Figure 4 shows the trapping percentages of pores and throats with the four control parameters at their bounds. Similar to figure 2, each point is the average of results from different input distributions. When there is no efficacy of either anisotropy or cooperative effect, the pattern reduces to IP, which validates that  ${{E}_{aniso}}$ and
 ${{E}_{coop}}$ are the only additional control parameters when pore filling is considered.
Both anisotropy and cooperative effect reduce the amount of trapping and have stronger impact at larger  $P{{D}_{L}}$ and
 $P{{D}_{N}}$, which agrees with theoretical analyses. The impact of the cooperative effect agrees with previous studies (Blunt Reference Blunt1998; Valvatne & Blunt Reference Valvatne and Blunt2004). The impact of
 ${{E}_{aniso}}$ on pores can be understood as shifting the trapping patterns towards the IP case (
 $P{{D}_{L}}=0$). If we increase the entry pressure of a throat to equal that of its connected pore if the entry pressure of the pore is higher and let the pore be locally non-dominant, then the trapping of pores will be the same. Entry pressures of throats connected to the same pore are naturally anisotropic since they are assigned independently. Therefore the most anisotropic cases at any
 $P{{D}_{L}}$ and
 $P{{D}_{N}}$ should have the same trapping behaviour of pores as the IP case at
 $P{{D}_{L}}=0$, as illustrated in figure 4. A higher
 ${{E}_{aniso}}$ also decreases the trapping of throats because more filled pores means a larger area to be swept. The range of possible trapping with anisotropy introduced is indicated by the red area marked ‘Anisotropic’ in figure 4: the capability of
 ${{E}_{aniso}}$ for reducing trapping is limited, and the general feature of IP still remains.
Cooperative effect, on the other hand, has the potential to fully eliminate trapping. It removes the IP feature that the most dominant portion of elements determines the trapping percentage, evident from the sharp slope near  $P{{D}_{L}}=1$. In this case, every locally dominant pore decreases the trapping further, regardless of its sequence. It also breaks the rule that higher pore dominance leads to more trapping of pores when
 ${{E}_{coop}}$ is high enough. The light blue area marked ‘Cooperative’ in figure 4 indicates the range where the cooperative effect must be involved.
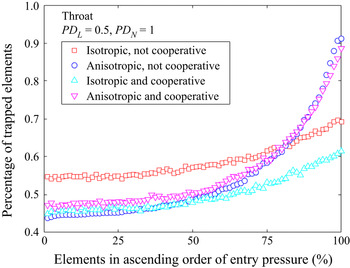
Now we consider the cases where both effects are present. The trapping percentage by both effects always overlaps with that by either one alone, which indicates that there is no synergistic effect. Since the capability of anisotropy to decrease trapping is limited, when the cooperative effect is strong at large pore-dominance, it dominates over anisotropy. On the contrary, at a low pore-dominance, introduction of cooperative effect alone does not reduce trapping at all, and the reduced trapping, compared with IP, owes all to anisotropy. When the anisotropy and cooperative effect have a similar impact on reducing trapping independently – for example, at  $P{{D}_{L}}=0.5,\ P{{D}_{N}}=1$, where the trapping percentages by each effect alone or together all overlap – the anisotropy still dominates over the cooperative effect. It is evident in figure 5 that the distribution of trapped throats is arranged in the order of entry pressure at this point. When both effects are present, the distribution is the same as when only anisotropy is involved, and very different from that where there is only the cooperative effect. We conclude therefore that anisotropy dominates until the cooperative effect leads to less trapping alone.
The distribution of trapped throats arranged in the order of entry pressure at  $P{{D}_{L}}=0.5,\ P{{D}_{N}}=1$, from four combinations of anisotropy and cooperative effect.

Here we recapitulate how the four controlling parameters affect the trapping patterns and their relations with wettability and structure in general. The pore-dominance, either  $P{{D}_{L}}$ or
 $P{{D}_{N}}$, is a description of higher entry capillary pressure of pores compared to throats. Naturally, elements with higher entry pressure are less likely to be displaced. Therefore high pore-dominance leads to more trapping of pores and less trapping of throats. In a perfectly homogeneous wetting condition, due to the diverging angle, pores will always be locally dominant and thus
 $P{{D}_{L}}=1$. Homogeneity of the structure will further cause
 $P{{D}_{N}}$ to be close to 1. Only heterogeneous conditions that lead to relatively low entry pressure of pores can produce lower
 $P{{D}_{L}}$ and
 $P{{D}_{N}}$. Without anisotropy and cooperative effect, the overall trapping percentage will be high regardless, since either pores or throats are dominant and contribute to the trapping. The two other parameters,
 ${{E}_{aniso}}$ and
 ${{E}_{coop}}$, can reduce trapping in that they can alter the fixed order relation between elements. The anisotropy alters the fixed relation by allowing pores to have different entry pressures from different directions, and the cooperative effect directly changes the entry pressure of pores during displacement. Both of these effects favour homogeneous structure, because if the structure is highly heterogeneous, then the change of entry pressure of one element may not change the order relation between it and another element. For the same reason, both favour high pore-dominance as well since they can affect only the entry pressure of pores. The occurrence of cooperative effects additionally requires the wetting condition to be water-wet.
The impact of various combinations of pore geometry, pore size and wettability distributions on trapping is readily predicted based on numerical simulations. It is especially important that those factors have to be considered together because they influence the control parameters essentially. For example, the water-wet condition together with the homogeneous structure reduce trapping the most, while the water-wet condition alone is not necessarily better than the oil-wet one, and the homogeneous structure is not necessarily better than the heterogeneous one. These results provide a possible explanation of why in the previous studies, the minimum amount of trapping occurred at the water-wet (Akai et al. Reference Akai, Alhammadi, Blunt and Bijeljic2019), neutrally wet (Jadhunandan & Morrow Reference Jadhunandan and Morrow1995) or oil-wet (Zhao, Blunt & Yao Reference Zhao, Blunt and Yao2010) condition.
Although this work considers only one fixed topology, the qualitative conclusion is general because the theoretical analyses do not rely on any specific topology. For the IP case at  $P{{D}_{L}}=0$, one previous study actually validated that the trapping percentage was invariant of the topology being a square, triangle or hexagon (Chandler et al. Reference Chandler, Koplik, Lerman and Willemsen1982), and we have successfully repeated this finding.
4. Conclusion
In summary, we have found that the trapping pattern of bypassing during capillary displacement is determined by four dimensionless control parameters,  $P{{D}_{L}}$,
 $P{{D}_{N}}$,
 ${{E}_{aniso}}$ and
 ${{E}_{coop}}$, which can be calculated a priori from the wettability distribution, pore size distribution and pore geometry. We have obtained the range of all possible trapping patterns for randomly generated networks, and shown the relation between patterns and control parameters. The results are open to many interpretations in terms of the impact of wettability and structure on trapping.
Funding
This work is funded by the National Key R&D Program of China (no. 2019YFA0708704), NSF grant of China (no. U1837602) and the Tsinghua University Initiative Scientific Research Program for financial support.
Declaration of interests
The authors report no conflict of interest.
Author contributions
M.W. conceived and promoted this work. F.L. performed the simulations and analysis. F.L. wrote the paper and M.W. revised the text.
Appendix
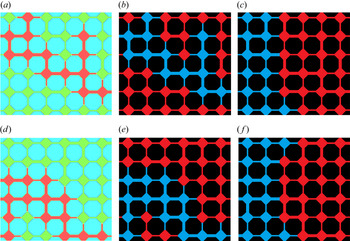
We validate this algorithm and at the same time show the necessity of introducing the geometrical parameter  $\phi$ by doing a comparison with the two-phase lattice Boltzmann method (LBM), which has been validated in our previous works. The algorithm in this work assumes a capillary-dominated flow, which in reality is achieved by the extremely small flow rate in reservoir conditions. However, in numerical simulations such a small flow rate will lead to very long computing times and high computational costs, and we realize the capillary-dominated flow by manually setting higher interfacial tension and lower viscosity. For the same structure and wettability, we compare the two-phase distribution by LBM, our algorithm, and the traditional pore-network model that does not consider the diverging angle
 $\phi$, as shown in figure 6. Exact agreement is achieved between our algorithm and LBM for the two randomly generated structures.
Two-phase distribution obtained by LBM, our algorithm and the traditional pore-network model without considering the diverging angle at pore-throat junctions, for two randomly generated networks. (a–c) are results for network 1 and (d–f) are results for structure 2. (a,d) are obtained by LBM, where the red phase is water and the green phase is oil. (b,e) are obtained by our algorithm, where the red phase is oil and the blue phase is water. (c,f) are obtained by the traditional pore-network model with the same simulation steps as (b,e).

It is possible to do the same comparison for larger structures, but since the stability of LBM has requirements over the viscosity of fluid, maintaining capillary-dominated flow has to be achieved by reducing the inlet velocity. This will increase the computation cost considerably, and we think it is unnecessary as a larger structure does not bring new physics. Also, since we adopt a simple treatment of the coefficients related to cooperative effect, we do not expect exact agreement pore-by-pore when the cooperative effect is important. Instead, we validate that the overall trapping percentage is similar by LBM and our algorithm, even when the efficacy of the cooperative effect is at its upper bound, shown in figure 7. The deviation is because the structure in LBM is not large enough.
Percentage of trapped pores obtained by our algorithm and LBM, when cooperative effect is important.