


Introduction
Rising levels of inter-cultural communication in the modern globalised world have led to ever-increasing numbers of bilingual and multilingual speakers capable of communicating in two or more languages, with recent estimates suggesting that bilinguals constitute the majority of the world's population (Bialystok, Craik & Luk, Reference Bialystok, Craik and Luk2012). Due to the immense diversity of second-language (L2) acquisition contexts, bilinguals vary substantially in their L2 proficiency and age of acquisition (AoA). While fully balanced simultaneous bilinguals are relatively rare, late (with AoA > 5 years) unbalanced bilinguals are common, providing a rich base for testing conceptual frameworks of bilingualism. In spite of this, language remains one of the most poorly understood cognitive functions of the human brain, with the neurobiological mechanisms underpinning the use of two or more languages being one of the particularly important unresolved questions in cognitive neuroscience.
One of the most tangible challenges in this field is that of lexical/lexico-semantic access to word representations in native (L1) and non-native languages (for review, see Duñabeitia, Dimitropoulou, Dowens, Molinaro & Martin, Reference Duñabeitia, Dimitropoulou, Dowens, Molinaro, Martin, Heredia, Altarriba and Cieślicka2015). Different languages have different words for the same, similar or related concepts, and it remains unclear how the two lexicons’ entries are stored and retrieved in a bilingual's mind. One theoretical possibility is to provide a separate store for each language and access them serially depending on which language is currently being used (Grosjean, Reference Grosjean2014). This view is supported by some early imaging studies, which indicated that distinct brain areas might be associated with different languages (Kim, Relkin, Lee & Hirsch, Reference Kim, Relkin, Lee and Hirsch1997; Kim, Qi, Feng, Ding, Liu & Cao, Reference Kim, Qi, Feng, Ding, Liu and Cao2015; Perani, Abutalebi, Paulesu, Brambati, Scifo, Cappa & Fazio, Reference Perani, Abutalebi, Paulesu, Brambati, Scifo, Cappa and Fazio2003).
The alternative view suggests a common/shared store for all words of different languages; the decision on the operating language is in this case made at sub-lexical level (Van Heuven & Dijkstra, Reference Van Heuven and Dijkstra2010). According to the Bilingual Interactive Activation Plus model (BIA+), the multilingual lexicon in multilinguals is stored in the long-term memory as a common vocabulary (Dijkstra & Van Heuven, Reference Dijkstra and Van Heuven1998, Reference Dijkstra and Van Heuven2002). During a given word comprehension process, general lexicon candidates are activated on the basis of their physical similarity with the sensory input. Thereafter, the most likely candidate becomes selected on the basis of frequency of occurrence, timing, and the extent of the recent language use. According to BIA+, the fact that the word belongs to one or the other of the languages known by the speaker does not directly affect the choice of the candidate words.
The common lexicon can be related to the so-called declarative memory faculty, believed to be supported by the temporal cortex structures (Ullman, Reference Ullman2001). One consequence of such an edifice would be the requirement for a stronger cognitive control system in bilinguals as a common lexicon requires closer monitoring, more frequent switching, and stronger inhibition of irrelevant items (Abutalebi, Reference Abutalebi2008). Indeed, vast experimental body does support the idea of cognitive control advantage for bilinguals (Costa, Hernández & Sebastián-Gallés, Reference Costa, Hernández and Sebastián-Gallés2008; Bialystok et al., Reference Bialystok, Craik and Luk2012), although the jury is still out on this issue (Antón, Duñabeitia, Estévez, Hernández, Castillo, Fuentes, Davidson & Carreiras, Reference Antón, Duñabeitia, Estévez, Hernández, Castillo, Fuentes, Davidson and Carreiras2014; Antón, Fernández García, Carreiras & Duñabeitia, Reference Antón, Fernández García, Carreiras and Duñabeitia2016; Paap, Johnson & Sawi, Reference Paap, Johnson and Sawi2015). One possibly important variable in this context is the L2 proficiency. According to the Revised Hierarchical model, there is a direct link between lexical representation of a word (including phonological or orthographic levels) and its conceptual semantics for L1 and for fluent L2 speakers, while low-proficiency L2 speakers access semantic representations indirectly, i.e., by linking their L2 word representations via the proxy of the corresponding L1 representations (Kroll & Stewart, Reference Kroll and Stewart1994; Kroll, Van Hell, Tokowicz & Green, Reference Kroll, van Hell, Tokowicz and Green2010).
These alternative accounts can be empirically tested by presenting deliberately ambiguous linguistic stimuli to bilingual participants. Such stimuli can be cognates (words that share origin, meaning and phonology), homographs (shared orthography) and homophones (similar phonology). Strong evidence for a common bilingual lexicon comes from behavioural studies. In a series of studies using a version of the Visual World paradigm with oral instructions (Marian, Spivey & Hirsch, Reference Marian, Spivey and Hirsch2003; Marian & Spivey, Reference Marian and Spivey2003; Spivey & Marian, Reference Spivey and Marian1999), Russian–English bilinguals were distracted by objects whose Russian names were phonologically similar to the targets’ English names despite the fact that the instruction and experimental environment were fully monolingual; in contrast to this, native English-speaking monolinguals treated those distracters indistinguishably from the neutral fillers. The distraction by members of the target crosslinguistic phonological cohort in the visual world paradigm was also reproduced in non-linguistic tasks, e.g., object colour discrimination (Singh & Mishra, Reference Singh and Mishra2015). Such behavioural data are very important; yet, by themselves they cannot disentangle the brain processes that underlie crosslinguistic interactions in bilinguals. This necessitates the use of brain imaging techniques such as fMRI and EEG (ERP), the latter being more advantageous in situations when high temporal resolution is required (Luck, Reference Luck2005), as is the case for such a highly dynamic process as language comprehension (Duñabeitia et al., Reference Duñabeitia, Dimitropoulou, Dowens, Molinaro, Martin, Heredia, Altarriba and Cieślicka2015).
One of the most common ERP componentsFootnote 1 in neurolinguistic research is the so-called N400, a negative deflection over centro-parietal electrodes locations in the time interval around 400 ms from the stimulus onset, sensitive to a number of psycholinguistic variables including, most importantly, semantic relatedness between consecutive stimulus words (Kutas & Federmeier, Reference Kutas and Federmeier2011; Lau, Phillips & Poeppel, Reference Lau, Phillips and Poeppel2008). Indeed, the N400 has been employed in a range of bilingual studies, particularly for investigating the processing of written language, which represents a particular challenge due to a complex interplay between orthographic and phonological features (Deacon, Dynowska, Ritter & Grose-Fifer, Reference Deacon, Dynowska, Ritter and Grose-Fifer2004). The activation of homograph meanings in both languages has been repeatedly shown to modulate N400 within sentences (Jouravlev & Jared, Reference Jouravlev and Jared2014a) and word pairs (Hoshino & Thierry, Reference Hoshino and Thierry2012; Kerkhofs, Dijkstra, Chwilla & De Bruijn, Reference Kerkhofs, Dijkstra, Chwilla and De Bruijn2006; Thierry & Wu, Reference Thierry and Wu2007). For instance, Russian–English bilinguals showed a reduction in N400 amplitude in comparison to English monolinguals, when processing English sentences that contained a semantically mismatching English word which at the same time had a fitting Russian homograph (Jouravlev & Jared, Reference Jouravlev and Jared2014a). This is highly similar to classical N400 effects reported for monolingual speakers that demonstrated a reduced amplitude for semantically related words (Kutas & Hillyard, Reference Kutas and Hillyard1980). Because a reduction in ERP amplitude signals facilitated lexical access through priming, similar to a reduction in response time in behavioural studies, this suggests simultaneous access to both the L2 and L1 homograph's meanings (Brown & Hagoort, Reference Brown and Hagoort1993). The N400 amplitude was also reduced in Spanish–English bilinguals, but not in English monolinguals, for pairs of English words where the target's Spanish homograph's meaning matched the prime (Hoshino & Thierry, Reference Hoshino and Thierry2012). Furthermore, Chinese–English bilinguals, but not English monolinguals, showed a decrease in the amplitude of the N400 for the English word pairs that shared a character in their Chinese translation (Thierry & Wu, Reference Thierry and Wu2007).
In most of these studies the N400 modulation was not directly related to any behavioural effects. This, however, cannot be considered a limitation per se as behavioural and ERP effects may reflect different levels/stages and processing; dissociations between them may, for, instance, be caused by behavioural measures being not sensitive enough to pick up subtle effects (Thierry & Wu, Reference Thierry and Wu2007). In some studies, the experimental design itself excluded any behavioural response to minimise motor artifacts in the ERP signal (Hoshino & Thierry, Reference Hoshino and Thierry2012; Carrasco-Ortiz, Midgley & Frenck-Mestre, Reference Carrasco-Ortiz, Midgley and Frenck-Mestre2012). At the same time, behavioural and ERP data can be and often are considered as complimentary sources of evidence.
The aforementioned studies clearly suggest access to word representations in the language different from the explicit task language, indicating activation of all co-existing semantic nodes for the particular orthographic configuration. A similar question could be asked about the phonological level of representations in multiple languages. Indeed, similar data on homophones show N400 reduction as a sign of crosslinguistic interaction both for single words and for word pairs. For instance, French–English bilinguals (but not English monolinguals) exhibited lower N400 amplitude when accessing single written English words with an existing closed homophone in French than when accessing control words (Carrasco-Ortiz et al., Reference Carrasco-Ortiz, Midgley and Frenck-Mestre2012). It is even more apparent in the case of two languages using different scripts, such as Spanish and Greek or Russian and English, allowing for clearer separation of the effects of orthography from those of phonology. One behavioural study using Greek–Spanish bilinguals demonstrated that phonologic similarity between semantically unrelated and orthographically dissimilar primes and targets led to reaction-time reduction in a lexical decision task, while adding orthographical similarity to the equation removed this phonologic similarity priming effect (Dimitropoulou, Duñabeitia & Carreiras, Reference Dimitropoulou, Duñabeitia and Carreiras2011). A similar study using ERP methodology investigated effects of priming between L2 and L1 words in Russian–English bilinguals (Jouravlev, Lupker & Jared, Reference Jouravlev, Lupker and Jared2014b), making use of a partial overlap between Russian and English alphabets. The participants were presented with L2-L1 word pairs in a masked-priming task and instructed to name the target word. The first letters of the paired words were identical both in pronunciation and spelling, only in spelling, only in pronunciation, or completely unrelated. Participants’ responses were faster in case of pronunciation similarity regardless of the words’ spellings. The ERPs were also negatively modulated within the 150–250 ms range in orthographically different pairs and in phonologically dissimilar pairs – in the 250–450 ms interval. Interestingly, the former interval largely overlaps with N170 – another well-established linguistic ERP component known to reflect the early stages of visual word recognition, likely at prelexical level (Bentin, Mouchetant-Rostaing, Giard, Echallier & Pernier, Reference Bentin, Mouchetant-Rostaing, Giard, Echallier and Pernier1999; Maurer, Brandeis & McCandliss, Reference Maurer, Brandeis and McCandliss2005); although note more recent evidence of early lexical access at even earlier latencies (Hauk, Davis, Ford, Pulvermüller & Marslen-Wilson, Reference Hauk, Davis, Ford, Pulvermüller and Marslen-Wilson2006; Shtyrov & MacGregor, Reference Shtyrov and MacGregor2016).
The studies reviewed thus far investigated effects of crosslinguistic orthographic, phonological and semantic overlap separately or the combination with phonological and orthographic overlap. To the best of our knowledge, no study to date has investigated neurobiologically the combined interplay between L1 and L2 phonology and semantics. Such an investigation would document both distinct and interactive effects of phonological and semantic similarity between L1 and L2 words. As such, it would be able to disentangle two crucial hypotheses about bilingual lexicon integration: (1) A fully integrated lexicon hypothesis predicting interactions between phonological and semantic levels following up on the within-language monolingual studies (Besner, Dennis, Davelaar, Besner & Davelaar, Reference Besner, Dennis, Davelaar, Besner and Davelaar1985; Lukatela & Turvey, Reference Lukatela and Turvey1994) or (2) a separate-store hypothesis, which generally does not predict such interactions (de Groot & Nas, Reference de Groot and Nas1991). In the study reported here, we set out to fill this gap.
Namely, we investigated effects of crosslinguistic phonological and semantic overlap in electrophysiological brain responses as well as in behavioural performance. To this end, we used late Russian–English bilinguals. On the one hand, they represent a typical case of unbalanced bilingual speakers. On the other hand, the two languages use different scripts (Cyrillic vs. Latin) allowing for controlled manipulations of phonology and semantics largely unconfounded by orthographic features. In line with existing research, we used a classical masked-priming design with a forward mask preceding a very short subliminal prime followed by a clearly visible target, which allows for probing implicit relations between the prime and the target stimuli (Dehaene, Naccache, Cohen, Bihan, Mangin, Poline & Rivière, Reference Dehaene, Naccache, Cohen, Bihan, Mangin, Poline and Rivière2001; Henson, Eckstein, Waszak, Frings & Horner, Reference Henson, Eckstein, Waszak, Frings and Horner2014). To ensure the participants’ attention on the verbal input and to minimise motor artifacts in brain responses, we introduced a delayed match-to-sample task using occasional catch stimuli that could be the same or different from the target and required an overt similarity judgement.
We predicted different outcomes for the two alternative accounts, i.e., those of separate or shared bilingual lexicons. Separate lexicon storage of L1 and L2 would not predict any effects of similarity between L1 primes and L2 probes in either behavioural or ERP measures. In contrast, shared lexicon accounts would predict facilitation effects for both phonological and semantic overlaps that could manifest in shorter reaction times and/or reduced ERP amplitudes for overlap vs. no overlap, a hypothetical effect which could also vary as a function of L2 proficiency (Blumenfeld & Marian, Reference Blumenfeld and Marian2013). Critically, a fully integrated lexicon would predict that a double overlap should produce a cumulative effect and/or an interaction.
Thus, we presented our bilingual participants with primes and targets that overlapped (1) phonologically, (2) semantically, (3) both phonologically and semantically, or (4) did not overlap at all. We recorded high-density EEG throughout the experimental session and analysed ERPs and their underlying cortical sources (with an a priori focus on previously established N170 and N400 intervals) comparing them between these four main conditions.
Materials and methods
1. Experimental participants
Participants (N=17, 4 males; mean age 20.6±.7 years) were recruited mostly from the pool of students of the HSE Department of Psychology who are native Russian speakers but receive large part of their instruction in English and have to demonstrate high proficiency in English as one of their entrance requirements; all use both Russian and English in their daily lives. The study was approved by the local research ethics committee, and the participants were remunerated for their participation. All participants were right-handed; their handedness was assessed using the Edinburgh inventory (Oldfield, Reference Oldfield1971), the mean handedness quotient across the groups being 71.9±5.6%. Following the handedness test, they were presented with other experimental tasks in the following order: 1) Language Proficiency and Exposure (LEAP-Q) test, 2) crosslinguistic masked-priming task combined with EEG recording, 3) vocabulary test. These are described below in more detail.
2. Language proficiency and exposure
Language proficiency and exposure were measured with The Language Experience and Proficiency Questionnaire (LEAP-Q), an established, reliable and efficient tool for assessing the language profiles of healthy bi/multilingual populations in research settings (Marian, Blumenfeld & Kaushanskaya, Reference Marian, Blumenfeld and Kaushanskaya2007), which we adapted here to be used in NBS Presentation v18.1 stimulus presentation software (NeuroBehavioral Systems, Berkeley, CA, USA) such that each question of the questionnaire appeared as one computer screen. The general part of the questionnaire was performed identically by all participants while the language-specific parts were presented to each participant according to their own language list from the answer to question 2 (“Please list all the languages you know in order of acquisition”). English proficiency was one of the questions and it had to be self-rated by participants separately for speaking, understanding, and reading on a scale from 1 to 10. The average of those three values was used as a subjective measure of English proficiency. A more objective independent English proficiency evaluation was performed at the end of the experimental session using a custom-design vocabulary test (see below).
3. Crosslinguistic masked-priming task
3.1. Verbal material
We generated a database of 365 monosyllabic items subdivided into 5 lists of 73 items: List 1 included English nouns all of which were matched by phonologically close Russian nouns in List 2 (e.g., ditch – дичь [dʲˈit͡ɕ] = game). List 3 was formed of monosyllabic Russian words semantically related to List 1 English words (direct translations, e.g., ditch – ров [rɔf] = ditch) or, if they could not be found, a closely related Russian word, e.g., snack – сыр [sɨr] = cheese). List 4 consisted of phonologically and semantically unrelated group of English words from the corpus whose frequencies were similar to those in Lists 1 and 2. List 5 consisted of Russian words formed by transliterating List 4 items in Cyrillic alphabet (the standard way of treating foreign words in Russian texts) thereby creating both phonological and semantic similarity between Lists 4 and 5 (pump – памп [pʌmp]). Further 365 similar items were used as fillers. The lemma frequency of English words was taken from COCA online database (http://corpus.byu.edu/coca) and the lemma frequency of Russian words was taken from online Sharov corpus (http://www.artint.ru/projects/frqlist.php); the words across the lists did not differ in frequencyFootnote 2. All stimuli were independently verified by three high-proficient Russian–English bilinguals. All stimuli are presented in Supplementary Table 1 (Supplementary Materials).
LEAP-Q results

3.2. Procedure
Participants were seated in an electrically shielded and acoustically dampened chamber. Experimental stimuli were visually presented on computer screen of 75 cm diagonal with Presentation v18.1 software. The experimental paradigm was an adaption of a typical masked priming task (Forster & Davis, Reference Forster and Davis1984). The trial started with a fixation point with 1050–1550 ms duration randomly jittered in 100-ms steps. It was followed by a 500-ms forward mask of percent symbols (%), followed by a 50-ms prime. This masked prime was immediately followed by the target stimulus of 500-ms duration, concluding with the final 50-ms presentation of percent symbols (Fig. 1). At this point, 80% of trials were finalised without any action required from the participant and the next trial started. To ensure the participant's attention on the input, in 20% of trials (randomly distributed) a catch word was additionally presented after a 1000-ms delay. Catch words were target repetitions in 50% of all catch cases (match) and randomly chosen words in the other 50% (non-match). We presented our catch stimulus only after a fraction of target stimuli to minimise motor artifacts in the EEG signal. Thus we obtained both behavioural data from these catch trials and ERP data from other masked-primed trials without motor confounds and in the shortest possible time. Our instruction to the participants was thus to perform a delayed matching-to-sample task (cf. Novitski, Anourova, Martinkauppi, Aronen, Näätänen & Carlson, Reference Novitski, Anourova, Martinkauppi, Aronen, Näätänen and Carlson2003), known to tap working memory processes.
The schematic illustration of the events in the bilingual task. The bracket to the left encompasses the events of the regular trials that occurred 80% percent of the time and consisted of a forward mask, a subliminal prime, a target and a short backward mask. This scheme illustrates a prime-target pair from Semantics – Phonology + condition. The catch trial that is encompassed by the bracket to the right contained additionally a catch stimulus that was identical (as on the present figure) or different from the target trial. The task was to press one button for same and the other button for the different target-catch trials. A feedback was given for incorrect (see left lower corner) or delayed (>1000 ms responses).
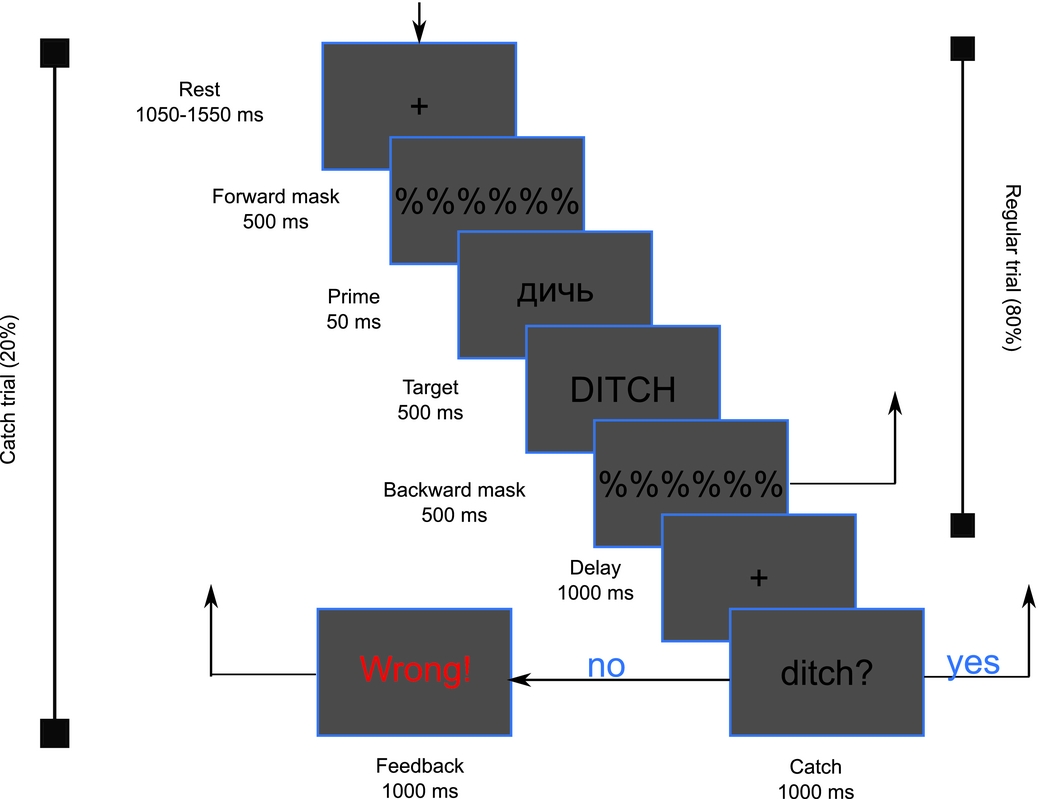
The participant had to give a response within 1000 ms on whether the catch word was same or different from the immediately preceding word (target) by pressing “Z” with their left hand or “M” with their right hand on a computer keyboard, respectively. The font size was 50 pixels with all letters presented in black on light-grey background; in line with the conventions in the field, primes and catches were presented in lower case, while targets were presented in upper case. The feedback was presented on the screen only if the response was incorrect or was too slow. A short training paradigm without subliminal primes and with feedback for both correct and incorrect responses was presented just before the test to make sure that the participant understood the task. Accuracy was calculated as percentage of correct responses in the sum of correct and incorrect responses. The trials in which the participant had not responded within 1000 ms after catch presentation were excluded from analysis.
All prime words were Russian stimuli, as described above, spelled in Cyrillic script, while all targets and catches were English words in Latin script. Due to the short duration and the presence of the mask, the prime was not consciously perceived by participants and only targets remained visible. After the main test phase, participants answered a questionnaire that probed the participants’ knowledge of what kind of information was visible to them. No participants reported noticing the transliterated Russian primes, and one participant reported noticing one Russian word prime, which was due to a single technical failure in presentation (this trial was subsequently excluded). We conclude that the primes were indeed sufficiently masked and invisible to the participants. Thus the participants remained unaware of the experimental manipulation of prime and target combinations, which were meanwhile systematically varied to include all possible modifications of semantic and phonological (dis)similarity. To this end, 4 different combination types (below referred to as conditions) were employed, recombining stimuli from the different lists. In S-P+ condition (Semantics-Phonology+) the words of Lists 2 and 1 were combined to ensure only a phonological, but not semantic, similarity within each prime-target pair. Re-shuffling of the same words from the two lists – so that no relation, either phonological or semantic, was present – produced S-P- condition (Semantics-Phonology-). Semantically related word pairs from Lists 3 and 1 are classified as S+P- condition (Semantics+Phonology-). Finally, Lists 5 and 4 made S+P+ condition (Semantics+Phonology+). All conditions were presented equiprobably in a pseudo-random fashion. The whole task lasted about 30 min; for the participants’ comfort, the test was subdivided into 7 sub-blocks with a short self-timed pause between them.
3.3. Familiar items selection
Individual item familiarity was deduced from the correctness of the translation of this item in the vocabulary test (see below). A dedicated purpose-built MATLAB script was written in order to include the word competence in both behavioural and ERP analysis. Only familiar items were then included into analysing behavioural and ERP data.
3.4. Behavioural data analysis
We measured hit rates and reaction times separately for 4 conditions (S-P-, S-P+, S+P- and S+P+) and for match and non-match cases. Responses outside 1000 ms window after catch stimulus onset were treated as misses. The target items unfamiliar to the participant as revealed by their performance on the subsequent vocabulary task (see below) were excluded from the analysis. The hit rates were calculated as the proportion of accurate responses to the sum of accurate and erroneous responses thus excluding the misses. Only reaction times for the accurate responses falling within 2 SDs of each individual participant's data mean were included in the analysis. After these filtering procedures were applied, there remained 3.95±.3 non-match trials and 4.45±.22 match trials per participant per condition.
The reaction times of correct responses to catch trials as a bar plot. Only responses within 1000 ms after catch trial presentation are taken in consideration. Left side bar group represent non-matching catch trials and right side bar group represent matching catch trials. Left half of each bar group represent semantically congruent pairs and right half of each group represent semantically incongruent pairs. Dark grey bars represent phonologically related pairs, while light-grey bars represent phonologically unrelated pairs. The horizontal brackets mark statistically significant differences (* p<.05). There were no significant differences in the hit rates.

We applied two 3-way ANOVAs with factors Match, Semantic similarity, and Phonetic similarity to the analyses of the hit rates and the reaction times. In addition, we performed a reaction time analysis without S+P+ condition with only two factors – Match and Condition. Finally, we checked if the semantic relation type (direct translation or semantic similarity) had an impact on the data as suggested before (Basnight-Brown & Altarriba, Reference Basnight-Brown and Altarriba2007). To that end, we compared reaction times for the semantically related vs the direct translation items of S+P- condition data in a 2-way ANOVA with match vs. non-match condition as the second factor.
All significant effects are reported and F-values are given for the non-significant findings. Significant interactions were further examined with pair-wise t-tests; false discovery rate corrections for multiple comparisons were applied (FDR, Benjamini & Hochberg, Reference Benjamini and Hochberg1995).
4. Vocabulary test
146 English words (Lists 1 and 4 in full) were used to test bilingual vocabulary of the participants. The vocabulary test was an unspeeded forced choice task in which the participant was presented with an English word and three variants of its translation into Russian, all in one column. The participant had to choose the correct translation by pressing 1, 2 or 3 on the keyboard. The L1 words in this test were always direct translations of L2 stimuli, even when they consisted of more than one syllable. The feedback was presented immediately for both correct and incorrect responses. The number of correct and incorrect responses in this test was used as a measure of the participant's proficiency in English (Vocabulary proficiency), also serving to establish their understanding of the stimulus material in the crosslinguistic task above. This vocabulary test was always administered after the crosslinguistic masked-priming task.
5. Electroencephalography
5.1. EEG recording
During the masked-priming task, the participants’ EEG was recorded with 128-channel actiCHamp amplifier and PyCorder software (Brain Products GmbH, Gilching, Germany). The electrode positions were measured by the CapTrack device from the same company, which determines electrode positions using LED lights on the cap. The sampling rate was 500 Hz and the recording was performed in a frequency band from DC to Nyquist frequency with screen filters applied for monitoring only. During the recording the data were referenced to FCz. The markers of the stimuli were fed via parallel port from stimulation computer into the amplifier and recorded within the EEG data set. For added precision and quality control, a photosensor was attached to the screen to verify the timing of the screen presentation recorded to an analogous channel in EEG. No substantial differences between the markers and photosensor timing were found out and thus only the timing from the markers was used in the analysis.
5.2. EEG preprocessing
The EEG was analysed offline with Brain Vision Analyzer 2 software (Brain Products, Germany). The measured coordinates were imported in the beginning of analysis and all the following steps were performed with actual electrode coordinates. Bad channels detected with visual inspection were removed at this stage. The data were downsampled to 250 Hz and filtered with IIR bandpass filter of 0.1 – 30 Hz (24 dB/octave slope). The continuous data were scanned in a semiautomatic way for technical artifacts with the following initial limitations: maximal allowed voltage step 50 µV/ms, maximal allowed difference of values 400 µV within 200-ms interval, lowest allowed activity 0.5 µV in 100-ms interval. The data intervals with detected artifacts at any channel were marked as bad and excluded from further analysis.
Note that the aforementioned criteria allowed the presence of ocular artifacts, which were removed in a separate procedure using independent component analysis (ICA, Infomax Restricted algorithm). Components relevant for vertical and horizontal eye movements were detected on the basis of the square of correlations with Fp1-TP9 or F8-F9 channel differences, respectively. Additionally, spatial maps of the channel weightings were inspected in order to find the typical vertical (frontal activity with increase towards frontal pole) and horizontal (fronto-lateral activity with polarity inversion across the midline) artifact patterns. 2–5 components were excluded from decomposition on the basis of the aforementioned parameters in each participant and thereby cleaned data were projected back onto the electrodes. Bad channels were topographically interpolated with spherical splines. Topographic interpolation was performed after ICA as the presence of interpolated channels during ICA decomposition increases the redundancy in the data and can potentially disturb decomposition. At the next stage of the analysis the data were re-referenced to the average of all EEG channels, and all subsequent analyses were performed with average reference.
5.3. ERP sensor analysis
ERP analysis was performed for the individually familiar items only (see Familiar items selection above). The data were segmented in intervals -150 to 650 ms around the onset of the target and baseline-corrected using the -150 to -50 baseline interval (i.e., 100-ms pre-prime interval). Segments that did not satisfy the following criteria were excluded: maximal allowed voltage step 50 µV/ms, maximal allowed difference 90 µV in 90-ms interval, minimal allowed amplitude -100 µV, maximal allowed amplitude 100 µV, lowest allowed activity .1 µV in 100-ms interval. The remaining artifact-free segments were averaged separately for each of the participants and conditions. For subsequent analyses the electrodes were pooled in 16 topographic clusters. The amplitude was averaged and exported for statistical analysis using 32-ms intervals centred on N170 and N400 components of the ERP (i.e., 152–186 and 384–416 ms). Based on the previous research, the N170 activity was examined in lateral occipital clusters (Maurer et al., Reference Maurer, Brandeis and McCandliss2005), and N400 was investigated in the central clusters near the vertex (Kutas & Federmeier, Reference Kutas and Federmeier2011).
5.4. ERP source analysis
For analysing cortical current sources underlying surface EEG activity, LORETA transform (Pascual-Marqui, Michel & Lehmann, Reference Pascual-Marqui, Michel and Lehmann1994) was performed as implemented in Brain Vision Analyzer 2 (Brain Products GmbH). LORETA is a 3-D linear distributed inverse solution that is based on a physiologically plausible assumption of spatial smoothness of the neuronal activity across the brain. It performs source reconstruction as the points of 3-D grid that can be warped into a standard Montreal MRI model. The sources within anatomically distinguishable parts of the grid (gyri, sulci, Brodmann areas) can be subsequently pooled together into regions of interests. In order to improve signal-to-noise ratio the data were additionally filtered in 1–15 Hz band with additional notch filter at 50 Hz. We used a spherical forward model with individually measured electrode positions. As previous literature has indicated sources of lexico-semantic activations to be primarily in the left temporal lobe (Carreiras, Armstrong, Perea & Frost, Reference Carreiras, Armstrong, Perea and Frost2014; Dehaene & Cohen, Reference Dehaene and Cohen2011; Ha Duy Thuy, Matsuo, Nakamura, Toma, Oga, Nakai, Shibasaki & Fukuyama, Reference Ha Duy Thuy, Matsuo, Nakamura, Toma, Oga, Nakai, Shibasaki and Fukuyama2004; Hauk, Coutout, Holden & Chen, Reference Hauk, Coutout, Holden and Chen2012; Liu, Zhang, Tang, Mai, Chen, Tardif & Luo, Reference Liu, Zhang, Tang, Mai, Chen, Tardif and Luo2008), we extracted activity from four regions of interest (ROI) in the left temporal lobe: superior temporal gyrus (STG), middle temporal gyrus (MTG), inferior temporal gyrus (ITG) and temporal pole (TP). The activity in the ROIs was measured using the same a priori defined time windows as for the ERP analysis above, corresponding to N170 and N400 components of the ERP for each of the four conditions S+P+, S-P+, S+P- and S-P-.
5.5. ERP statistical analysis
Statistical analysis was performed with the help of SPSS Statistics Version 22 (IBM Corp, 1989, 2013) package and R (R Core Team, 2015). A 3-way ANOVA with factors Electrode cluster, Semantic similarity and Phonological similarity and 3-way ANCOVA with factors Electrode cluster, Semantic similarity, Phonological similarity and covariate Vocabulary proficiency were performed for the ERP amplitude at the left and right lateral-occipital clusters in N170 range and for the data from fronto-central and centro-posterior clusters in N400 range. We added vocabulary covariate to the model specifically for N400, as this component is known to be sensitive to the bilingual/monolingual status of the participants (e.g., Carrasco-Ortiz et al., Reference Carrasco-Ortiz, Midgley and Frenck-Mestre2012; Hoshino & Thierry, Reference Hoshino and Thierry2012). These clusters are based on the typical topographies of these two ERPs, which was also the case in the current study. Similarly, a 3-way ANOVA with factors ROI, Semantic similarity and Phonological similarity was performed separately for N170 and N400 source data. All significant effects are reported and F- and p-values are given for the non-significant findings. Significant interactions were further examined with pair-wise t-tests; false discovery rate corrections for multiple comparisons were applied (FDR, Benjamini & Hochberg, Reference Benjamini and Hochberg1995).
Results
1. Language Proficiency
The median self-reported proficiency in the LEAP-Q test was 7.5 and the mean was 7.6 ±1.4 (out of 10). The percentage of errors in the vocabulary task was 14.3±1.9 % and the median was 14%. The detailed results of LEAP-Q score are given in Table 1.
2. Behavioural results
The detailed descriptive statistics of the behavioural results are given in Table 2. A significant main effect of Match (F(1,16)=9.86, p=.006, partial η2=.38) and 3-way interaction Match X Semantics X Phonology (F(1,16)=5.12, p=.038, partial η2=.24) are observed for reaction time. The response was faster for match than for non-match condition and within match condition it was also faster for S+P- than for S+P+ or S-P- conditions (p=.047 and p=.017, FDR corrected). No significant hit rate effect was found in this analysis (Match: F(1,16)=1.68, Semantics: F(1,16)=.297, Phonology: F(1,16)=1.40, Fig. 2).
Behavioural results.

Reaction time analysis without S+P+ conditions with only 2 factors in ANOVA – Match and Condition revealed the main effect of Match (F(1,16)=9.97, p=.006, partial η2=.38) and Match X Condition Interaction (F(2,32)=9.94, p(GG)=.034, partial η2=.20). The latter interaction was driven by the shorter reaction times in the S+P- condition than S-P+ and S-P- conditions for match response type (p=.042 and p=.013, FDR corrected). In a separate reaction time analysis of the direct translations vs. semantically related words in S+P- condition the effect of Match was reproduced (F(1,7)=42.18, p<.001, partial η2=.858), but no effect of the Relation type was found (F(1,7)=.034).
3. ERP signal-space results
3.1. N170
As expected, visual inspection of the global field power revealed a prominent peak around 170 ms and a shift in the typical N400 range (Fig. 3), which were further analysed statistically. No significant effects for N170 amplitude were found after the FDR correction, although Semantic similarity effect was close to significance (F(1,16)=3.43, p=.08, partial η2=0.18). Adding vocabulary proficiency as a covariate yielded no interactions in ANCOVA either with Semantic (F(1,15)=1.76, p>0.1, partial η2=0.11. Fig. 4) or Phonological similarity (F(1,15)=.04, p>0.1, partial η2=0.003) with a 3-way interaction Semantics X Phonology X Vocabulary stopping at the brink of significance (F(1,15)=3.66, p=0.056, partial η2=0.20).
The global field power (GFP, middle) and voltage maps (above and below) of the event related potentials (ERPs) for Semantics+Phonology+ (thick solid line, left most map), Semantics+Phonology- (thin solid line, second from the left map), Semantics-Phonology+ (thick dashed line, second from the right map) and Semantics-Phonology- (thin dashed line, right most map) conditions. The grey rectangles mark the intervals of interest: N170 (152 -184 ms) and N400 (384-468 ms). The voltage maps within the N170 interval are shown above and the voltage maps within the N400 are shown below the GFP plot, each accompanied by its greyscale legend. White rectangles above the abscissa axis schematically represent the positions and durations of the prime (Pr) and target. The baseline was calculated at -150 to -50 ms, i.e. pre-prime interval.

The waveforms of the ERPs averaged across 8-electrode regions of interest in the left (left panel) and right (right panel) hemispheres that were used for statistical comparisons in N170 (152 -184 ms, marked with arrows) interval between Semantics+Phonology+ (thick solid line), Semantics+Phonology- (thin solid line), Semantics-Phonology+ (thick dashed line) and Semantics-Phonology- (thin dashed line) conditions. The position of each of the regions of interest at the electrode scheme is given below the ERP plot. The baseline was calculated at -150 to -50 ms, i.e. pre-prime interval.

3.2. N400
There was a significant main effect of the Electrode cluster (F(1,16)=63.74, p<.001, partial η2=.799) and interactions Semantics X Phonology (F(1,16)=7.99, p=.012, partial η2=.33) and Electrode cluster X Phonology (F(1,16)=7.45, p=.015, partial η2=.32). In an ANCOVA with the same factors and vocabulary proficiency covariate, we detected the main effect of electrode cluster (F(1,15)=11.20, p=.004, partial η2=.43, Fig. 5) and interaction between Semantic Similarity and Vocabulary proficiency (F(1,15)=7.39, p=.016, partial η2=.33). The difference in the N400 amplitude between S- and S+ condition increased linearly as a function of the increase of vocabulary task performance (p<.001, adjusted r2=.17, Fig. 6).
The waveforms of ERPs over central electrodes (A) and the mean N400 amplitude (B). A. The waveforms of the ERPs averaged across 8-electrode regions of interest in the precentral (upper panel) and postcentral (lower panel) regions that were used for statistical comparisons in N400 (384 -468 ms, marked with arrows) interval between Semantics+Phonology+ (thick solid line), Semantics+ Phonology- (thin solid line), Semantics-Phonology+ (thick dashed line) and Semantics-Phonology- (thin dashed line) conditions. The position of each of the regions of interest at the electrode scheme is given below the ERP plot. The baseline was calculated at -150 to -50 ms, i.e. pre-prime interval. B. The mean N400 amplitudes of N400 over central electrode clusters in the between Semantics+Phonology+ (S+P+), Semantics+Phonology- (S+P-), Semantics- Phonology+ (S-P+) and Semantics-Phonology- (S-P-) conditions. The horizontal brackets mark statistically significant differences (* p<.05).

N400 amplitude difference (Semantics- minus Semantics+) as a function of the subject performance in vocabulary task (percentage of correct translations). Every participant is represented by 4 points corresponding to all combination of factors Phonology (P+ and P-) and Region of interest (precentral and postcentral). Linear regression fit with adjusted determination coefficient is r2 =.17 is plotted as a straight line (*** p<.001).

We also performed the ANCOVA for N400 with all lexical items to check the possibility that the removal of the unknown items might have biased the effect of proficiency by leaving more trials for high- than low-proficient participants. Here, we found the main effect of cluster (F(1,15)=13.35, p=.02, partial η2=.47), an interaction between Semantic and Phonological similarity (F(1,15)=5.3, p=.036, partial η2=0.26) and, most importantly, the same Interaction between Semantic similarity and Vocabulary proficiency covariate (F(1,15) = 5.5, p<.033, partial η2=0.27, r2=.099), fully confirming the results above.
4. ERP source analysis results
4.1. N170 sources
Source analysis indicated that the N170 response was predominantly underpinned by left inferior-temporal and temporal pole cortices: this was expressed as a main effect of ROI (F(3,48) = 4.84, p=.005, p(GG)=.16, partial η2=.23), with subsequent pairwise comparisons (all FDR-corrected) indicating that the activity in both ITG and TP was higher than in STG (p=.0035 and .0032), which was in turn higher than in MTG (p=.03).
4.2. N400 sources
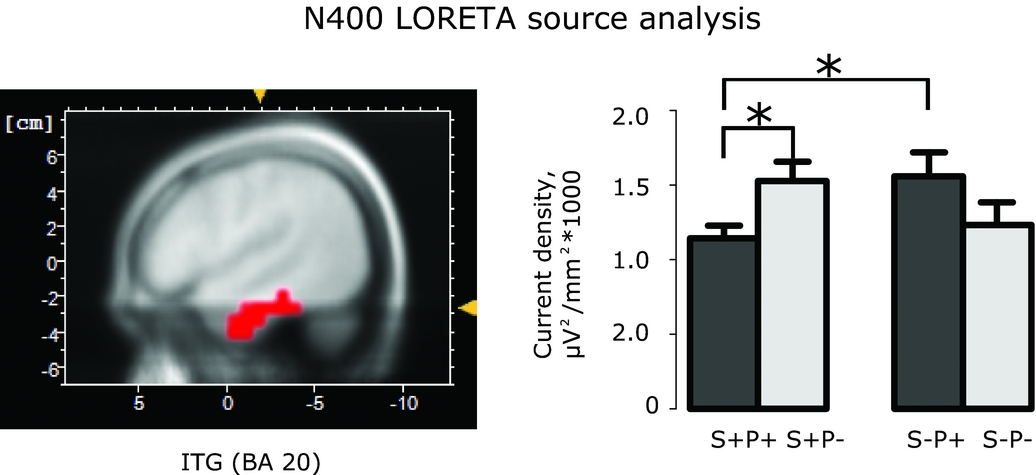
The left temporal pole and inferior-temporal gyrus were also implicated as the main source of the activity in the N400 time window, where a main effect of ROI was found (F(3,48) = 15.88, p<.001, partial η2=.50, Fig. 7), with pairwise comparisons (all FDR-corrected) indicating that the activity in TP was higher than in ITG (p<.001), which was in turn higher than in MTG (p<.001), which, finally, was higher than in STG (p=.025). Furthermore, there was a trend towards an interaction between the effects of Semantic similarity and Phonological similarity (F(1,16)=4.27, p=0.055) for all ROIs combined. In an ad hoc separate analysis of each of four ROIs only inferior temporal gyrus preserved this interaction as significant (F(1,16)=1.78, p=.005, partial η2=.403) with condition S+P+ producing less activation than S-P+ (p=.023, FDR-corrected) and S+P- (p=.023, FDR-corrected).
N400 LORETA source analysis. The position of the region of interest in the inferior temporal gyrus, Brodmann area 20 (left panel) and averaged source strength in N400 interval (384 -468 ms) in Semantics+Phonology+ (S+P+), Semantics+Phonology- (S+P-), Semantics-Phonology+ (S-P+) and Semantics-Phonology- (S-P-) conditions (right panel). The horizontal brackets mark statistically significant differences (* p<.05).
Discussion
The current study investigated the effects of phonological and semantic crosslinguistic similarity between L1 and L2 lexicons in late Russian–English bilingual adults. This was approached by analysing behavioural responses and event-related potentials elicited by L2 words in an L1-L2 masked-priming paradigm with subliminal prime presentation. We employed a delayed matching-to-sample task in order to ensure the participants’ close attention on the word stimuli while minimising motor-related influence on ERPs. Our data revealed that the phonological similarity between masked L1 primes and explicit L2 targets significantly decreased the ERP amplitude in the N400 time range in the condition with no semantic similarity (homophone condition) between L1 prime and L2 target, indicating a crosslinguistic phonological-semantical interaction. Semantic similarity within crosslinguistic pairs deflated the reaction times for the matching catch trials in the absence of phonological similarity. Moreover, semantic similarity also influenced the brain response in the N400 range, reducing its amplitude in more proficient participants, as demonstrated by the analysis using proficiency as a covariate. LORETA source analysis indicated the predominant sources of both N170 and N400 activations in the left inferior temporal lobe and temporal pole, with the strongest interaction between phonological and semantic similarity features in the ITG. Let us now briefly consider these findings in more detail.
1. Selective vs. common lexical access
Current data lend support to the common bilingual lexicon access. First, we found a clear crosslinguistic interference in the behavioural task. Even though the task did not require deep processing of stimuli and, most importantly, the L1 primes were presented subliminally and, hence, were not consciously perceived, their presentation clearly interfered with the participants’ performance: crosslinguistic semantic similarity in the absence of phonological similarity written in two different scripts facilitated behavioural responses (evident as reduction in reaction times) in the case of two L2 words matching in catch trials. This is similar to the results of previous monolingual masked priming studies (for reviews, see Coltheart, Rastle, Perry, Langdon & Ziegler, Reference Coltheart, Rastle, Perry, Langdon and Ziegler2001; Frost, Reference Frost1998; Grainger & Jacobs, Reference Grainger and Jacobs1999; Rastle & Brysbaert, Reference Rastle and Brysbaert2006) that interpret such priming effects as a sign of intrinsic connections between prime and probe representations. This similarity, in turn, suggests comparable representational interplay mechanisms within L1 and between L1 and L2. Furthermore, this interference effect is strikingly similar to the results obtained using other experimental paradigms.
More specifically, we considered two major models of bilingual word access: BIA+ and RHM. The BIA+ model postulates that the incoming words activate lexical and sub-lexical nodes in the mental lexicon that are similar to the input word's features (Van Heuven & Dijkstra, Reference Van Heuven and Dijkstra2010). Thus, all letters, phonemes and words having similar features are activated independently of the specific language. Eventually the lexical item with the strongest activation input inhibits all the other competitors. The role of the L2 proficiency on this view is limited to the lexical level. The lexical item that has no representation in the mental lexicon (e.g., an unknown L2 word for a low-proficient bilingual) would not activate any lexical memory circuit but could still stimulate a set of phonologically similar sub-lexical items. As such, our data are fully compatible with the predictions of the BIA+ model as both phonological and semantic similarities between L1 and L2 words facilitated L1-L2 pair perception, but only semantic similarity reflected L2 proficiency. This suggests that phonological similarity was effective both at lexical and sub-lexical levels. On the other hand, RHM model assigns the uttermost importance to the L2 proficiency and suggests that accessing the L2 words in low-proficient bilinguals is profoundly different from high-proficient bilinguals (Kroll et al., Reference Kroll, van Hell, Tokowicz and Green2010). Specifically, it predicts that the word semantics access in low-proficiency bilinguals can be achieved only via accessing L1 word forms. Our data do confirm the role of proficiency in the extraction of the semantics in the L1-L2 pairs, as our high-proficient bilinguals were better in detecting the semantic incongruencies. However, instead of a categoric demarcation between high and low proficiency we registered a rather gradual change. Also, we did not observe any proficiency-related differences in phonological similarity detection although the RHM model suggest that low-proficient bilinguals should automatically activate the corresponding L1 word form for the incoming L2 word thus inhibiting direct phonological similarity detection between the words of different semantics in L1 and L2 (homophones, S-P+). It therefore appears that our data fit the BIA+ framework better than the RHM framework. However, we also acknowledge a possibility that our sample of late sequential bilinguals does not represent a wide-enough spectrum of bilingual proficiency due to the overall high proficiency within the group. This could have prevented us from detecting qualitative differences between high and low proficiency bilinguals as predicted by the RHM. Future studies may clarify this issue by deliberately selecting groups including all degrees of L2 proficiency from beginners who know a small set of high-frequency words to highly eloquent L2-speakers.
2. Phonological similarity effects
Second, in line with our original hypothesis, we found that crosslinguistic phonological similarity influenced the ERP patterns of brain responses elicited by target words. Most interestingly, it facilitated the neural processing of the phonologically similar target as manifested by decrease in N400 amplitude. N400 is often taken as a reflection of a conflict or processing difficulty, and its reduction is therefore seen as an effect of facilitation, typically by priming/preactivation of (lexico-)semantic representations by the preceding information, an effect well known from monolingual ERP studies (Deacon, Hewitt, Yang & Nagata, Reference Deacon, Hewitt, Yang and Nagata2000; Kiefer, Reference Kiefer2002; Lau et al., Reference Lau, Phillips and Poeppel2008). Thus, it seems plausible to suggest that a subliminally presented visual prime, though activating its phonological representation in L1, also pre-activated the phonologically similar lexico-semantic L2 representation, leading to the marked N400 reduction (or even complete absence/reversal) – a remarkable feat by the brain, considering that our participants were unaware of the prime's presence. These data are in good agreement with the previous findings of decreased N400 amplitude or more positive ERP in 250–450 ms interval for homophones in bilinguals (Carrasco-Ortiz et al., Reference Carrasco-Ortiz, Midgley and Frenck-Mestre2012; Jouravlev et al., Reference Jouravlev, Lupker and Jared2014b). Furthermore, they significantly strengthen this previously available evidence by showing this effect simultaneously in masked priming (unlike Carrasco-Ortiz et al., Reference Carrasco-Ortiz, Midgley and Frenck-Mestre2012) under full-form phonological similarity (unlike the partial one in Jouravlev et al., Reference Jouravlev, Lupker and Jared2014b). Taken together, this body of ERP evidence as well as available behavioural data suggests parallel activation of both L1 and L2 phonological representations when reading and argues for a non-language-specific account of word representations in bilinguals.
Interestingly, the facilitatory effect of phonological similarity was not present when accompanied by semantic similarity (stronger N400 for S+P+ than S-P+ condition). In principle, one might suggest that the participants did not in any way access the semantic processing level and that all the analysis happened at the sublexical level. This explanation is, however, unlikely, as we also observed the semantic effect on behavioural responses. Similarly, it does not offer a satisfactory explanation of the interaction between phonology and semantics in ERPs at N400 latency in both sensor and source space analysis as well as a range of the findings reviewed above. It seems plausible to assume, however, that the registration of semantic facilitation in S+P+ condition may have been prevented by the implemented experimental design. Namely, we used transliteration to jointly match phonology and semantics between languages in S+P+ condition. Transliteration is the only standard way of presenting any foreign words in written Russian, firmly established over hundreds of years of separation between Cyrillic and Latin scripts. Further enhanced by the recent wave of massive English borrowings, the use of transliterated English words is a norm, very familiar to our highly proficient participants. We therefore assume that transliteration of an English word into Cyrillic script is the most transparent way of deriving materials for the S+P+ condition, as it should produce an impression of an English word used in Russian context, similar to a borrowed foreign word. We also assume that transliterations are more appropriate than cognates. Many English–Russian cognates deviate substantially in their pronunciation, which may lead to further matching complications. (e.g., the cognate of the Russian «лак» is “lacquer”, but its pronunciation is identical to “luck”.) Moreover, the different frequency of cognates in the two languages would introduce an additional confound. Transliterated primes can also be considered analogous to the pseudohomophones of the monolingual literature, and those are known to evoke smaller N400s (Briesemeister, Hofmann, Tamm, Kuchinke, Braun & Jacobs, Reference Briesemeister, Hofmann, Tamm, Kuchinke, Braun and Jacobs2009; Newman & Connolly, Reference Newman and Connolly2004). As a result, we chose transliterations as the best choice for constructing S+P+ pairs in our study.
It is thus unlikely (although not impossible) that transliterations might result in an enhanced N400-like effect by themselves. There must exist some other mechanism overlapping and counteracting the putative similarity-related N400 reduction for the target. For instance, as items previously unencountered per se, they might cause somewhat deeper lexical processing, which might affect the perception of the probe stimulus. This, however, remains to be tested in future purpose-built experiments. Given the short duration of the prime presented just before the target and the extended nature of N400 shifts, it is not possible to validate this suggestion using the current data, and future studies (for instance, varying the prime-target distance, prime duration and experimental task) are needed to address this question.
Interestingly, we have not registered any crosslinguistic phonological similarity effects on participants’ responses. Using eye-tracking and visual world paradigm, previous studies showed that bilingual speakers were distracted by visually presented objects whose names in one language phonologically interfered with the other ones (Marian & Spivey, Reference Marian and Spivey2003; Marian et al., Reference Marian, Spivey and Hirsch2003; Spivey & Marian, Reference Spivey and Marian1999). On the other hand, crosslinguistic facilitation (shorter reaction times) was found in some previous studies that used either lexical decision task (Dimitropoulou et al., Reference Dimitropoulou, Duñabeitia and Carreiras2011) or shadowing (Jouravlev & Jared, Reference Jouravlev and Jared2014a). This dissociation between our findings and other existing reports can be explained by the different task demands imposed by a delayed response in our study as opposed to the visual world paradigm, and rapid responses in the lexical decision and shadowing tasks. Future studies are necessary in order to directly compare crosslinguistic interference and facilitation effects in different tasks and experimental conditions.
3. Semantic similarity effects
The reduction of reaction time for S+P- condition in our study can be interpreted as translation priming (Finkbeiner, Forster, Nicol & Nakamura, Reference Finkbeiner, Forster, Nicol and Nakamura2004). Translation priming with L1 primes and L2 targets is quite robust in semantic categorization and lexical decision tasks (Xia & Andrews, Reference Xia and Andrews2015). The existence of translation priming for the languages with non-overlapping writing systems, such as Chinese and English indicate that it involves semantic representation level of processing and not just orthographic overlap (Jiang, Reference Jiang1999). Translation priming sometimes differs from more general crosslinguistic semantic priming (Basnight-Brown & Altarriba, Reference Basnight-Brown and Altarriba2007; Schoonbaert, Duyck, Brysbaert & Hartsuiker, Reference Schoonbaert, Duyck, Brysbaert and Hartsuiker2009). Our S+P- condition contained both direct translations and crosslinguistic semantic neighbours, but the current dataset provide no proof for the difference between those two categories. The N400 amplitude sensitivity to semantic overlap in our study was linked to the L2 proficiency. Namely, the difference in N400 amplitude between semantically related and unrelated crosslinguistic pairs was more negative in more proficient bilinguals, suggesting that bilinguals with higher proficiency are better neurally at differentiating between L2 words semantically related and unrelated to L1 primes. In less proficient participants, the brain may not be able to register sufficiently well that the semantically related words are in fact related or that two semantically unrelated words are in fact unrelated, or both. This result replicates the larger N400 effect to incongruency in L2 in high- vs lower-proficiency bilinguals (Ardal, Donald, Meuter, Muldrew & Luce, Reference Ardal, Donald, Meuter, Muldrew and Luce1990; Elgort, Perfetti, Rickles & Stafura, Reference Elgort, Perfetti, Rickles and Stafura2016). Note that here we only analysed the responses to the items that were familiar to the participants (although the result was also confirmed by an ad hoc analysis of all items). The effect of vocabulary task score on semantic similarity modulation of N400 amplitude is therefore caused by the proficiency differences.
Removal of the unknown items from the analysis might have complicated the story by removing more items for the low- than the high-proficient participants. This possibility, however, was not supported by our analysis. First, the interaction between proficiency and semantic similarity effects was present when analysing both the custom-pruned data with known items only and the all-item dataset. Removing the items unknown to specific subjects did increase the significance of the aforementioned interaction, likely indicating a reduction of noise in the dataset. However, the fact that this interaction was registered both by using the full and the truncated sets of items indicates that a smaller number of items for the low-proficiency participants cannot be the only source of this interaction. Second, if the reduced power due to missing items affected the statistical results, it would equally bias effects of both Phonetics and Semantics. However, our analyses confirmed only Semantics X Proficiency but not Phonetics X Proficiency interaction. This allows us to cautiously conclude that Semantics X Proficiency interaction reflects a genuine increase in the N400 semantic similarity effect for the high-proficient participants.
Note that the language-related order of item presentation used in our vocabulary tasks (L2-L1) was different from the major priming task (L1-L2). This was implemented because these tasks played different roles in the study; however, this divergence should not have affected the result. Vocabulary task was used here solely for testing participants’ proficiency. Both L1 and L2 items were displayed on the screen during the vocabulary trial and the participants performed the task under no time pressure. So, they had unrestricted simultaneous access to both L1 and L2 words. Importantly, their bilingual proficiency was independently assessed with the help of the LEAP-Q. The vocabulary task included all L2 items that were used in the priming experiment with their literal translations, while both literal translations and semantic neighbours were used in the S+P- condition of the priming task. We considered it important to test for the knowledge of all explicitly presented L2 target items; this would be difficult if we chose the L1-L2 direction in the vocabulary task. This necessitated the L1-L2 order in our priming experiment while we assumed that the proficiency scores in the vocabulary task used here were not influenced by the exact presentation mode.
Interestingly, while the phonological-semantic interactive ERP pattern observed in our study supports crosslinguistic interactions, it does not directly mirror the exclusive presence of semantic effects on reaction times in the behavioural data from the delayed matching task. The latter is however not surprising. Dissociations between behaviour (e.g., reaction time) and ERP data are known in the N400 literature (Kutas & Federmeier, Reference Kutas and Federmeier2011). For instance, in at least one bilingual study the subtle effect of a “hidden” Chinese character was found in N400, but not in the behavioural data (Thierry & Wu, Reference Thierry and Wu2007). The similar divergence here is, in our view, best explained by the different processes being reflected in the ERP dynamics immediately during the encoding stage, on the one hand, and, on the other hand, the behavioural results that indicate the retrieval and matching success taking place later in the delayed match-to-sample task we employed. Future studies should therefore investigate these interactions between neurophysiological and behavioural patterns in more depth using different tasks as well as no-task conditions.
4. The role of left temporal lobe
Our high-density recording allowed us to localise both the N170 and N400 to areas within the temporal lobe, with the highest source amplitude in inferior temporal cortex and in the temporal pole. While the left temporal lobe in general is expected to contribute to language-related activations as known from previous EEG and fMRI studies (Van Petten & Luka, Reference Van Petten and Luka2006, Binder, Desai, Graves & Conant, Reference Binder, Desai, Graves and Conant2009; Price, Reference Price2012), the inferior temporal cortex has been linked to written word processing (Dehaene & Cohen, Reference Dehaene and Cohen2011, but see also critique by Price & Devlin, Reference Price and Devlin2003), while the temporal pole is often suggested as a ‘hub’ for lexico-semantic representations (e.g., Patterson, Nestor & Rogers, Reference Patterson, Nestor and Rogers2007). Our data confirm the important role for these areas at both the early (N170) and late (N400) stages of lexical/lexico-semantic access, and their susceptibility to crosslinguistic interactions, implying a shared bilingual lexicon with shared neuroanatomical substrate. On a more cautious note, the spatial resolution of EEG, particularly in the absence of individual MRI images, is limited, and future studies that could use high-definition spatio-temporal neuroimaging are needed (e.g., combined MEG-EEG with individual MR-based conductor models) in order to elucidate the neuroanatomical substrates of these effects.
5. Implications for future studies
Although the languages used in our study, Russian and English, are related in that they belong to the same Indo-European language family and use similar left-to-right letter-based scripts for writing, the actual alphabets they employ are different – Cyrillic vs. Latin. This feature enabled us to test phonological overlap effects without orthographic overlap interference (cf. Dimitropoulou et al., Reference Dimitropoulou, Duñabeitia and Carreiras2011). The interference between phonological and orthographic overlaps between Russian and English words has been already investigated before, in a study which limited phonological similarity to the first letters of word pairs (Jouravlev et al., Reference Jouravlev, Lupker and Jared2014b). We took the next step and used full homophones to compare phonological and sematic similarity with no orthographic overlap. As in the previous studies, we used masked-priming paradigm such that the participants remained unaware of the prime's presence, which was also confirmed by both informal questioning and formal debriefing.
Although directionality of priming effect is a debatable issue (Haigh & Jared, Reference Haigh and Jared2007; Van Wijnendaele & Brysbaert, Reference Van Wijnendaele and Brysbaert2002), here we use a unidirectional priming protocol, namely from L1 to L2. Hence, we are inclined to conclude that the registered experimental effects are bottom-up, with the prime influencing the target. Further studies are necessary to fully elucidate this. These would need to manipulate visual, orthographic, lexical, and semantic features, as well as attention allocation to the task and the L1/L2 order.
Conclusions
To conclude, our data reveal crosslinguistic interaction in languages with distinct orthography in both behavioural and electrophysiological measures. The ERP data indicate that both phonological and semantic crosslinguistic similarities beween subliminal primes and supraliminal targets are detected by the brain, with particualarly strong activation sources in the left temporal pole and inferior temporal gyrus at ~170 and ~400 ms. Our results generally support the notion of an integrated bilingual lexicon. Future studies are essential to scrutinse the temporal dynamics and neuroanatomical substrates of crosslinguistic interactions during L1/L2 reading.
Supplementary material
To view supplementary material for this article, please visit https://doi.org/10.1017/S1366728918000627



