1 Introduction
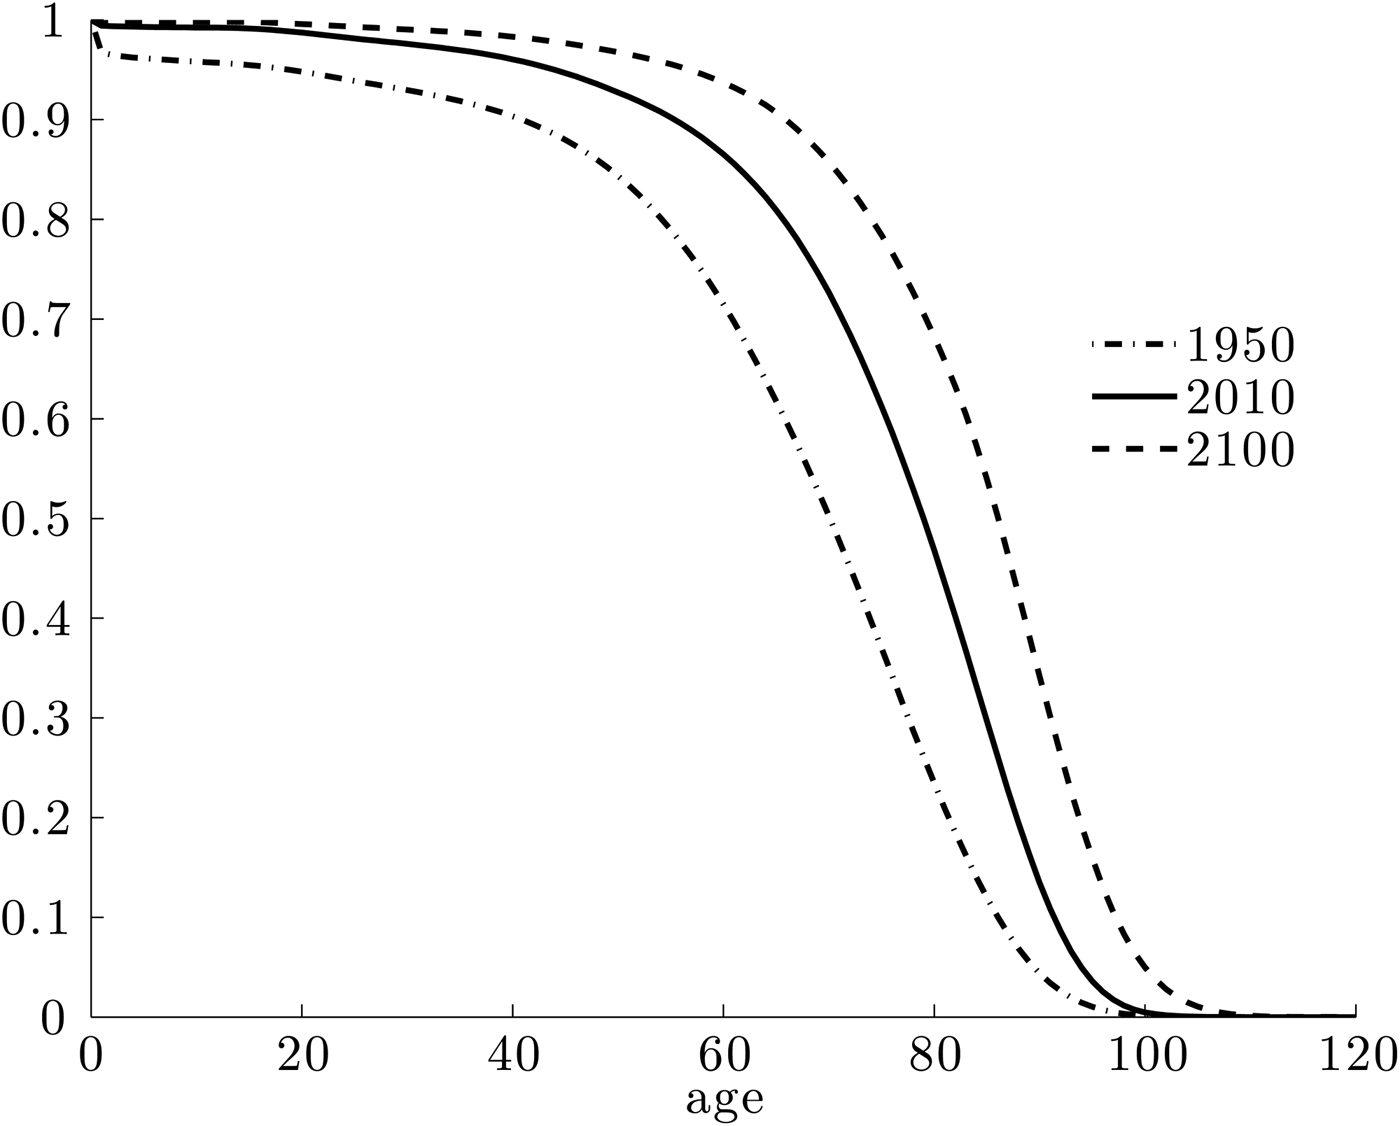
The past decades have witnessed a remarkable increase in the average length of human life. For males, life expectancy at birth in the USA went up from 65.63 years in 1950 to 75.40 years in 2010. This is the result of an increased probability of survival at every age; see Figure 1 which shows the fraction of individuals that are still alive at a given age for both years. This demographic trend is expected to continue in the near future as evidenced by the forecasted survival function for 2100. Life expectancy for males will go up with almost 8 more years to about 83.
Survival function for the USA, males. Source: Bell and Miller (Reference Bell and Miller2005).

The aim of this paper is to study the long-run economic effects of such a predicted longevity increase. In particular, we are interested in how it affects individual decisions about education and retirement, taking macroeconomic repercussions through endogenous factor prices and the pension system into account. To that end we construct a model of a closed economy inhabited by overlapping generations of finitely-lived individuals. Over the life cycle their stock of human capital increases with education and the build-up of labour market experience and decreases because of depreciation. As people get older their stock of knowledge and skills deteriorates at an increasing rate, so that productivity eventually declines with age. This induces individuals to spend the last years of their life in retirement.
In this context, we present analytical results and a simple quantitative exercise regarding the steady-state effects of two stylized shocks. The first is a biological longevity boost (BLB), which consists of an outward shift of the survival function in the manner described above. We find that individuals work a little longer, but spend most of the additional years in retirement. They substantially increase their savings, which raises the capital intensity of production and lowers the interest rate. The labour tax rate required to finance a Defined Benefit (DB) Pay-As-You-Go (PAYG) pension system increases by almost 3 percentage points. In the second scenario, we consider, the increase in the expected length of life is accompanied by a reduction in the rate of human capital depreciation at any given age. Under this comprehensive longevity boost (CLB) it is possible that human capital becomes relatively abundant in production, resulting in a lower unit cost of effective labour and an increase in the interest rate. As individuals are more productive and work longer the pension tax rate need hardly change.
We make two contributions to the literature on the macroeconomics of ageing (see Lee (Reference Lee2016) for a survey). First, we show that it is important to distinguish between the length of ‘biological life’ (how long a person is expected to live) and the length of ‘economic life’ (how long a person can participate in the labour force) as this matters greatly for the affordability of an unfunded pension system in an ageing society. It has been argued by d'Albis et al. (Reference d'Albis, Lau and Sánchez-Romero2012) that in the absence of distorting tax incentives the optimal retirement age may increase or decrease following a rise in life expectancy, depending on the age profile of mortality decline. We show that the optimal length of the retirement period also depends crucially on the extent to which an individual can be productive during the additional years of life. If the improvement in health that brings about an increase in the expected length of life also reduces the rate of human capital depreciation, then the pressure on the pension system is significantly alleviated compared with the case that the age-productivity profile remains unchanged.Footnote 1
Second, we show that factor prices could move in a direction opposite to the one accepted as conventional wisdom following an increase in longevity. The usual story is that an increase in the expected length of life raises the stock of physical capital relative to human capital as individuals save more for retirement (see, for example, Kalemli-Ozcan et al. (Reference Kalemli-Ozcan, Ryder and Weil2000) and Ludwig et al. (Reference Ludwig, Schelkle and Vogel2012)). As a consequence the interest rate decreases and wages go up. These relative factor price movements matter, as they affect the intergenerational distribution of welfare and wealth during the transition from one demographic steady state to the next. Recently retired individuals will not benefit from increases in the wage rate but will receive a lower return on their pension savings if the interest rate goes down. We show that if an increase in longevity is accompanied by an improvement in productivity, then human capital might become relatively abundant, which would instead raise the return to capital.
The remainder of this paper is organized as follows. In Section 2, we outline the model, followed by the derivation of comparative static effects regarding the optimal retirement age in Section 3. We parameterize the model in Section 4 in order to perform a simple quantitative exercise, the results of which are described in Section 5. The final section concludes. The paper contains two Appendices with technical derivations.
2 Model
In this section, we develop a dynamic micro-founded macro model of a closed economy. First, we describe the behaviour of firms (Section 2.1) and individuals (Section 2.2). After discussing accidental bequests (Section 2.3) and the details of the pension system (Section 2.4) we characterize the macroeconomic equilibrium (Section 2.5).
2.1 Firms
There exists a representative firm that produces aggregate output Y(t) which can be used for consumption and investment. The production factors are the stock of physical capital K(t) and a labour composite N(t), which is defined as:
 $$N(t) = [\beta N^{\rm u}(t)^{1 - 1/\psi} + (1 - \beta )N^{\rm s}(t)^{1 - 1/\psi} ]^{1/(1 - 1/\psi)}, \quad \psi \gt 0.$$
Following Katz and Murphy (Reference Katz and Murphy1992) and Heckman et al. (Reference Heckman, Lochner and Taber1998), unskilled labour N u(t) and skilled labour N s(t) are taken to be imperfect substitutes with a constant substitution elasticity equal to ψ. The production technology takes the following form:
 $$Y(t) = \Phi K(t)^\phi [Z(t)N(t)]^{1 - \phi}, \quad \Phi \gt 0,\quad 0 \lt \phi \lt 1,$$
where Φ is a constant and φ captures the output elasticity of capital. The index of labour-augmenting technological change Z(t) is assumed to grow at an exogenous rate n
Z
.Footnote
2
The stock of capital evolves over time according to
 $\dot K(t) = I(t) - \delta _KK(t)$
with
 $\dot K(t) \equiv dK(t)/dt$
the rate of change, I(t) the level of investment and δ
K
the depreciation rate. The profit flow of the firm at time t is then given by Π(t) = Y(t) − (r(t) + δ
K
)K(t) − w(t)N(t), where r(t) is the return to capital or interest rate and w(t) is the (minimum) unit cost of effective labour. Profit maximization gives rise to the usual marginal productivity conditions:
 $$r(t) + \delta _K = \phi \Phi \left( {\displaystyle{{K(t)} \over {Z(t)N(t)}}} \right)^{\phi - 1},$$
 $$\displaystyle{{w(t)} \over {Z(t)}} = (1 - \phi )\Phi \left( {\displaystyle{{K(t)} \over {Z(t)N(t)}}} \right)^\phi. $$
It follows that a higher capital intensity K(t)/[Z(t)N(t)] is associated with a lower return to capital and a higher return to effective labour. The corresponding rental rate of unskilled labour w u (t) and skilled labour w s (t) have to satisfy:
 $$\displaystyle{{w^u(t)} \over {Z(t)}} = \displaystyle{{w(t)} \over {Z(t)}}\beta \left( {\displaystyle{{N^u(t)} \over {N(t)}}} \right)^{ - 1/\psi}, $$
 $$\displaystyle{{w^s(t)} \over {Z(t)}} = \displaystyle{{w(t)} \over {Z(t)}}(1 - \beta )\left( {\displaystyle{{N^s(t)} \over {N(t)}}} \right)^{ - 1/\psi}. $$
The more scarce a specific skill type is in production, the greater is its return. Profits are equal to zero as a result of the linear homogeneity of the production function.
2.2 Individuals
The economy is inhabited by overlapping generations of finitely-lived individuals with perfect foresight. During the initial years of life no relevant decisions are made.Footnote
3
After reaching the age of majority M the adult individual learns his or her utility cost of schooling θ. He or she then decides whether to obtain a college degree and thereby become a skilled worker. We introduce a dummy variable
 $d_s^j $
that equals 1 if j = s (‘skilled’) and zero; if j = u (‘unskilled’). Expected lifetime utility for an individual of skill type j born at time v whose cost of education is θ is given by:
 $$\Lambda ^j(v \vert \theta ) = \int_{v + M}^{v + \bar D} \left[ {\ln c^j(v,t) + \chi \displaystyle{{\ell ^j{(v,t)}^{1 - \sigma} - 1} \over {1 - \sigma}}} \right]e^{ - \rho [t - v - M]}S(M\!,t - v){\kern 1pt} dt - \theta d_s^j, $$
where c
j
(v, t) is consumption at time t and ℓ
j
(v, t) is leisure. The parameter ρ is the pure rate of time preference and σ determines the curvature of the felicity from leisure. The function S(u
1, u
2) captures the probability of surviving from age u
1 to u
2 > u
1. We assume that everyone dies for certain at or before the maximum age
 $\bar D$
.
A college education takes
 $\bar E$
years, so that the age at labour market entry for an individual of skill type j is
 $E^j = M + \bar Ed_s^j $
. Assuming that the time endowment equals one, leisure is defined as:
 $$\ell ^j(v,t) = \left\{ {\matrix{ {1 - \bar e} & {{\rm for}\;M \le t - v \lt E^j} \cr {1 - \bar l} & {{\rm for}\;E^j \le t - v \lt R^j(v)} \cr 1 & {{\rm for}\;R^j(v) \le t - v \le \bar D} \cr}} \right.$$
During the education period the time required for study is
 $0 \lt \bar e \lt 1$
and it is not possible to work. We assume that labour supply is indivisible in the sense that an individual works a fixed amount of
 $\bar l$
hours (full-time) from labour market entry until retirement at a chosen age R
j
(v). As in Heijdra and Romp (Reference Heijdra and Romp2009), Kalemli-Ozcan and Weil (Reference Kalemli-Ozcan and Weil2010) and d'Albis et al. (Reference d'Albis, Lau and Sánchez-Romero2012) the retirement decision is taken to be irreversible.
The initial stock of human capital is given by:
 $$h^j(v,v + E^j) = 1 + \zeta d_s^j, \quad \zeta \gt 0,$$
where ζ captures the return to a college education. Over the life cycle human capital evolves as follows:
 $$\displaystyle{{{\dot h}^j(v,t)} \over {h^j(v,t)}} = \gamma ^j(t - v)l^j(v,t) - \delta _h^j (t - v),$$
where
 $\dot h^j(v,t) \equiv \partial h^j(v,t)/\partial t$
and
 $l^j(v,t) = \bar l$
when the individual is working and 0 otherwise. A person of age u ≡ t − v and skill type j who is active in the labour market accumulates human capital in the form of learning-by-doing or experience at rate γ
j
(u). However, at the same time his or her existing stock of knowledge depreciates at rate
 $\delta _h^j (u)$
. This means that both the stock of human capital and its rate of growth depend on the individual's age.
There is no clear consensus regarding the empirical relationship between age and labour productivity. This is partly a result of the fact that we cannot directly measure productivity and that the best proxy available, the hourly wage rate, is not observed for individuals who are already retired. The census data that we use to parameterize the model show that the rate of wage growth decreases during working ages (see below), which implies that either the rate of experience accumulation should decline with age or the depreciation rate should go up. Recent empirical evidence from Jeong et al. (Reference Jeong, Kim and Manovskii2014) suggests that there are no decreasing returns to accumulating experience. We interpret this to mean that
 $\gamma\,^j(u) = \gamma\,_0^j $
does not depend on age while the deprecation rate does and parameterize our model accordingly (see below). However, this assumption is not crucial to our findings: what matters is that the overall productivity growth rate
 $\gamma\,^j(u)\bar l - \delta ^h(u)$
depends negatively on u.Footnote
4
Solving (10) given the initial condition (9) yields for t ≥ v + E j :
 $$h\,^j(v,t) = [1 + \zeta d_s^j ]e^{\int_{v + E^j}^t \left[ {\gamma_0{^j} l^j(v,\tau ) - \delta_h{^j} (\tau - v)} \right]{\kern 1pt} d\tau}. $$
Individuals enter adulthood without any assets such that a j (v, v + M) = 0. The accumulation of savings over time proceeds according to:
 $$\dot a\,^j(v,t) = r(t)a\,^j(v,t) + I^j(v,t) + q(v,t) + p(v,t) - c\,^j(v,t),$$
where
 $\dot a\,^j(v,t) \equiv \partial a^j(v,-{t})/\partial t$
and I
j
(v, t) ≡ (1 − τ(t))w
j
(t)h
j
(v, t)l
j
(v, t) is after-tax wage income earned at time t. There is a proportional labour tax τ(t) which is used to finance pension payments p(v, t) to eligible individuals. We assume that there are no annuities or life-insured loans available so that the return on financial assets is the real rate of interest.Footnote
5
The assets left behind by individuals who pass away are redistributed to those who are still alive in the form of accidental bequests q(v, t). If there is uncertainty about whether a person might die and there is no life insurance available then individuals cannot borrow money for fear that they will default on their loan. In order to allow people to borrow funds to finance their education we assume that survival is certain up to age F > M.Footnote
6
For the remainder of life there is a borrowing constraint such that a
j
(v, t) ≥ 0.
An individual of a given skill type has to determine the level of consumption at each moment in time c j (v, t) and the age at retirement R j (v) so as to maximize expected life-time utility (7) given the process of human capital accumulation (10) and the budget identity (12). Assuming that the borrowing constraint does not bind, the first-order condition for consumption can be written as:
 $$\displaystyle{1 \over {c^j(v,t)}}e^{ - \rho [t - v - M]}S(M\!,t - v) = \lambda ^j(v)e^{-\int_{v + M}^t r(\tau )d\tau}. $$
At any given moment in time, the marginal utility of consumption (left-hand side) should equal the corresponding marginal cost in terms of reduced life-time wealth (right-hand side) with λ j (v) its shadow price.
The first-order condition for the retirement age is given by:
 $$- \chi \displaystyle{{{(1 - \bar l)}^{1 - \sigma} - 1} \over {1 - \sigma}} e^{ - \rho [R^j(v) - M]}S(M\!,R^j(v)) = \lambda ^j(v)I^j(v,v + R^j(v))e^{-\int_{v + M}^{v + R^j(v)} r(\tau ){\kern 1pt} d\tau}. $$
The left-hand side is the increased felicity from leisure, while the right-hand side captures the utility cost of foregone earnings. We discuss the retirement decision in more detail in Section 3 below.
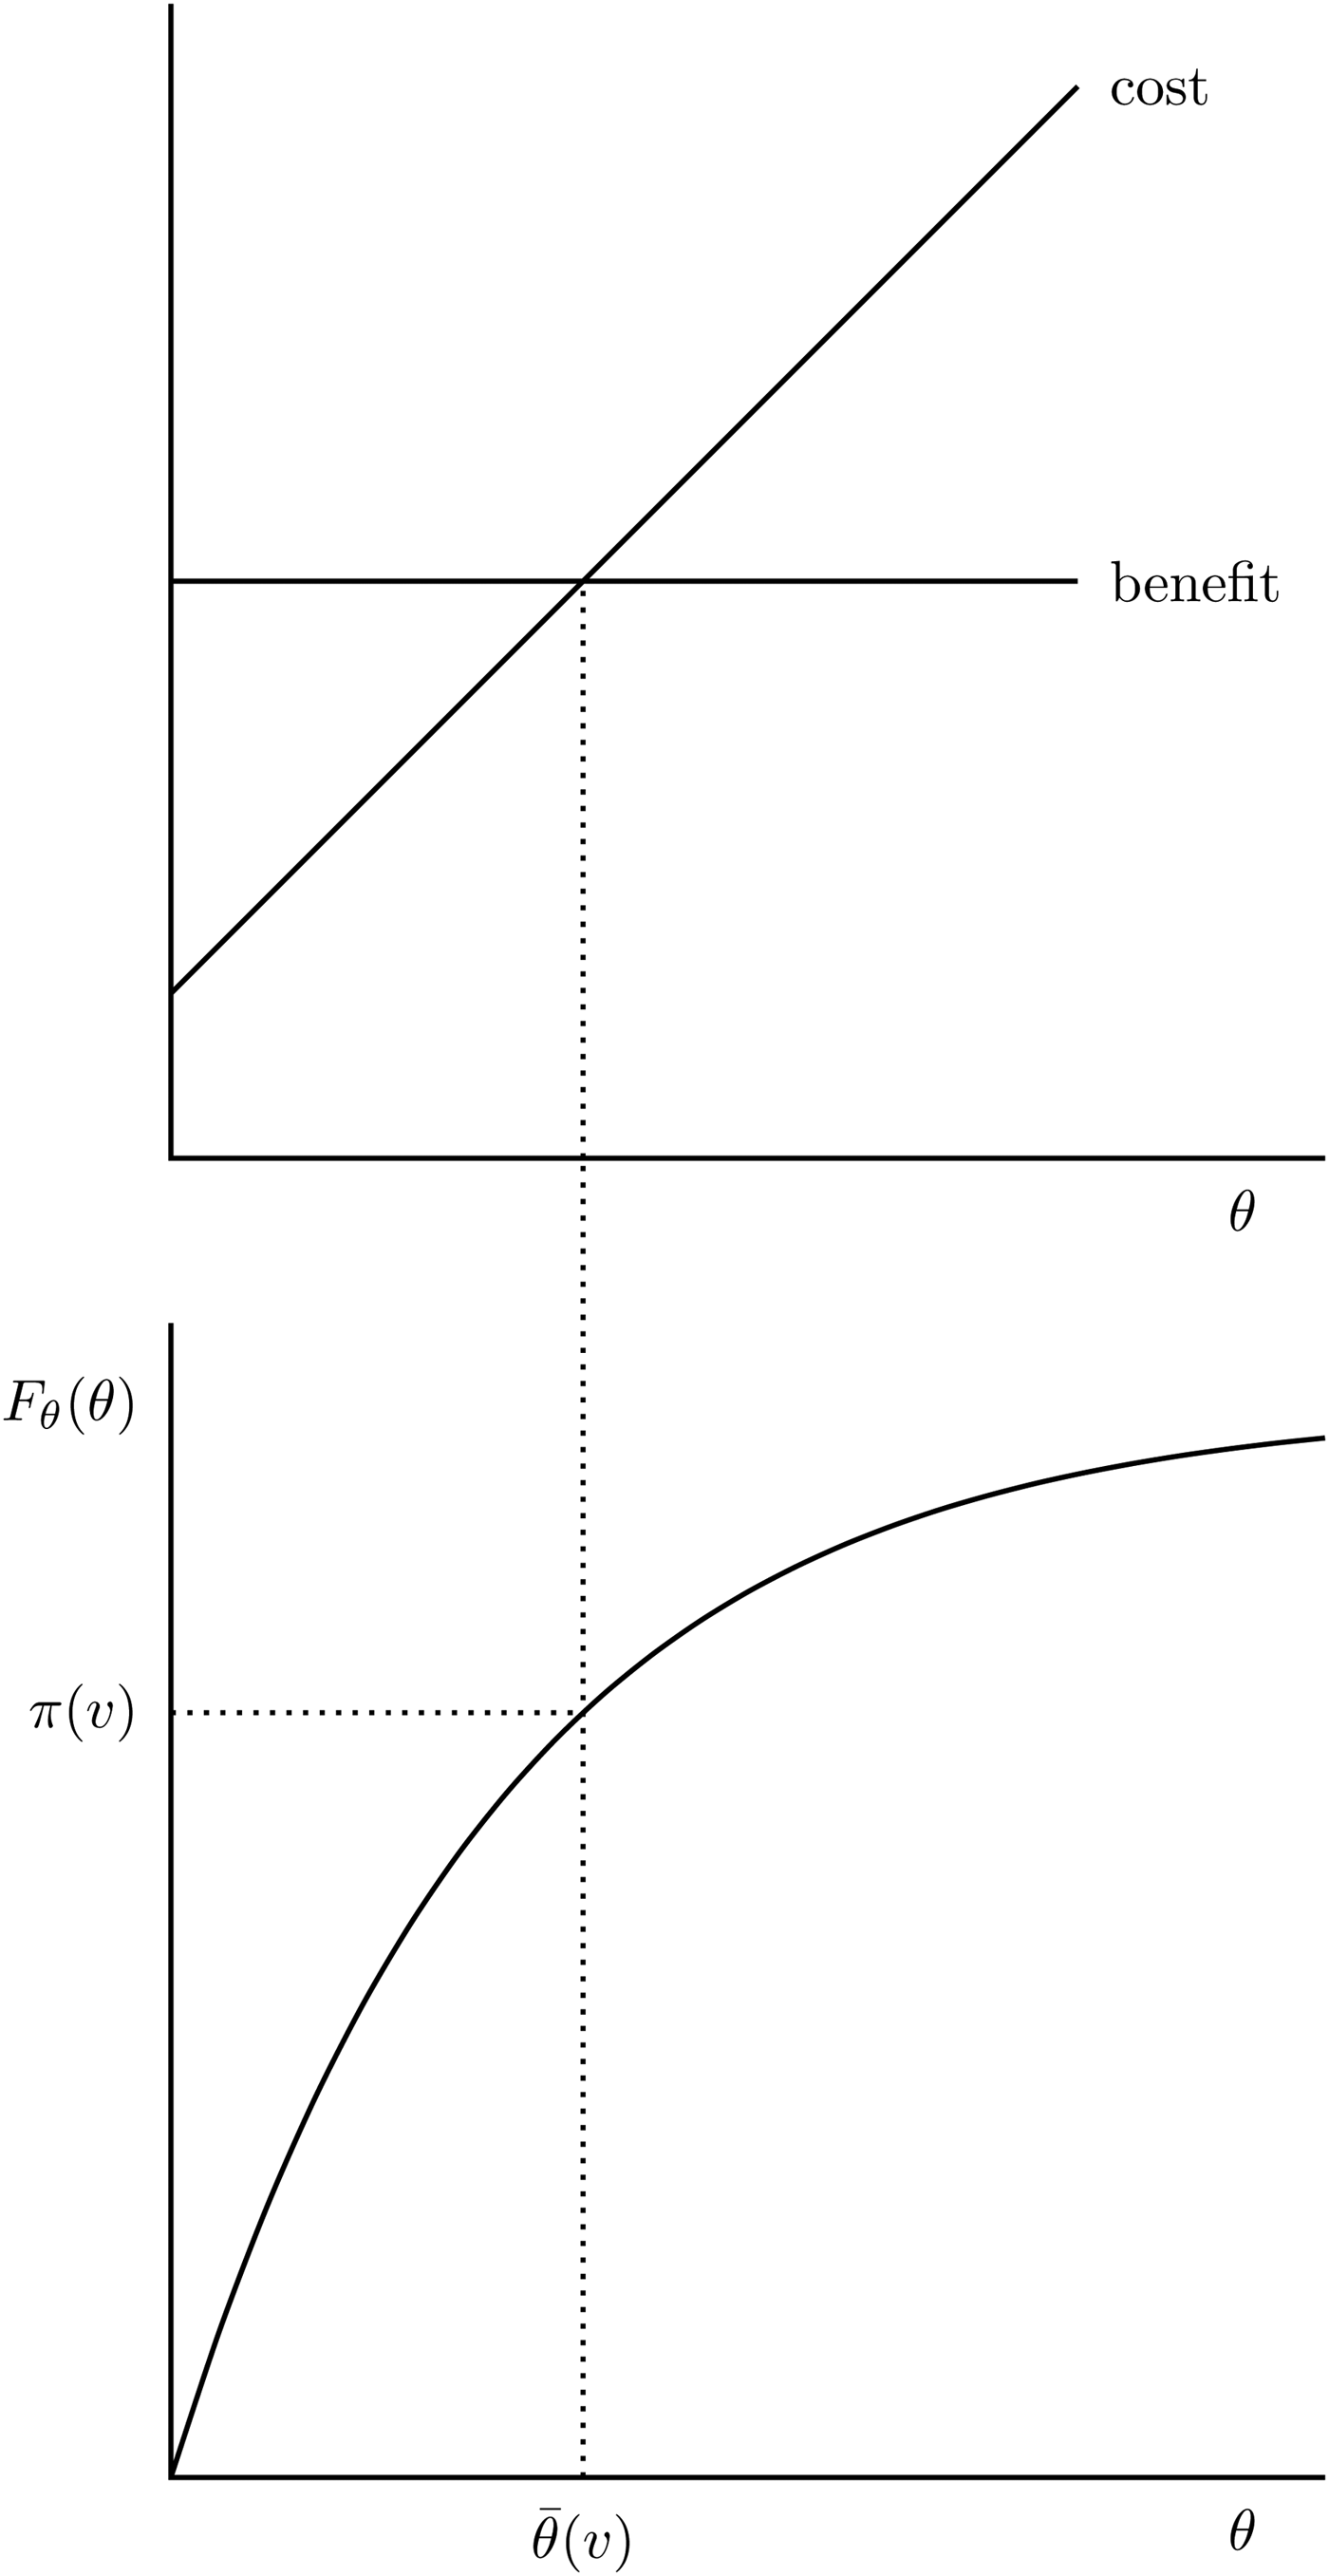
Finally, each individual has to decide whether or not to become skilled. In doing so he or she weighs the costs against the benefits. The costs of an education are threefold. First, leisure during schooling years is reduced by the time required for studying. Second, the individual has to postpone entry into the labour market and therefore loses potential wage income. Third, there is a ‘psychic’ or effort cost of studying equal to θ. The benefit of an education is that it increases human capital and thereby the return to labour. As the cost is increasing in θ, while the benefit is independent of it, the optimal education choice is governed by a threshold rule. See the upper panel of Figure 2. For a cohort born at time v there is a value
 $\bar \theta (v)$
such that all individuals for whom
 $\theta \le \bar \theta (v)$
will decide to obtain a college degree, while all individuals with
 $\theta \gt \bar \theta (v)$
remain uneducated. It follows that the fraction of skilled individuals in this cohort equals
 $\pi (v) = F_\theta (\bar \theta (v)),$
where F
θ
is the cumulative distribution function of the utility cost of education; see the lower panel of Figure 2.Footnote
7
Optimal choice of education.

2.2.1 Demography and aggregation
At a given time t, the size of the cohort of vintage v is denoted by P(v, t). Over time cohort members pass away so that:
 $$P(v,t) = \left\{ {\matrix{ {P(v,v)S(0,t - v),} & {{\rm for}\;0 \le t - v \le \bar D,} \cr {0,} & {{\rm for}\;t - v \gt \bar D.} \cr}} \right.$$
The size of the total population
 $P(t) = \int_{t - \bar D}^t P(v,t){\kern 1pt} dv$
is found by summing over all living cohorts. We assume that the economy is in a demographic steady state in which the crude birth rate b = P(t, t)/P(t) and the population growth rate
 $n_P = \dot P(t)/P(t)$
are constant. This gives rise to the following equilibrium condition:Footnote
8
 $$\displaystyle{1 \over b} = \int_0^{\bar D} e^{ - n_Pu}S(0,u){\kern 1pt} du,$$
Given the demographic structure of the population we can calculate aggregate values of effective labour, consumption and financial assets by skill type:
 $$C^j(t) = \int_{t - \bar D}^{t - M} c^j(v,t)P^j(v,t){\kern 1pt} dv,$$
 $$L^j(t) = \int_{t - \bar D}^{t - M} h^j(v,t)l^j(v,t)P^j(v,t){\kern 1pt} dv,$$
 $$A^j(t) = \int_{t - \bar D}^{t - M} a^j(v,t)P^j(v,t){\kern 1pt} dv,$$
where P s (v, t) = π(v)P(v, t) is the fraction of skilled individuals in a given cohort and P u (v, t) = [1 − π(v)]P(v, t) is the fraction of unskilled. It follows that total consumption and financial assets are given by C(t) = C u (t) + C s (t) and A(t) = A u (t) + A s (t), respectively.
2.3 Accidental bequests
In the absence of life insurance individuals will pass away with a positive stock of financial wealth. The way in which these accidental bequests are distributed among survivors has nontrivial general equilibrium repercussions; see Heijdra et al. (Reference Heijdra, Mierau and Reijnders2014). We take a conservative stance and assume that every adult receives the same amount, so that
 $q(v,t) = \overline q (t)$
. The balanced budget condition then becomes:
 $$\int_{t - \bar D}^{t - M} \mu (t - v)[a^u(v,t)P^u(v,t) + a^s(v,t)P^s(v,t)]{\kern 1pt} dv = \overline q (t)\int_{t - \bar D}^{t - M} P(v,t){\kern 1pt} dv,$$
where μ(u) is the mortality rate at age u:
 $$\mu (u) \equiv - \displaystyle{{\partial S(u_1\!,u)/\partial u} \over {S(u_1\!,u)}}.$$
Total assets left behind (left-hand side) should equal total bequests (right-hand side).
2.4 Pensions
We introduce a stylized PAYG pension system that provides a benefit to every person over the age of
 $\bar R$
(the statutory retirement age), so that
 $p(v,t) = \overline p (t)$
for
 $t - v \ge \bar R$
and zero otherwise. The system is unfunded in the sense that there are no assets but instead benefits are paid out of current contributions by workers:
 $$\tau (t)[w^u(t)L^u(t) + w^s(t)L^s(t)] = \overline p (t)\int_{t - \bar D}^{t - \bar R} P(v,t){\kern 1pt} dv.$$
Note that we assume that every elderly individual receives the pension benefit regardless of whether he or she is still working. In this way, we prevent large distortions of the retirement decision. In contrast, the real-life pension system might provide strong incentives for retirement at or close to the statutory age (see, for example, Heijdra and Romp (Reference Heijdra and Romp2009)).
2.5 Macroeconomic equilibrium
We restrict attention to the long-run equilibrium of the model. A macroeconomic steady state or balanced growth path is a sequence of prices and allocations such that:
-
(i) Individuals maximize expected lifetime utility taking prices as given.
-
(ii) Firms maximize profits taking prices as given.
-
(iii) All markets clear.
-
• Capital market:
 $$K(t) = A(t).$$
-
• Goods market:
$$Y(t) = C(t) + I(t).$$
-
• Labour market:
$$N^u(t) = L^u(t),\quad N^s(t) = L^s(t).$$
-
-
(iv) All variables grow at a constant rate, possibly zero.


Our choice of the utility function ensures that the balanced growth path exists; see King et al. (Reference King, Plosser and Rebelo2002). In the steady state, the share of skilled workers is the same across cohorts and so is the optimal retirement age for each skill type. Total output, consumption and savings grow at rate n Z + n P , effective labour grows at rate n P , wages, pensions and bequests grow at rate n Z and the interest rate is constant over time.
3 The optimal retirement age
When studying the general equilibrium effects of a longevity shock below, changes in the retirement age play an important role. Therefore we discuss in some more detail how the optimal (steady-state) retirement age is determined in the model.
By using (13) in (14) we find that the optimal retirement age R* has to satisfy:Footnote 9
 $$- \displaystyle{{\chi ({(1 - \bar l)}^{1 - \sigma} - 1)/(1 - \sigma )} \over {1/c^j(v,v + R^*)}} = I^j(v,v + R^*).$$
Recall that there is only a labour supply decision at the extensive margin: an individual works either 0 or
 $\bar l$
hours. Under this assumption, the left-hand side of (20) can be seen as the ‘marginal rate of substitution’ (MRS) between leisure and consumption at age R*. It is not really ‘at the margin’ because of the indivisibility of labour, but it captures a similar notion. The numerator is the discrete change in felicity when labour supply changes from
 $\bar l$
to 0, while the denominator equals the marginal utility of consumption.Footnote
10
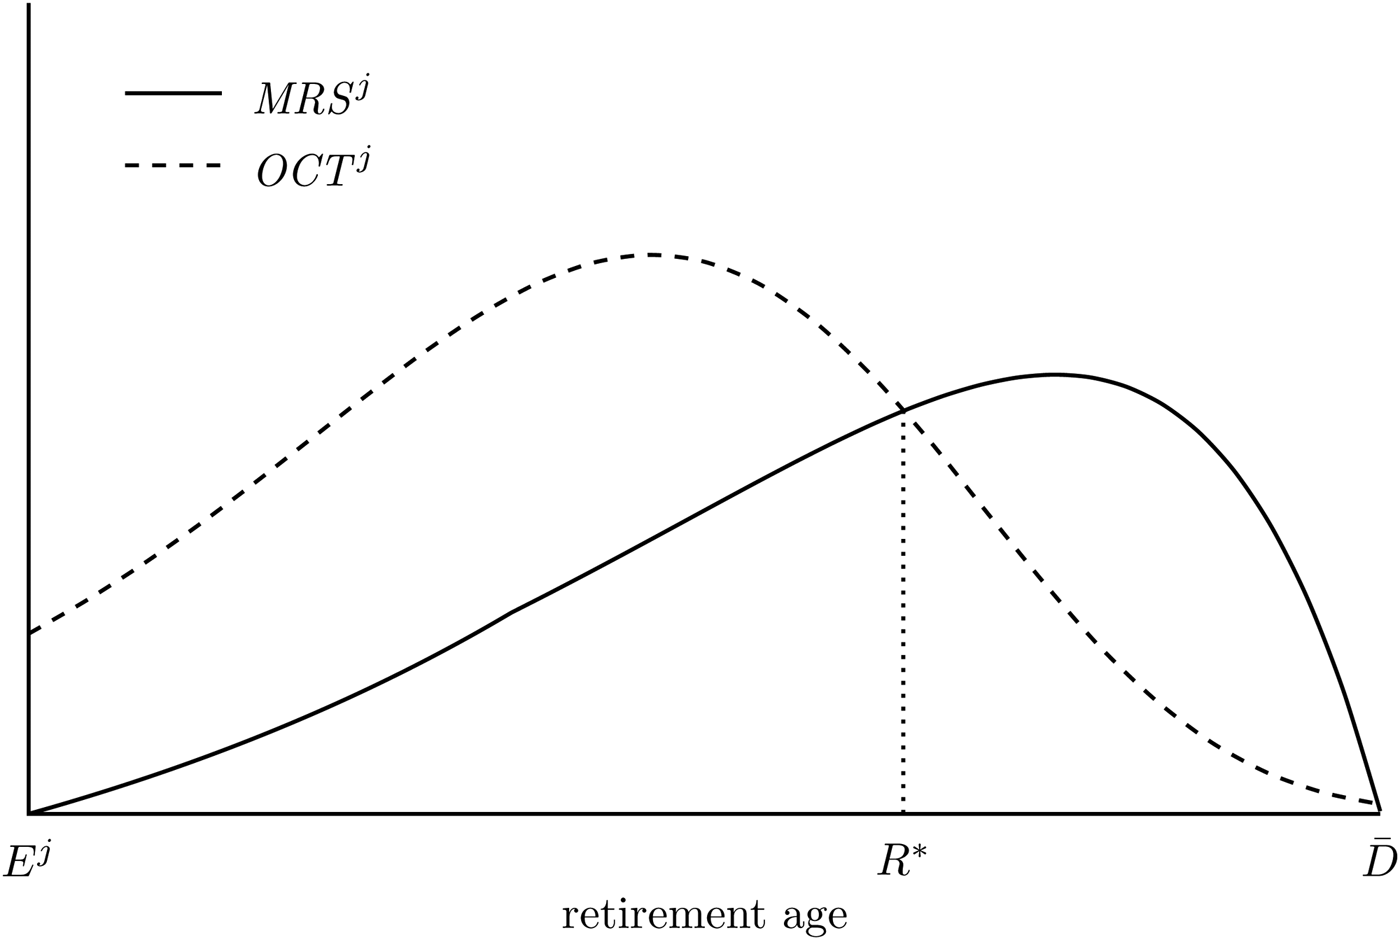
The right-hand side of (20) represents the ‘opportunity cost of time’ (OCT) in terms of foregone labour earnings. At the optimal retirement age R* the individual is exactly indifferent between working and not working.
In order to derive analytical results we focus on the steady state with a constant interest rate r and growth rate of wages n Z . We assume that there are no pensions and no accidental bequests and that the borrowing constraint never binds. The lifetime budget constraint can then be written as:
 $$\int_{v + M}^{v + \bar D} c^j(v,t)e^{ - r[t - v - M]}{\kern 1pt} dt = \int_{v + M}^{v + \bar D} I^j(v,t)e^{ - r[t - v - M]}{\kern 1pt} dt.$$
The discounted value of all consumption expenditures during life (left-hand side) has to be covered by total wage income (right-hand side). For any possible retirement age R we define:
 $$MRS^j(R) = - \chi \displaystyle{{{(1 - \bar l)}^{1 - \sigma} - 1} \over {1 - \sigma}} \displaystyle{{e^{(r - \rho )[R - M]}S(M\!,R)} \over {\int_M^{\bar D} e^{ - \rho [u - M]}S(M\!,u){\kern 1pt} du}}\int_{E^j}^R \hat{I}^j(u)e^{ - r[u - M]}du,$$
 $$OCT^j(R) = \hat{I}^j(R),$$
where
 $\hskip7pt \hat{I}^j(u)$
is wage income earned at age u relative to wage income at labour market entry:
 $$\hat{I}^j(u) \equiv \displaystyle{{I^j(v,v + u)} \over {I^j(v,v + E^j)}} = \left\{ {\matrix{ {e^{\int_{E^j}^u \left[ {n_Z + \gamma _0^j \bar l - \delta _h^j (s)} \right]{\kern 1pt} d,s,}} & {{\rm if}\;E^j \le u \le R,} \cr {0,} & {{\rm otherwise}{\rm.}} \cr}} \right.$$
The optimal retirement age satisfies MRS(R*) = OCT(R*). This follows from (20) after dividing both sides by I j (v, v + E j ) and substituting for the optimal level of consumption at retirement given the budget constraint (21). The resulting expressions do not depend on the year of birth v, so that in the steady state the optimal retirement age will be the same for all cohorts (as was asserted above).
In Figure 3, we visualize the two profiles. Note that with a constant felicity of leisure during the working career, MRS
j
essentially follows the dynamics of consumption at retirement. According to (22) consumption is increasing in lifetime income and the probability of survival. It equals zero when R = E
j
(as there is no income) and when
 $R = \bar D$
(as death is certain). The first derivative satisfies:
 $$\displaystyle{{\partial MRS^j(R)} \over {\partial R}} = \left[ {r - \rho - \mu (R) + \displaystyle{{{\hat{I}}^j(R)e^{ - r[R - M]}} \over {\int_{E^j}^R {\hskip7pt \hat{I}}^j(u)e^{ - r[u - M]}{\kern 1pt} du}}} \right]MRS^j(R).$$
Optimal retirement age.

At young ages the increase in labour earnings following an extension of the work career dominates the decrease in the probability of survival, so that consumption at retirement goes up. At older ages this reverses and the expression in (25) becomes negative.Footnote 11
The OCT j profile mimics the hump-shaped pattern of wages over the life cycle. It satisfies:
 $$\displaystyle{{\partial OCT^j(R)} \over {\partial R}} = [n_Z + \gamma\,_0^j \bar l - \delta\,_h^j (R)]OCT^j(R),$$
where
 $\delta\,_h^j (R)$
is increasing in R. The opportunity cost of time is normalized to unity when R = E
j
and is non-negative for
 $R = \bar D$
.
As long as the opportunity cost of time exceeds the MRS between leisure and consumption the individual keeps working. The point of intersection between the two profiles determines the optimal retirement age. The following proposition describes how the retirement age is affected by a change in longevity, human capital depreciation or factor prices.
Proposition 1
(Comparative static effects on the retirement age). Suppose that there are no pensions and bequests and that the borrowing constraint never binds. Assume that there is an interior solution for the optimal retirement age in the steady state. Keeping everything else constant we have that for both skill types:
-
(i) An increase in the survival probabilities has an ambiguous effect on the retirement age.
-
(ii) A decrease in the human capital depreciation rate has an ambiguous effect on the retirement age.
-
(iii) An increase in the interest rate leads to a decrease in the retirement age.
-
(iv) An increase in the wage rate does not affect the retirement age.
Proof
See Appendix A.
In general, we cannot say whether an improvement in the probability of survival prompts individuals to retire earlier or later. Note that in this case only the MRS
j
profile is affected and not the OCT
j
curve. For any possible retirement age there is a positive effect on the level of consumption at that age due to the increased chances of being alive, but there is also a negative effect as financial resources have to be spread over a longer (expected) life time. In the special case that mortality is unchanged at working ages but drops for elderly individuals, only the latter effect is present, so that consumption decreases and retirement is postponed.Footnote
12
For example, suppose that S(0, u) = 1 for
 $u \le \bar D$
and S(0, u) = 0 for
 $u \gt \bar D,$
so that there is no mortality risk but a certain length of life. An increase in
 $\bar D$
would then result in an increase in the retirement age.
In contrast to a longevity boost, a decrease in human capital depreciation at all ages affects both profiles. During the working career human capital is higher at any age, so that there is an increase in the level of wealth (and thereby consumption) as well as the opportunity cost of time. As a result the effect on the retirement age is again ambiguous. Note, however, that a change in the depreciation rate at a certain age affects the level of human capital in the future but not the past. Hence, if improvements in productivity only occur in old age then the retirement age remains unchanged.
A change in the interest rate influences the price of consumption and leisure at different points in time and thereby has both an income and substitution effect on the optimal length of the retirement period (which can be seen as the purchase of leisure). In addition, it determines the extent to which future income is discounted in life-time wealth. The overall effect is such that a higher interest rate leads to earlier retirement.
The fact that changes in the wage rate do not influence the retirement decision is a consequence of the fact that the utility function satisfies the King-Plosser-Rebelo conditions (see King et al. (Reference King, Plosser and Rebelo2002)). These ensure that the income and substitution effect of a proportional wage change on labour supply exactly cancel out. This is necessary for a steady state with positive wage growth and a constant retirement age to exist.
4 Parameterization
In the next section, we will study the long-run effect of a longevity shock on individual choices and macroeconomic outcomes. As it is not possible to solve for the equilibrium of the model in closed form we will complement the analytical insights from the previous section with a simple quantitative exercise. To that end we choose plausible values for the demographic and economic parameters in line with the USA in the year 2010.
4.1 Demographic parameters
We set the age of majority equal to M = 18. For the survival function we use the functional form suggested by Boucekkine et al. (Reference Boucekkine, de la Croix and Licandro2002) but extend it to the case that there is certain survival up to age F:
 $$S(u_1,u_2) = \left\{ {\matrix{ {1,} & {{\rm for}\;u_2 \lt F,} \cr {\displaystyle{{\eta _0 - e^{\eta _1\max \{ u_2 - F,0\}}} \over {\eta _0 - e^{\eta _1\max \{ u_1 - F,0\}}}},} & {{\rm for}\;F \le u_2 \lt \bar D} \cr {0,} & {{\rm for}\;u_2 \ge \bar D,} \cr}} \right.\quad \eta _0 \gt 1,\quad \eta _1 \gt 0,$$
where u
1 < u
2 and
 $\bar D \equiv F + \ln \eta _0/\eta _1$
. The corresponding life expectancy at birth is given by:
 $${\rm {\opf E}}[D] = \int_0^{\bar D} S(0,u){\kern 1pt} du = F + \displaystyle{1 \over {\eta _1}}\left[ {\displaystyle{{\eta _0\ln \eta _0} \over {\eta _0 - 1}} - 1} \right].$$
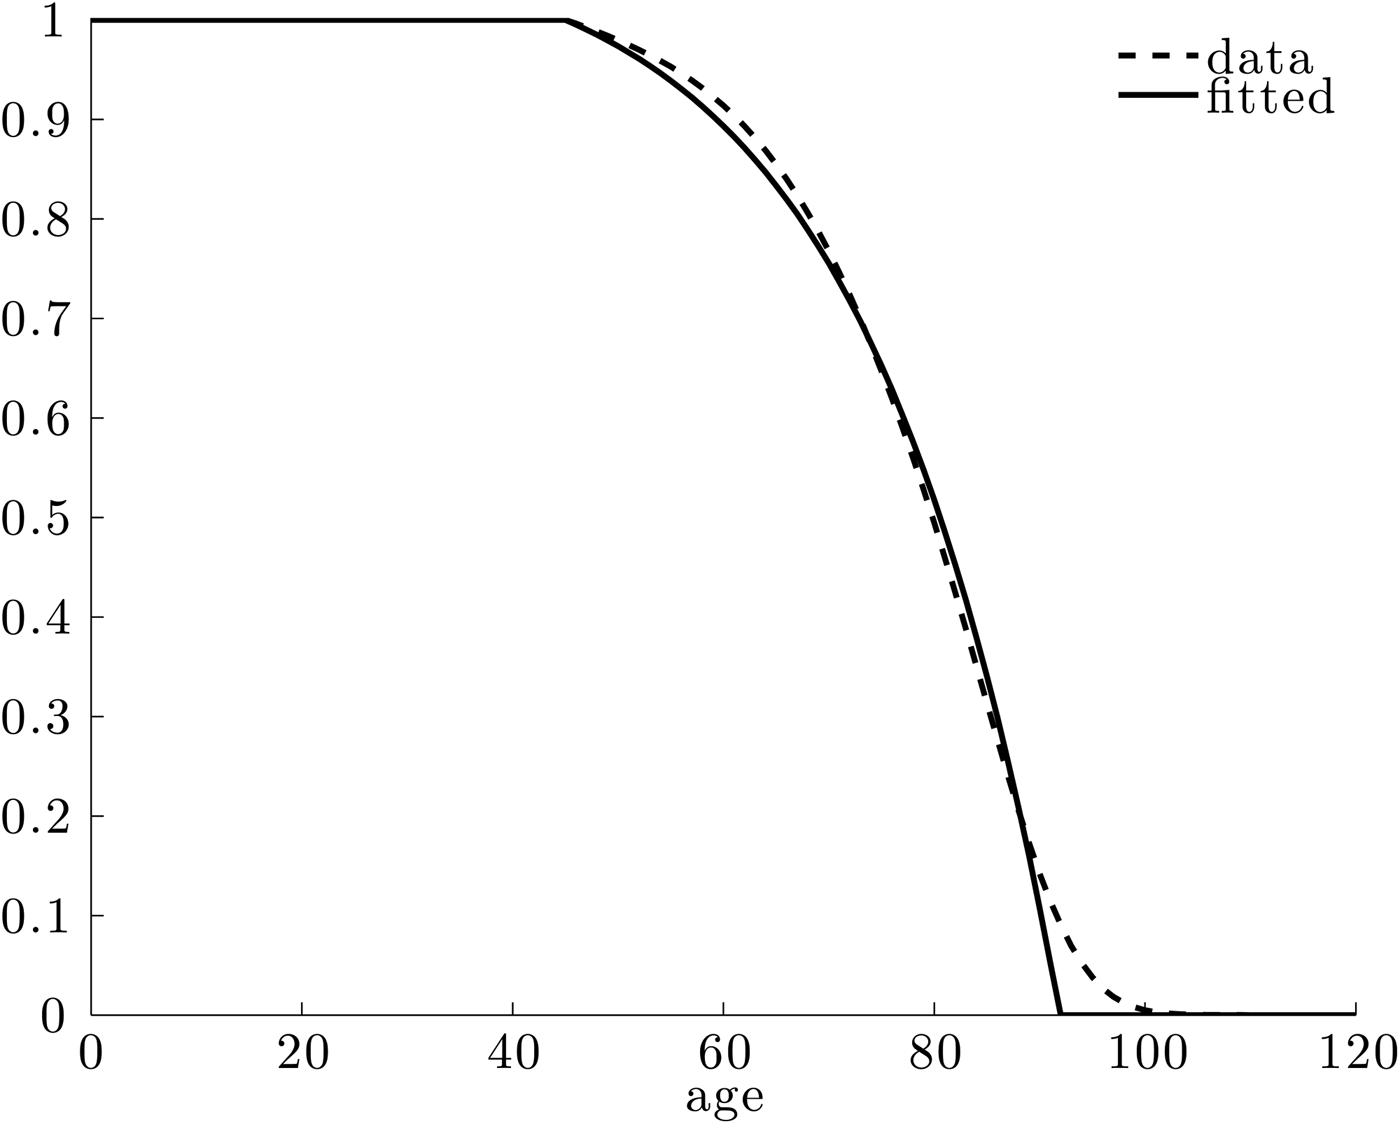
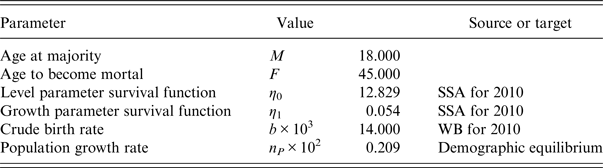
The data on survival probabilities come from the Office of the Chief Actuary of the Social Security Administration (SSA) and is described in Bell and Miller (Reference Bell and Miller2005). We use the period life table for males for 2010. Given that the survival function is very flat and close to 1 up to middle age (see Figure 1 in the introduction) we set F = 45. We divide the number of individuals who are alive at a given age by the corresponding number at age 45 in order to obtain the data profile in Figure 4. The parameters η
0 and η
1 are estimated using nonlinear least squares; see Table 1. The corresponding maximum age is
 $\bar D = 91.906$
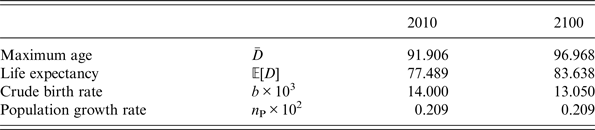
while the expected length of life is 77.489 years.
Fitted survival function for 2010, conditional on survival up to age 45.

Demographic parameters

Sources: SSA is the Social Security Administration of the USA. WB is the World Bank.
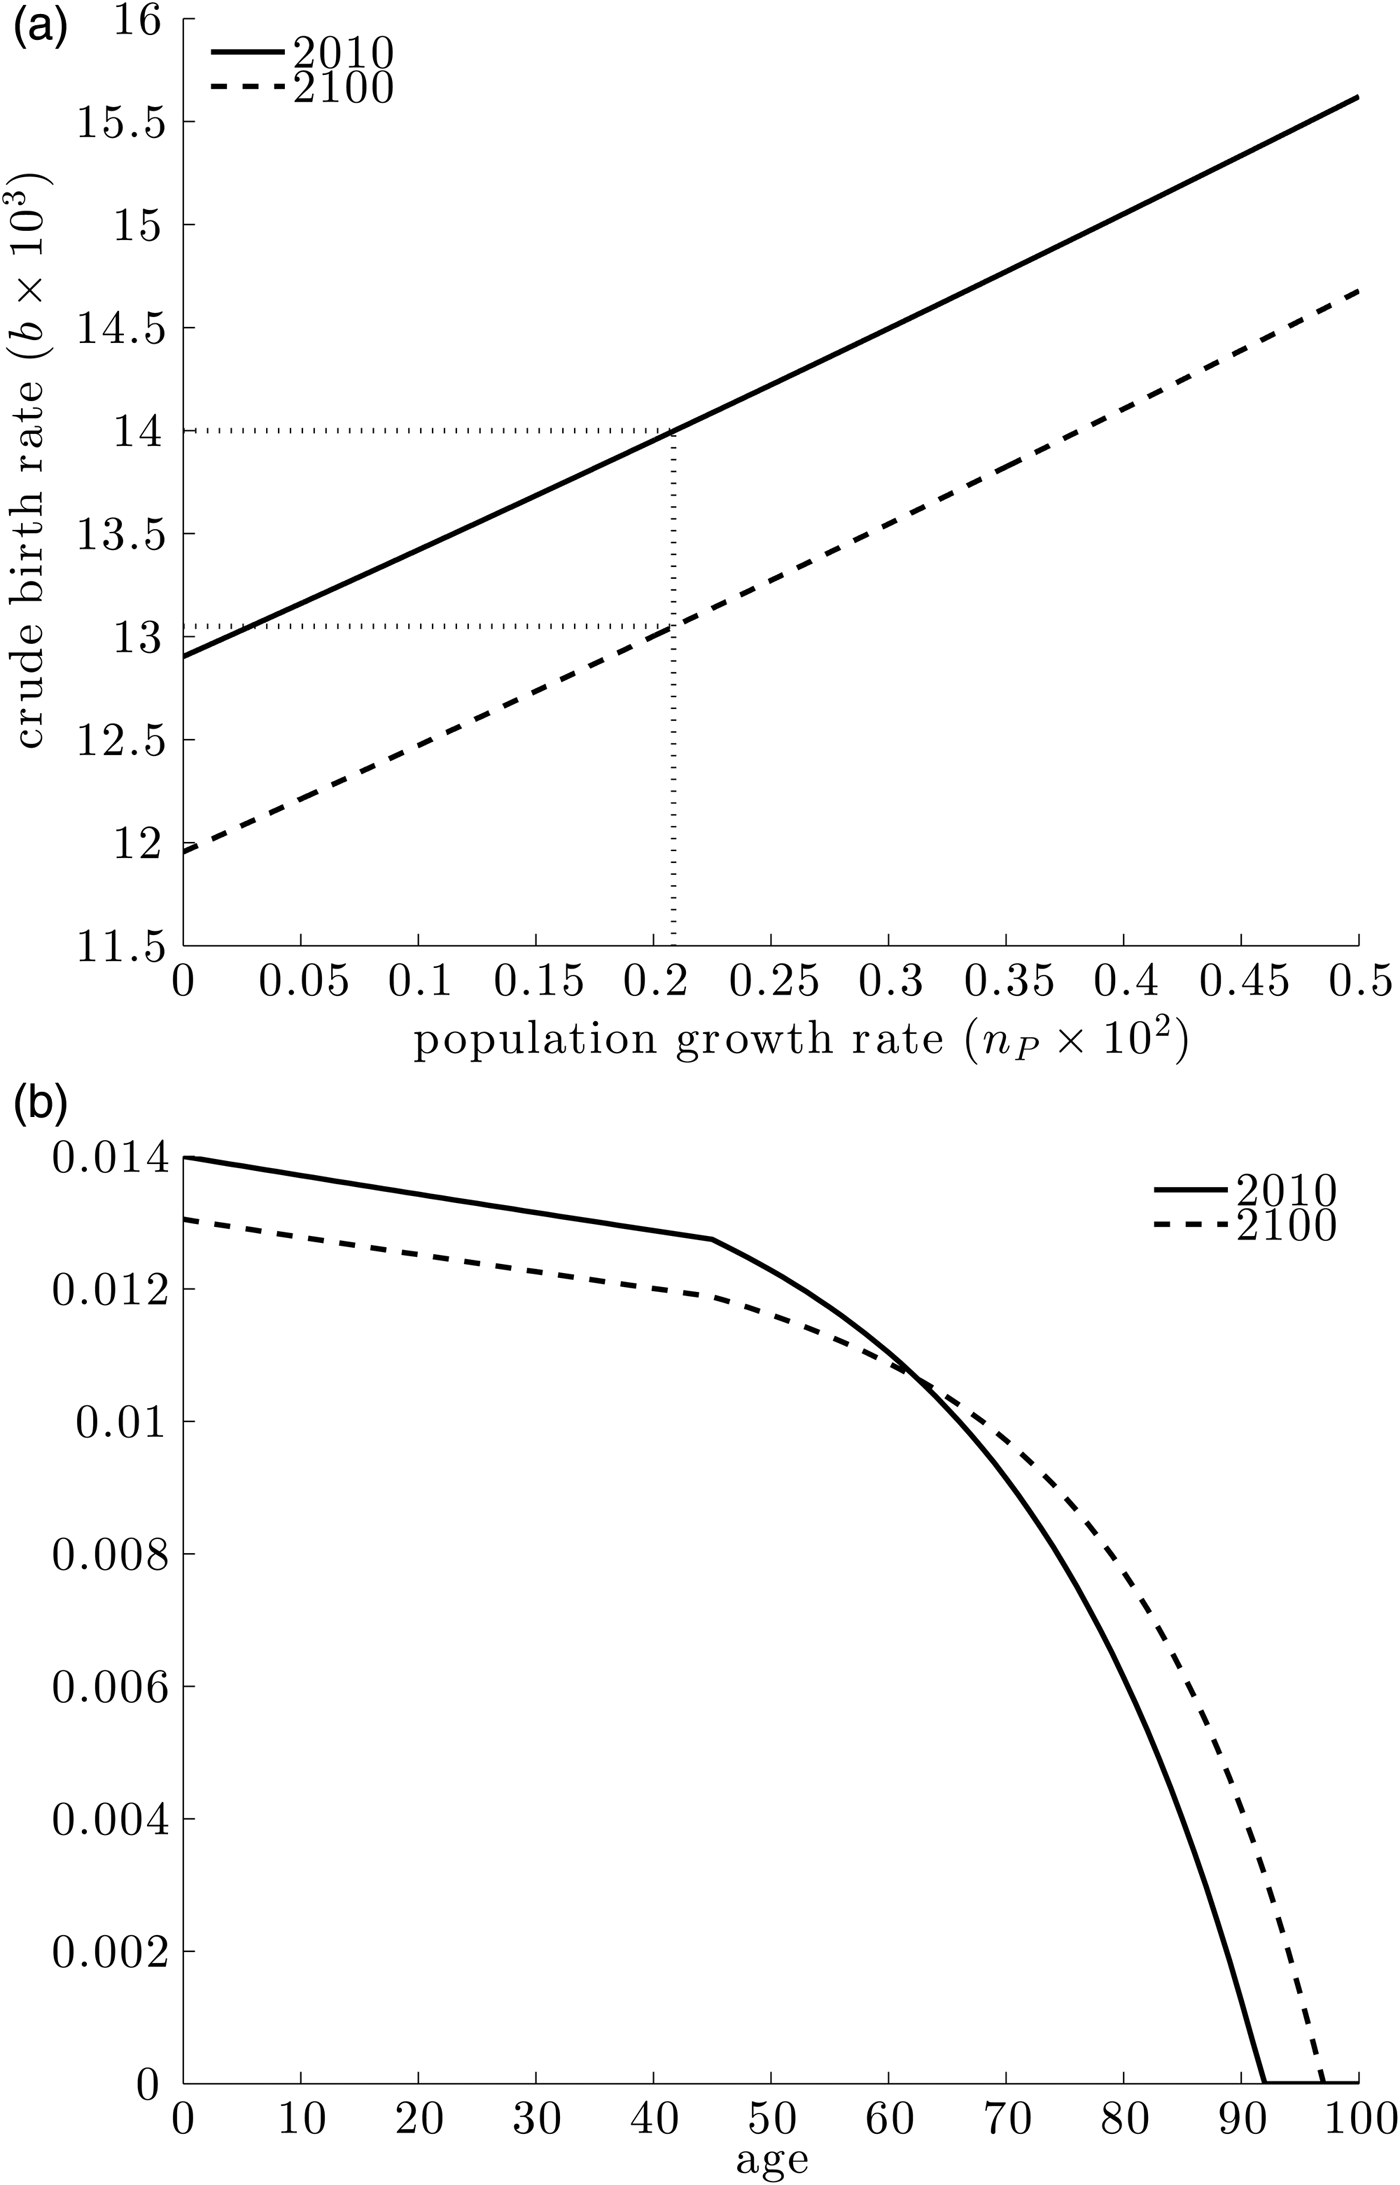
According to the World Bank the crude birth rate for the USA in 2010 is 14 births per 1,000 population. The demographic equilibrium condition (16) then implies that the population growth rate is 0.209%.
4.2 Economic parameters
Even though we do not attempt a full-blown calibration exercise we nevertheless wish to choose the economic parameters of the model in such a way that they are in line with empirical evidence.
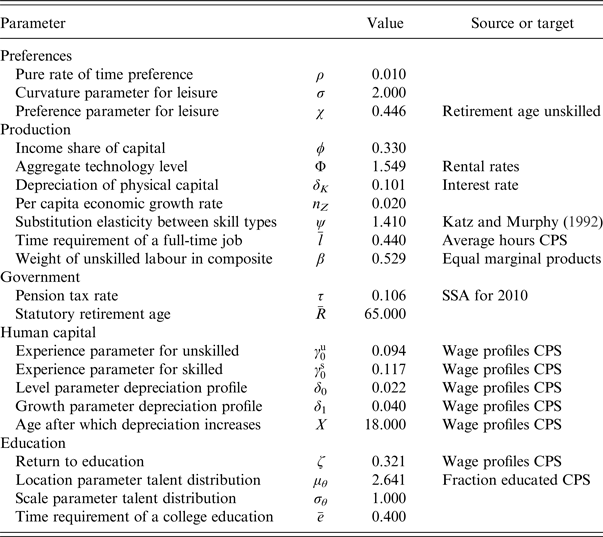
In order to obtain life-cycle profiles for hours worked and the hourly wage earned we follow an approach similar to Wallenius (Reference Wallenius2011). We use data from the Current Population Survey (CPS) for the USA in the years 1976 up to and including 2012 (King et al., Reference King, Ruggles, Alexander, Flood, Genadek, Schroeder, Trampe and Vick2010). The sample is restricted to males that work a positive number of hours, have at least a high school diploma, are born after 1951 and are between the age of 25 and 55. The reason for restricting attention to this age range is to avoid sample selection issues as a consequence of schooling and early retirement. For each individual we have data on the birth year, weeks worked last year, usual hours worked per week, wage and salary income and educational attainment. We construct pseudo panel data by following the different representative samples of individuals with the same year of birth over time. A distinction is made between two skill types: those with at least 4 years of college (the ‘skilled’) and those with less (the ‘unskilled’).
We normalize hours worked to a unit time endowment under the assumption that individuals have 14 hours available for work per day or 98 per week. For a given cohort we find the average number of hours worked at each age by averaging over the corresponding observations using the sampling weights. We then take the average over cohorts by age and skill type; see Figure 5(a). The hours profile is nearly flat between ages 25 and 55 for both skill types, which fits well with our assumption of a labour supply decision at the extensive margin only. We set the time requirement of a full-time job equal to the average value
 $\bar l = 0.440$
.
Data profiles and model fit. (a) Hours worked. (b) Hourly wage. Source: Current Population Survey for the USA, 1976–2012.

We adjust the hourly wages by the consumer price index, so that they are measured in 1999 US dollars and comparable across years. For each cohort we find the average hourly wage at each age by skill type. We then normalize the resulting cohort profiles by the wage at age 25 of the unskilled. After averaging over cohorts we obtain the life-cycle profile depicted in Figure 5(b).Footnote 13
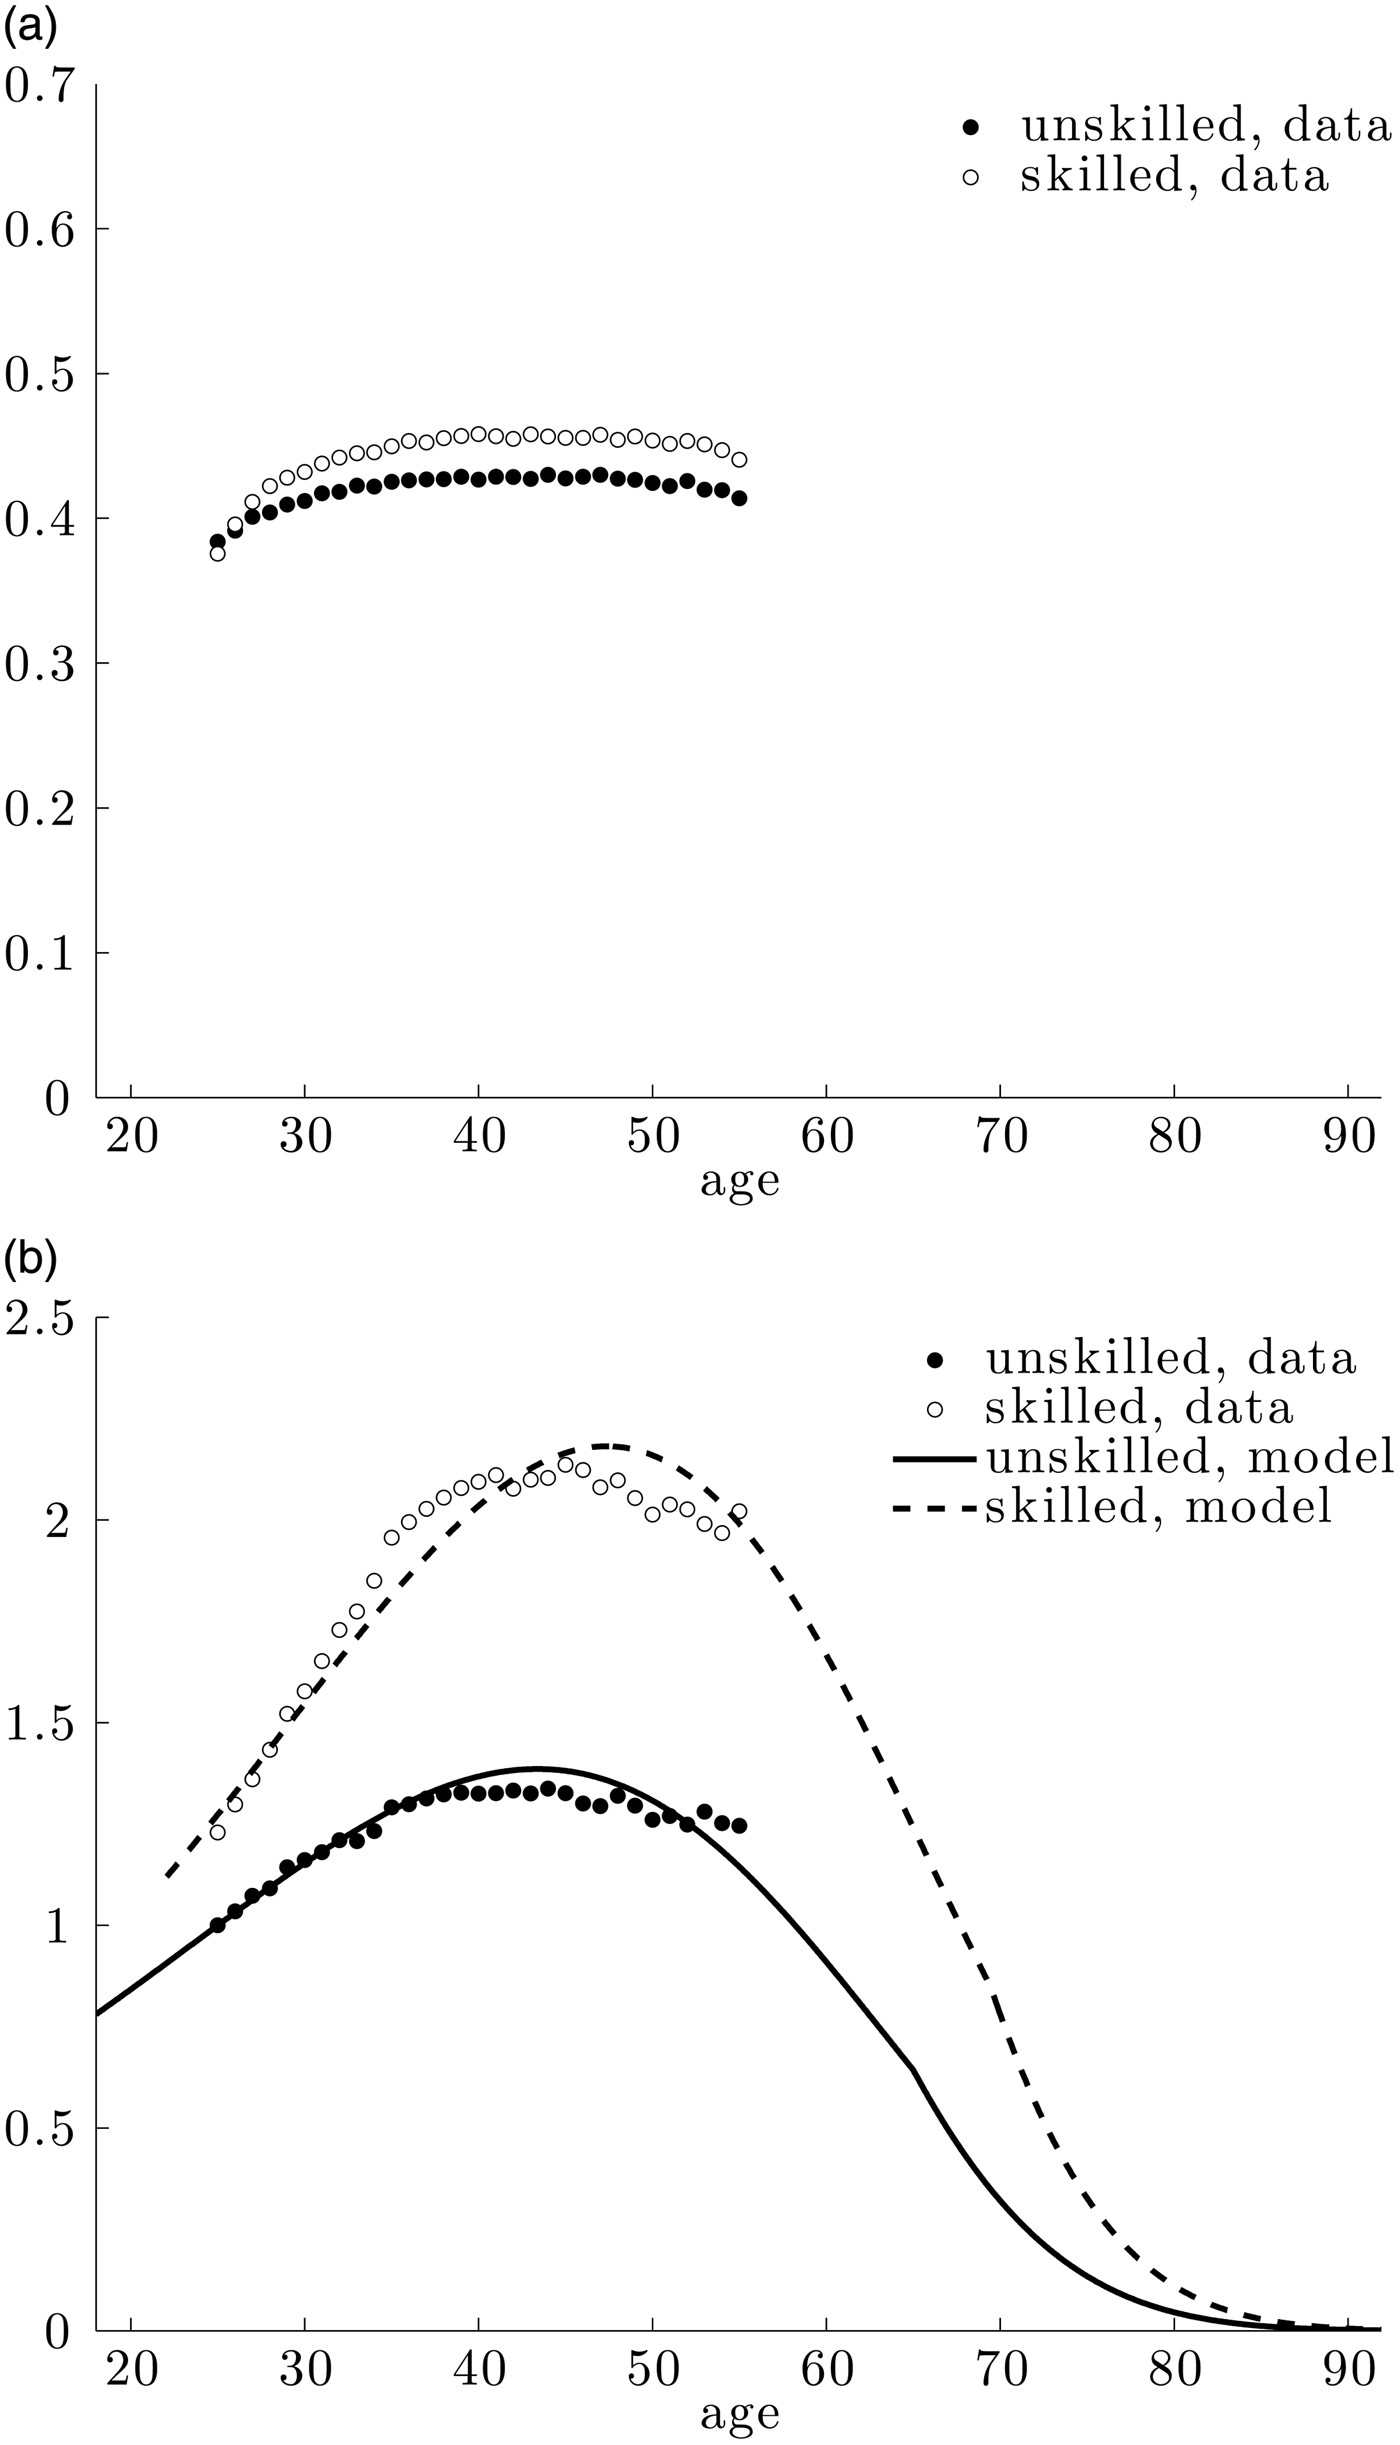
The parameterization then proceeds as follows. We fix the interest rate at 3.5% per year and assume that unskilled and skilled individuals earn the same return per unit of effective labour, which is normalized to unity. The long-run per-capita economic growth rate is 2%. We set the rate of time preference equal to ρ = 0.010 and choose a value for the curvature parameter for the felicity of leisure σ = 2 such that the Frisch labour supply elasticity is about 0.6. The statutory retirement age is 65 and the tax rate on wage income used to finance the pension system is equal to 10.6%, which corresponds to the combined contributions of employers and employees for the US Old Age and Survivors Insurance from 2000 onwards.
We parameterize the experience accumulation and human capital depreciation functions in the following way:
 $$\gamma\,^j(u) = \gamma\,_0^j, \quad \gamma\,_0^j \gt 0,$$
 $$\delta\,_h^j (u) = \delta _0e^{\delta _1\max \{ u - X,0\}}, \quad \delta _0 \gt 0,\quad \delta _1 \ge 0,\quad X \ge M.$$
This is similar to Wallenius (Reference Wallenius2011) but with an age effect in depreciation rather than in experience for reasons alluded to above. By assuming that the depreciation parameters are independent of skill type we have chosen parsimony over degrees of freedom in our data fitting (as described below). Note that if X > M, then the depreciation rate is constant at δ 0 for young individuals.
For a given set of human capital technology parameters
 $\{ \gamma _0^u, \gamma _0^s, \delta _0,\delta _1,X,\zeta \}, $
we iterate over the life-cycle profiles of both skill types until the pension payment and accidental bequests satisfy their respective balanced budget conditions. In every round, we update the preference parameter χ in such a way that the optimal retirement age for an unskilled individual is equal to 65. We then calculate the squared relative deviation of the simulated wage profiles from the empirical values at ages 25, 35, 45 and 55. We choose the set of parameter values that minimizes this distance.
The resulting profiles are depicted in Figure 5(b) and match the data quite closely. The parameter estimates in Table 2 show that the return to labour market experience is somewhat higher for skilled individuals and that having a college education increases start-up human capital by about 32%. On average a skilled person between ages 25 and 60 earns 52.77% more per hour than an unskilled individual. The skill premium is somewhat lower than that usually reported. Heathcote et al. (Reference Heathcote, Perri and Violante2010), for example, calculate a premium of 90% for males in 2005. This discrepancy arises because: (i) we have excluded individuals with less than a high school diploma from our sample; and (ii) the wage profiles are averages over 37 years during which time the premium has risen.
Economic parameters

Sources: SSA is the Social Security Administration of the USA. CPS is the Current Population Survey of the USA.
Next we calculate the steady-state education threshold and set the location parameter of the log-normal utility cost distribution in such a way that the fraction of educated individuals is 38% (in line with the CPS data) under the assumption that the scale parameter equals 1.Footnote 14
Finally, we set the technology parameters for the firms. The income share of capital φ is one-third and the elasticity of substitution between skilled and unskilled labour is 1.41 as estimated by Katz and Murphy (Reference Katz and Murphy1992). The remaining parameters are chosen, so that the factor prices are indeed equal to their postulated values.
4.3 Visualization of the benchmark
Some key indicators of the parameterized benchmark equilibrium (BM hereafter) are reported in first column of Table 4 below. The ratio of consumption to output is 0.702, while the capital–output ratio is 2.435. Both are plausible values.
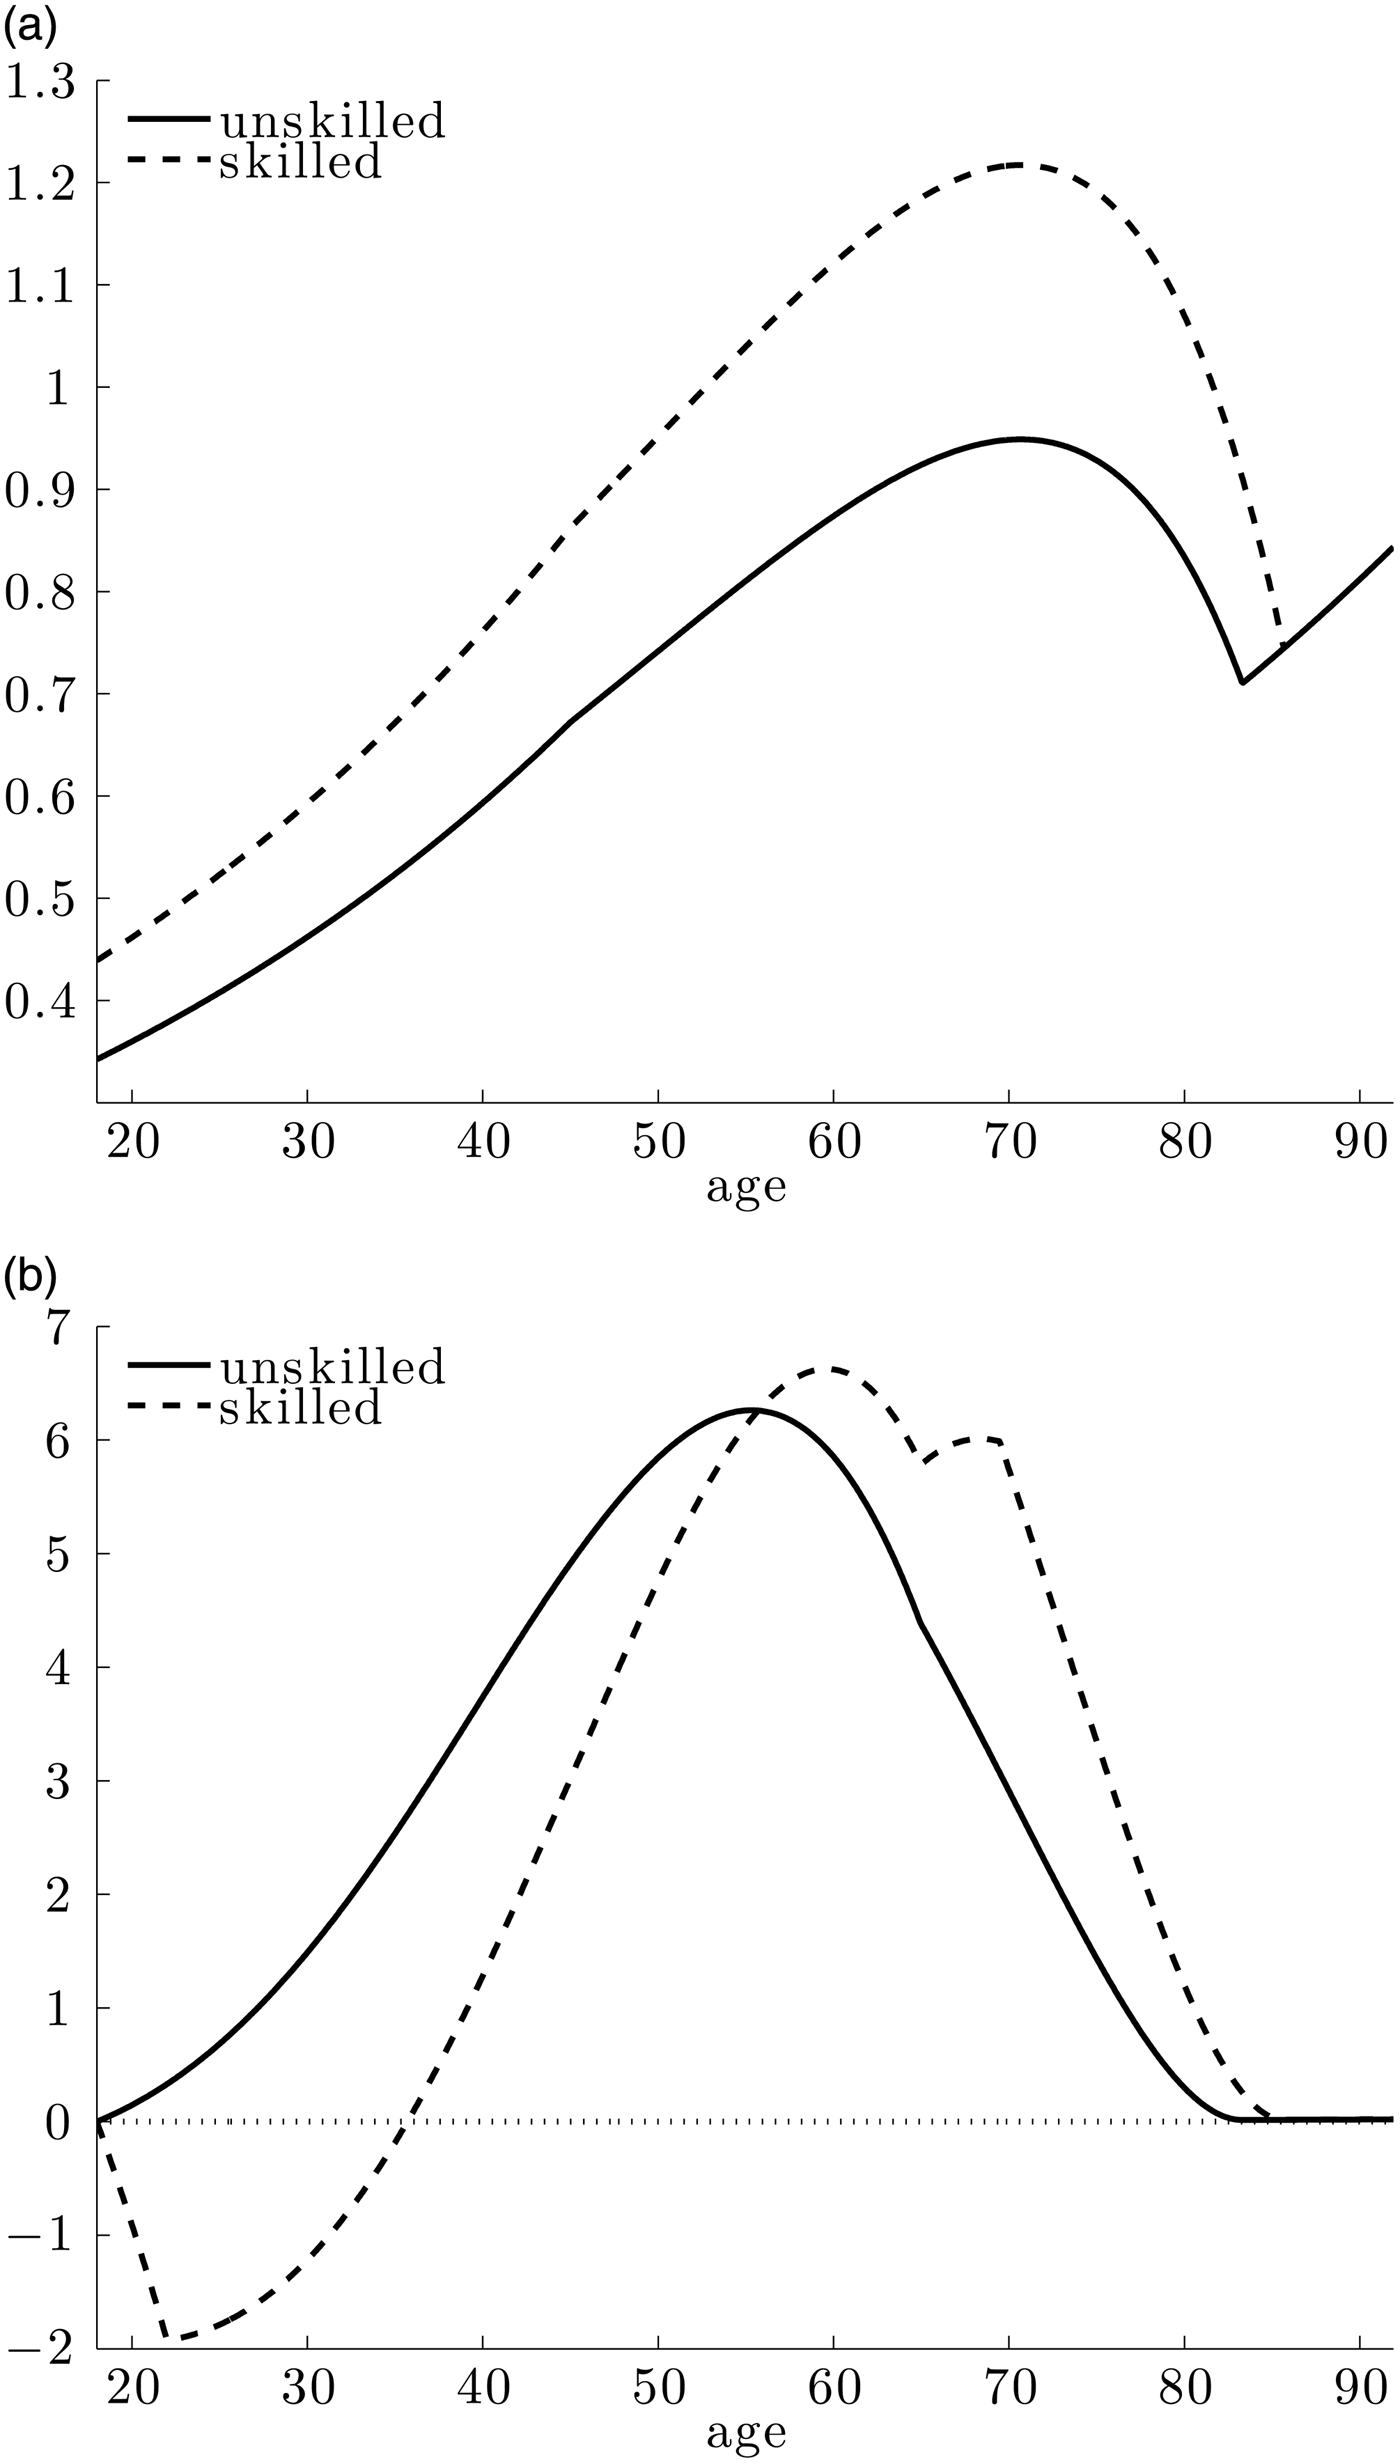
The steady-state life-cycle profiles for consumption and savings are given in Figure 6. These are scaled by the level of technology at the age of majority Z(v + M) to ensure that they are the same for all cohorts. As long as the borrowing constraint does not bind, consumption grows at an exponential rate r − ρ − μ(u). This rate is initially positive (when mortality is low), but becomes negative later in life (when the risk of dying increases). As a consequence the consumption profile is hump-shaped and reaches a peak around age 70 for both skill types. As skilled individuals cannot work during their education period they have to borrow money at the start of life. These loans are fully repaid by the age of 35, well before survival becomes uncertain.
Steady-state life-cycle profiles in the benchmark. (a) Consumption. (b) Financial assets.

Ideally individuals would like to let their consumption decrease to zero as they get close to the maximum age and their chances of survival dwindle. As they still receive income in the form of pension benefits and accidental bequests this would imply that it is optimal to borrow money towards the end of life and repay it in the last few years (conditional on survival). Given that this is not possible, the borrowing constraint will bind and individuals consume exactly their transfer income in each year (which grows at a rate n Z ).Footnote 15 This explains the upward sloping part of the consumption profile at the end of life for both skill types. The age at which the constraint starts to bind is such that there is no jump in consumption.
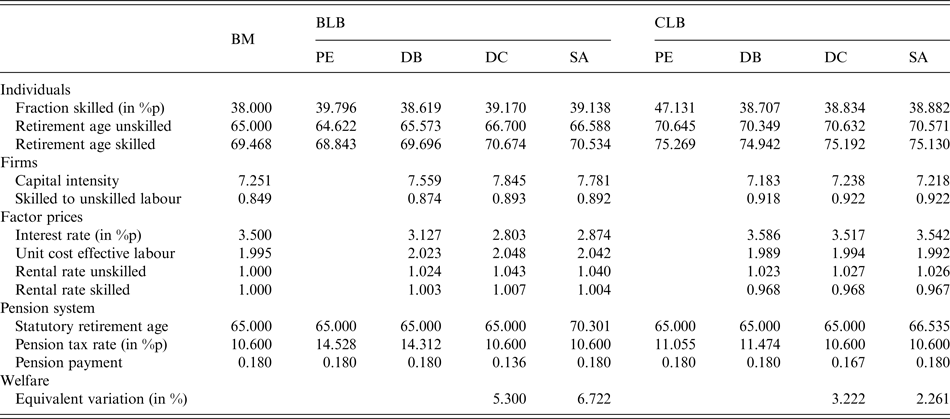
In Table 4 we see that skilled individuals retire from the labour force just before reaching age 70, which is almost 5 years later than the unskilled. The second bump in their asset profile (see the dashed line in Figure 6(b)) is a consequence of the fact that they start to receive their pension payments while they are still working.
5 Long-run effects of increased longevity
In this section, we show the long-run effects predicted by the model of two stylized longevity shocks. The first is a biological longevity boost (BLB), which consists of an outward shift of the survival function. Second, we consider what happens if this increase in the expected length of life is accompanied by an improvement in labour productivity at all ages, this is referred to as the comprehensive longevity boost (CLB).
5.1 Biological longevity boost
If the survival function shifts outward in the way forecasted by the SSA for 2100 (see Figure 1 in the introduction), then the demographic equilibrium changes. We estimate a new set of parameters to fit the data profile for 2100 conditional on survival up to age 45. The maximum age increases to
 $\bar D = 96.968$
and life expectancy at birth goes up by more than 6 years to 83.638; see Table 3. As the population growth rate is unaffected (under the assumption that nothing has happened to fertility) the crude birth rate will have to fall in order for the demographic equilibrium condition given in (16) to hold; see panel (a) of Figure 7.
Demographic changes. (a) Demographic equilibrium. (b) Relative cohort size.

Demographic steady states

The resulting changes in the age composition of the population can be visualized by means of relative cohort sizes. These are defined as:
 $$\displaystyle{{P(v,t)} \over {P(t)}} = \left \{ {\matrix{ {be^{ - n_P[t - v]}S(0,t - v),} & {{\rm for}\;0 \le t - v \le \bar D,} \cr {0,} & {{\rm for}\;t - v \gt \bar D.} \cr}} \right.$$
The size of a cohort relative to the population decreases with its age because cohort members die (reflected in a decreasing probability of survival), while the total number of individuals alive increases (given a positive growth rate). Panel (b) of Figure 7 is similar to one half of the population pyramid (since we make no distinction between sexes here) tilted on its side. The total area underneath the line equals 1 by definition. An outward shift of the survival function and a corresponding decrease in the crude birth rate imply that ‘mass’ is redistributed from the young to the elderly, resulting in an ageing of the population.
The quantitative long-run consequences of a BLB are summarized in Table 4. Initially, we assume that the statutory retirement age and the pension benefit remain fixed and that the tax rate adjusts to balance the budget of the pension system as given in (19). This is known as a DB pension. Keeping factor prices constant at their values in the BM, the first column under the BLB heading reports the partial equilibrium effects of the longevity shock. The retirement age decreases a little for both skill types, which means that individuals expect to spend a significantly longer part of their life in retirement. As a consequence the pension tax rate has to increase from 10.6% to 14.5%. The fraction of educated individuals goes up by almost 2 percentage points as the increased probability of survival during working ages raises the expected payoff of a college degree.
Quantitative results

We wish to make two remarks regarding these partial equilibrium results. First, it would be misleading to interpret the findings as pertaining to a small open economy. For such an economy the factor prices are determined in the rest of the world, but as most countries experience very similar demographic changes these prices cannot be expected to remain constant. Second, the extent to which the fraction of skilled individuals change depends crucially on the dispersion of educational talent in the population. For a given shift in the education threshold, a lower (higher) value of the scale parameter σ θ of the utility cost distribution would have increased (decreased) the proportion of educated individuals relative to that reported in Table 4.Footnote 16 However, qualitatively the results remain the same: it is more attractive to get a college degree.
The next column gives the general equilibrium outcomes under the DB system. Individuals have to save more in order to finance their extended retirement period, which leads to an increase in the capital intensity of production. This results in a drop in the return to capital and a rise in the unit cost of effective labour. The latter has no effect on the retirement decision, but the lower interest rate induces an increase in the retirement age; see Proposition 1. The change in the skill distribution lowers the rental rate on skilled relative to unskilled effective labour. This reduces the incentive to obtain an education and therefore the general equilibrium effect on the fraction of skilled individuals is smaller than the partial equilibrium effect (although still positive).
In the final two columns under the BLB heading we explore alternative assumptions regarding the closure rule for the pension system. The first is a Defined Contribution (DC) system whereby the tax rate on wage income remains constant, while the pension benefit adjusts to balance the budget. Compared to the DB case individuals work about a year longer and save more for old age, which results in a further increase in the capital intensity and reduction of the interest rate. The second possibility is to keep both the tax rate and benefit constant and instead change the statutory age (SA) for retirement. In terms of macroeconomic outcomes, this scenario is in between the previous two. The age at which individuals become eligible for pension benefits goes up by 5.30 years, about 1 year less than the increase in the expected lifespan. Unskilled individuals choose to retire from the labour force almost 4 years before the pension payments start.
We can compare the three different pension systems in terms of their effect on steady-state welfare. In particular, we calculate the percentage by which consumption should change at each moment in time under the DB system in order to make an individual as well off as under one of the alternative pension schemes (an equivalent variation exercise). For each level of the utility cost of education θ we find ω(v|θ) as the solution to:
 $$\eqalign{& \max \{ \Lambda _{DB}^u (v \vert \theta ),\Lambda _{DB}^s (v \vert \theta )\} + \ln (1 + \omega (v \vert \theta ))\int_M^{\bar D} e^{ - \rho [u - M]}S(M\!,u){\kern 1pt} du \cr & = \max \{ \Lambda _i^u (v \vert \theta ),\Lambda _i^s (v \vert \theta )\},} $$
where the subscript i ∈ {DB, DC, SA} indicates the type of pension scheme. Note that each individual chooses to be skilled or unskilled depending on whichever option gives the highest expected utility. We can then calculate the average over all different educational ability types to obtain:
 $$\bar \omega (v) = \int_0^\infty \omega (v \vert \theta ){\kern 1pt} dF_\theta (\theta ).$$
In the steady state, this number does not depend on the date of birth v. The last row of Table 4 reports the average value multiplied by 100%. For example, if there is a BLB, then on average individuals would require 5.30% more consumption under the DB regime to be as well off as under a DC pension scheme and 6.72% to be indifferent with respect to a system that changes the statutory retirement age. It follows that the latter is to be preferred in welfare terms under the BLB.
5.2 Comprehensive longevity boost
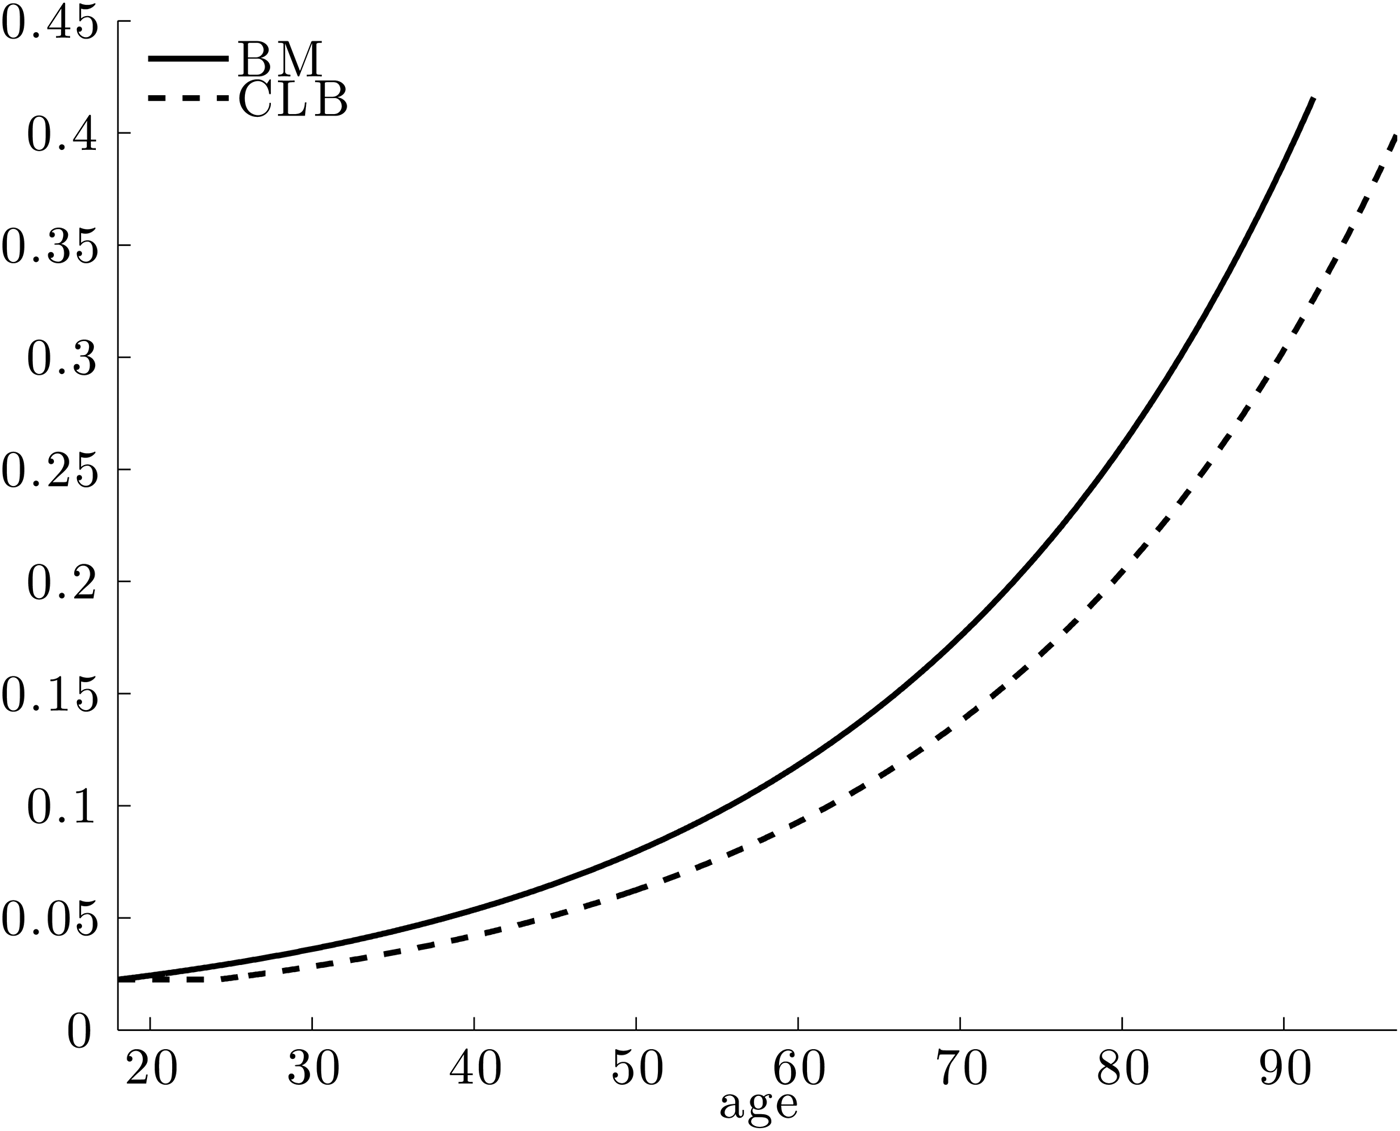
In case of a CLB individuals not only expect to live longer, but are also more productive during their working career. Unfortunately we do not have any data on forecasted productivity changes.Footnote 17 Instead we use a parametric approach and model a productivity improvement as a rightward shift of the human capital depreciation profile through an increase in the parameter X. Figure 8 shows the original and new depreciation rates under the assumption that the change in X equals that in life expectancy (about 6 years). This implies that a person of age 50 now loses skills at the rate that someone of age 44 did previously, etcetera.
Comprehensive longevity boost.

As before, the first column in Table 4 under the CLB heading gives the partial equilibrium effect in case of a DB pension system. The retirement age increases with more than 5 years for both skill types and the fraction of skilled individuals rises by about 9 percentage points. Since people are on average more productive and work longer, the pension tax rate need hardly increase. The general equilibrium repercussions through factor price changes again dampen the incentive to obtain an education, as evidenced by the next column. The capital intensity decreases so that the interest rate increases, while the unit cost of effective labour goes down.
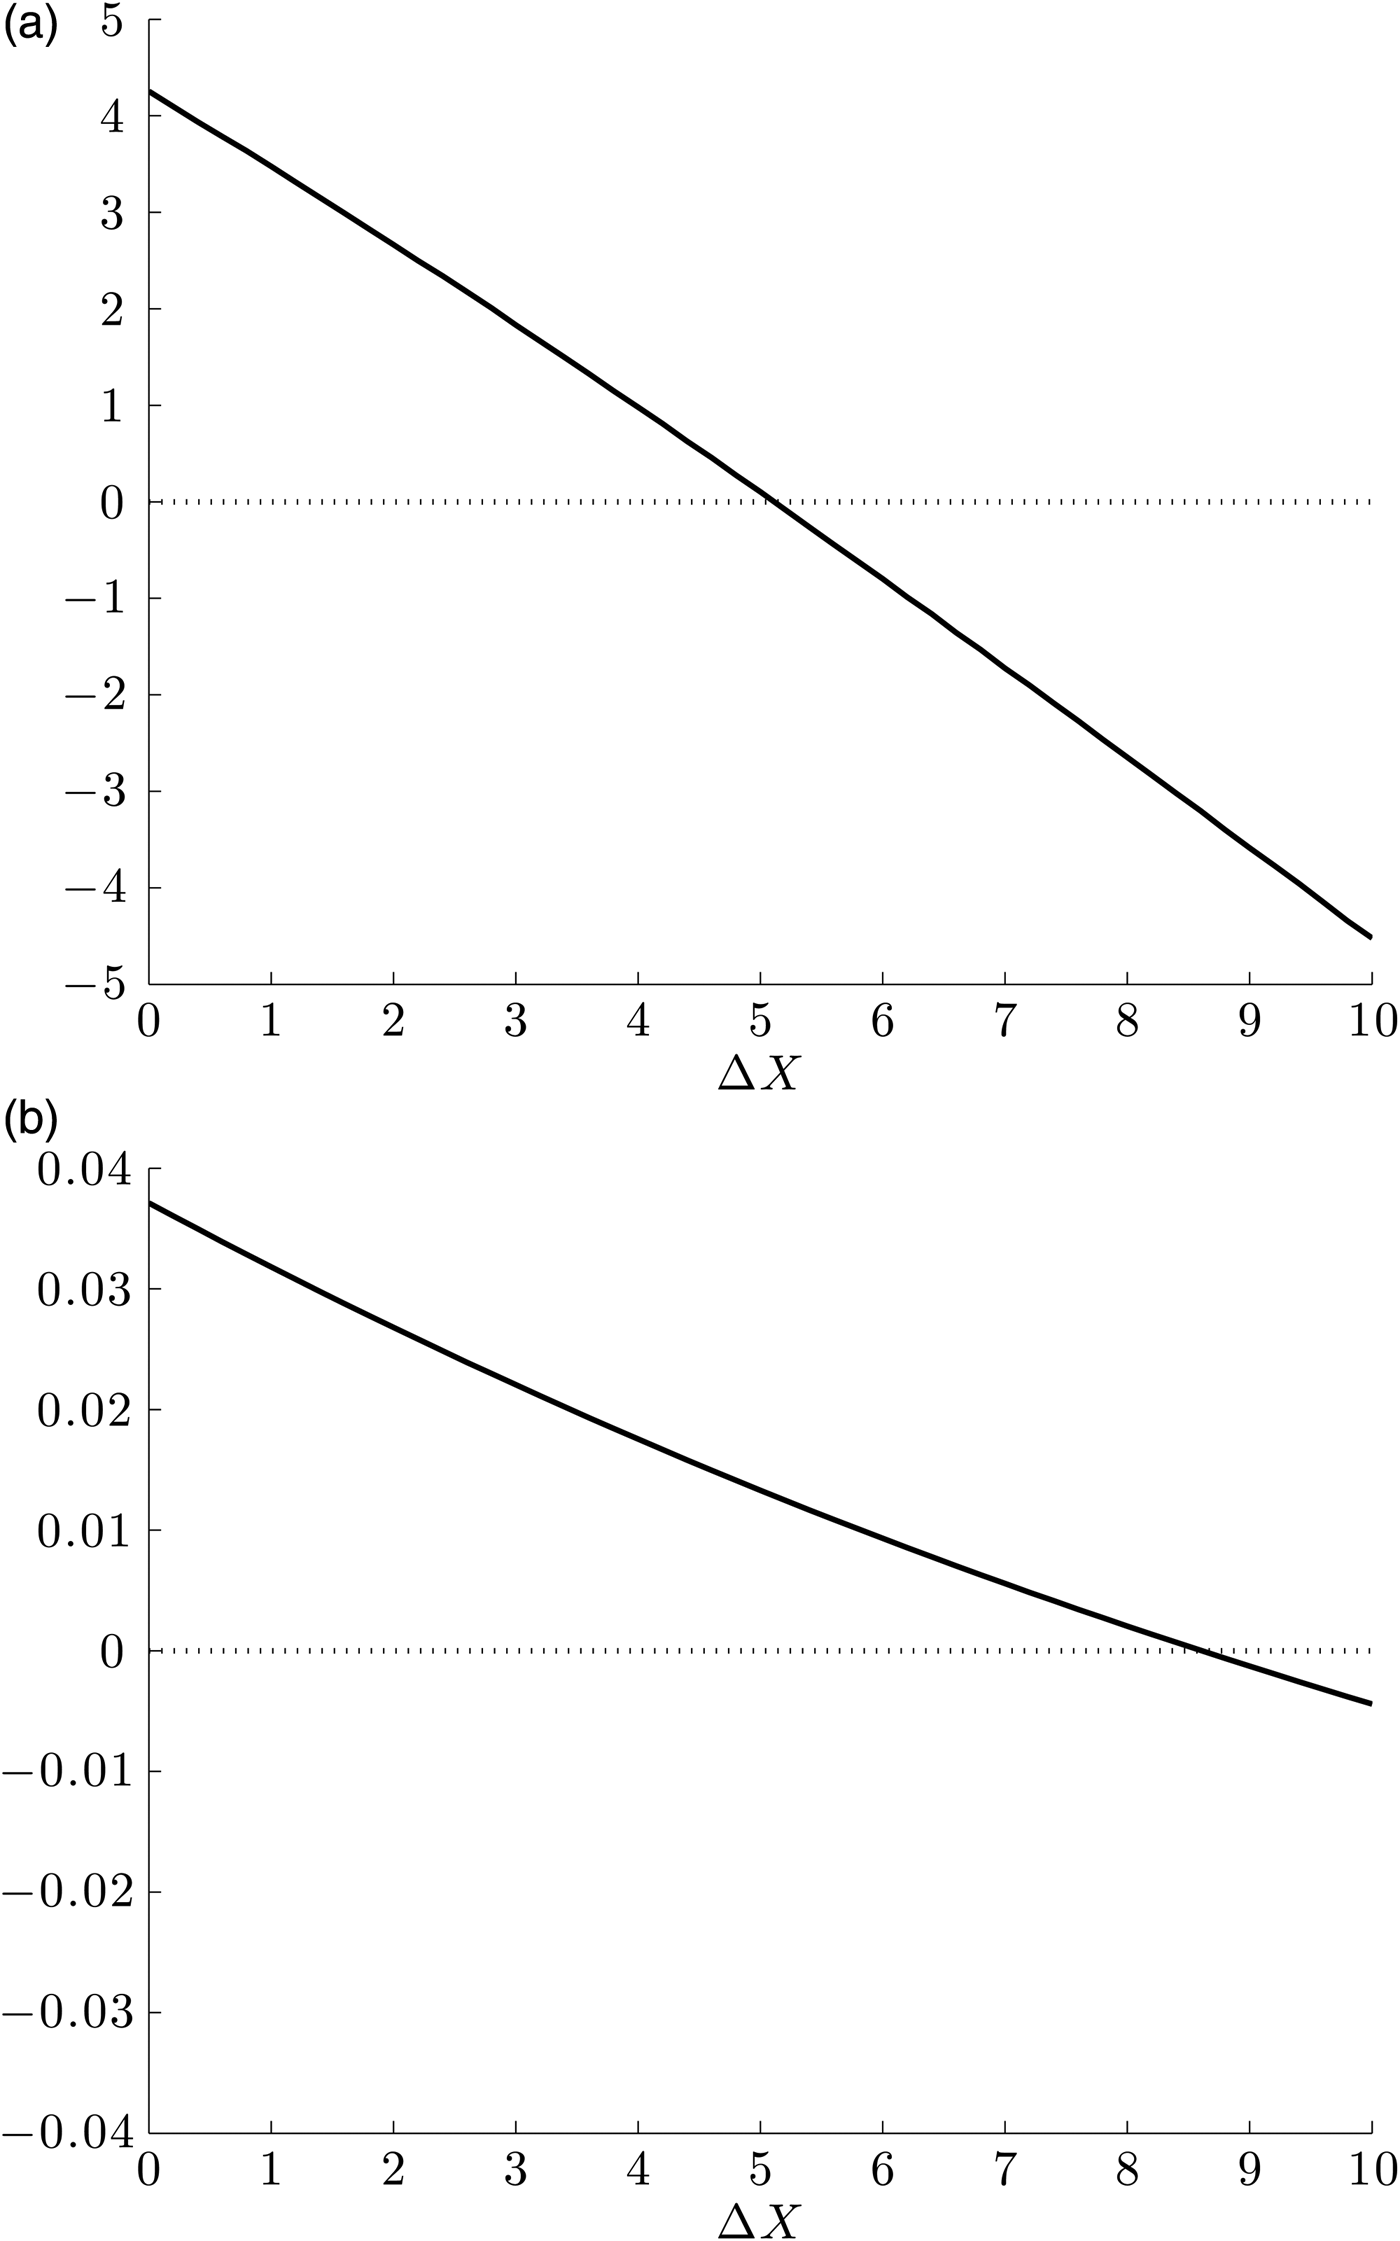
Note that the change in the interest rate under a CLB is in opposite direction to that under a BLB. Whether it goes up or down depends crucially on the relative scarcity of effective labour (or human capital) versus physical capital. This in turn is affected by the increase in labour productivity relative to the improvement in survival probabilities. In Figure 9, we show the general equilibrium outcomes relative to the BM for a whole range of possible changes in X. The BLB corresponds to ΔX = 0, while for the CLB we have ΔX = 6.15. In panel (a), we observe that the capital intensity increases compared to the BM for small changes in X (so that the interest rate goes down), but decreases for larger shifts of the depreciation profile (so that the interest rate goes up). The switching point is around ΔX = 5. The required change in the pension tax rate plotted in panel (b) is also decreasing in ΔX. In the extreme case that individual's productivity improves much faster than their expected lifespan the tax rate might even go down.
General equilibrium outcomes for different values of X. (a) Change in capital intensity (in %). (b) Change in pension tax (in %p).

The result that the interest rate might move in a different direction under a CLB compared with a BLB is robust to different closure rules for the pension system. In the last two columns of Table 4, we report the long-run equilibrium with a DC system or a change in the SA of retirement. In both cases, the interest rate increases relative to the BM. The required adjustments in the pension system are much smaller when individuals not only live longer, but are also more productive. Interestingly, the welfare ranking of the different policy options also changes. It is no longer optimal to adjust the statutory retirement age, instead it is better to keep the contributions fixed.
6 Conclusion
In this paper, we study the long-run effects of a longevity increase on individual decisions about education and retirement, taking macroeconomic repercussions through endogenous factor prices and the pension system into account. We build a model of a closed economy inhabited by overlapping generations of finitely lived individuals whose labour productivity depends on their age through the build-up of labour market experience and the depreciation of human capital. In this context, we present analytical results and a simple quantitative exercise regarding the steady-state effects of two stylized shocks. The first is a BLB, which consists of an outward shift of the survival function. We find that individuals work a little longer but spend most of the additional years in retirement. This prompts an increase in savings, which raises the capital intensity of production and lowers the interest rate. The labour tax rate required to finance a DB PAYG pension system increases by almost 3 percentage points. In contrast, if the increase in life expectancy is accompanied by an improvement in labour productivity through a decrease in human capital depreciation then the retirement age increases significantly. Under this CLB it is possible that human capital becomes relatively abundant in production, resulting in a lower unit cost of effective labour and an increase in the interest rate. As individuals work longer the pension tax rate need hardly change.
Given that we have no direct evidence on the labour productivity of retired workers or changes therein over time, it is hard to determine whether the BLB or the CLB is a more realistic scenario. Nevertheless, we can obtain some indirect evidence from studies on changes in active life expectancy, which is the number of years a person expects to live in a healthy or nondisabled state. For example, Manton et al. (Reference Manton, Gu and Lamb2006) report that active life expectancy is projected to increase in line with actual life expectancy (a little slower, so that the number of disabled years does rise somewhat) over the next decades, which would suggest that a CLB is the more realistic scenario. This is good news for the sustainability of pension systems, provided that the government designs policies that provide elderly individuals with both the opportunity and the incentives to remain active in the labour market. In particular, pension regulations should not punish elderly individuals who are willing and able to continue working past the statutory retirement age.
Appendix A – Proofs
Proposition 1
(Comparative static effects on the retirement age). Suppose that there are no pensions and bequests and that the borrowing constraint never binds. Assume that there is an interior solution for the optimal retirement age in the steady state. Keeping everything else constant we have that for both skill types:
-
(i) An increase in the survival probabilities has an ambiguous effect on the retirement age.
-
(ii) A decrease in the human capital depreciation rate has an ambiguous effect on the retirement age.
-
(iii) An increase in the interest rate leads to a decrease in the retirement age.
-
(iv) An increase in the wage rate does not affect the retirement age.
Proof
The optimal retirement age is at the intersection of the following two curves:
 $$MRS^j(R) = MU_z\displaystyle{{e^{ - (r - \rho )[R - M]}S(M\!,R)} \over {\int_M^{\bar D} e^{ - \rho [u - M]}S(M\!,u){\kern 1pt} du}}\int_{E^j}^R \hat I^j(u)e^{ - r[u - M]}{\kern 1pt} du,$$
 $$OCT^j(R) = e^{\int_{E^j}^R \left[ {n_Z + \gamma ^j(s)\bar l - \delta _h^j (s)} \right]{\kern 1pt} ds},$$
where MU z is a positive constant:
 $$MU_z \equiv - \chi \displaystyle{{{(1 - \bar l)}^{1 - \sigma} - 1} \over {1 - \sigma}} \gt 0.$$
We note the following properties of the two curves:
-
(1) The initial value of OCT j is strictly greater than that of MRS j :
$$OCT(E^j) = 1 \gt MRS(E^j) = 0.$$
-
(2) The final value of OCT j is at least as large as that of MRS j :
$$OCT(\bar D) \ge 0 = MRS(\bar D).$$
-
(3) MRS j is initially increasing in R and then decreasing:
since r >ρ and μ(R) = 0 for R < F but μ(R) → ∞ as
$$\displaystyle{{\partial MRS\,^j(R)} \over {\partial R}} = \left[ {r - \rho - \mu (R) + \displaystyle{{{\hat{I}}^j(R)e^{ - r[R - M]}} \over {\int_{E^j}^R \hskip7pt{\hat{I}}^j(u)e^{ - r[u - M]}{\kern 1pt} du}}} \right]MRS^j(R),$$
$R \to \bar D$
.
-
(4) OCT j is initially increasing in R and then decreasing:
$$\displaystyle{{\partial OCT^j(R)} \over {\partial R}} = \left[ {n_Z + \gamma ^j(R)\bar l - \delta _h^j (R)} \right]OCT^j(R),$$


since γ
j
(R) is constant while
 $\delta _h^j (R)$
is increasing in R.
Let
 $R_0^* $
denote the optimal retirement age in the initial steady-state equilibrium. We assume that this is an interior solution, so that
 $OCT^j(R_0^* ) = MRS^j(R_0^* )$
. The new optimal retirement age is higher than the initial one if
 $OCT^j(R_0^* )$
increases relative to
 $MRS^j(R_0^* )$
and lower otherwise.
-
(i) Suppose that S(M, u) weakly increases for any given u.
-
• There is no change in
$OCT^j(R_0^* )$
. -
• The change in
$MRS^j(R_0^* )$
is ambiguous.
-
-
(ii) Suppose that
$\delta _h^j (u)$
weakly decreases for any given u.
-
• There is an increase in
$OCT^j(R_0^* )$
. -
• There is an increase in
$MRS^j(R_0^* )$
.
-
-
(iii) Suppose that r increases.
-
• There is no change in
$OCT^j(R_0^* )$
. -
• There is an increase in
$MRS^j(R_0^* )$
:
$$\displaystyle{{\partial MRS^j(R_0^* )} \over {\partial r}} = MU_z\displaystyle{{e^{ - \rho [R_0^* - M]}S(M\!,R_0^* )} \over {\int_M^{\bar D} e^{ - \rho [u - M]}S(M\!,u){\kern 1pt} du}}\int_{E^j}^{R_0^*} [R_0^* - u]\hat I^j(u)e^{r[R_0^* - u]}{\kern 1pt} du \gt 0.$$
-
-
(iv) Suppose that w j (t) increases.
-
• There is no change in
$OCT^j(R_0^* )$
. -
• There is no change in
$MRS^j(R_0^* )$
.
-


Appendix B – Computational details
(i) Individual choices
In the steady state, the optimal choices only depend on an individual's age u ≡ t − v, provided that we scale consumption and financial assets by the level of productivity at age M. We define:
 $$\hat c^j(u) = \displaystyle{{c^j(v,v + u)} \over {Z(v + M)}},\quad \hat a^j(u) = \displaystyle{{a^j(v,v + u)} \over {Z(v + M)}},$$
 $$\hat l^j(u) = l^j(v,v + u),\quad \hat h^j(u) = h^j(v,v + u).$$
We take as given the (constant) level of accidental bequests
 $\tilde q \equiv \bar q(t)/Z(t)$
, tax rate on wage income τ, pension provisions
 $\tilde p \equiv \bar p(t)/Z(t)$
, interest rate r and rental rates on effective labour
 $\tilde w^j \equiv w^j(t)/Z(t)$
and assume that the borrowing constraint only binds in the final years of life (we can check this ex post).
-
(1) For any combination of the retirement age R j and the age at which the borrowing constraint starts to bind
$R^j \le B^j \le \bar D$
we can calculate the life-cycle profiles.
-
• Labour supply:
$$\hat l^j(u) = \left \{ {\matrix{ 0 & {{\rm for}\;M \le u \lt E^j,} \cr {\bar l} & {{\rm for}\;E^j \le u \lt R^j,} \cr 0 & {{\rm for}\;R^j \le u \le \bar D.} \cr}} \right.$$
-
• Human capital:
$$\hat h^j(u) = [1 + \zeta d_s^j ]e^{\int_{E^j}^u [\gamma _0^j \bar l - \delta _h^j (s)]{\kern 1pt} ds}.$$
-
• Consumption:
where W j (B j ) is the discounted value of wage income earned and transfers received between ages M and B j :
$$\hat c^j(u) = \left \{ {\matrix{ {\displaystyle{{e^{(r - \rho )[u - M]}S(M\!,u)} \over {\int_M^{B^j} e^{ - \rho [u - M]}S(M\!,u){\kern 1pt} du}}W^j(B^j),} & {{\rm for}\;M \le u \lt B^j,} \cr {[\tilde q + \tilde p]e^{n_Z[u - M]},} & {{\rm for}\;B^j \le u \le \bar D,} \cr}} \right.$$
with
$$W^j(B^j) = \int_M^{B^j} e^{n_Z[u - M]}[(1 - \tau )\tilde w^j\hat h^j(u)\hat l^j(u) + \tilde q + \tilde p{\kern 1pt} 1_{u \ge \bar R}]e^{ - r[u - M]}{\kern 1pt} du$$
$1_{u \ge \bar R}$
the indicator function that equals 1 if
$u \ge \bar R$
and zero otherwise.
-
• Financial assets:
$$\hat a^j(u) = \int_M^u e^{n_Z[s - M]}[(1 - \tau )\tilde w^j\hat h^j(s)\hat l^j(s) + \tilde q + \tilde p{\kern 1pt} 1_{s \ge \bar R} - \hat c^j(s)]e^{ - r[s - u]}{\kern 1pt} ds.$$
-
-
(2) For any retirement age R j we can find the optimal B j by ensuring that at this age there is no jump in consumption:
$$\displaystyle{{e^{(r - \rho )[B^j - M]}S(M\!,B^j)} \over {\int_M^{B^j} e^{ - \rho [u - M]}S(M\!,u){\kern 1pt} du}}W^j(B^j) = [\tilde q + \tilde p]e^{n_Z[B^j - M]}.$$
-
(3) The optimal retirement age R j is the one that maximizes expected lifetime utility and is calculated using a minimization routine.
-
(4) We can find the threshold value for education as the difference between the expected lifetime utility of a skilled individual (ignoring the utility cost of education) and an unskilled individual.


(ii) Macroeconomic equilibrium
To calculate the macroeconomic equilibrium we start with a guess for the scaled capital stock
 $\tilde K \equiv K(t)/[Z(t)P(t)]$
and the two types of effective labour
 $\tilde N^j \equiv N^j(t)/P(t)$
for j ∈ {u, s}. Jointly they determine the factor prices
 $\tilde w^j$
and r. We find the optimal life-cycle profiles of skilled and unskilled individuals and the corresponding education threshold. It is then possible to aggregate across individuals to obtain total consumption
 $\tilde C \equiv C(t)/[Z(t)P(t)]$
, financial assets
 $\tilde A \equiv A(t)/[Z(t)P(t)]$
and effective labour supply
 $\tilde L \equiv L(t)/P(t)$
.
We check whether the goods market is in equilibrium so that
 $\tilde Y = \tilde C + \tilde I$
where
 $\tilde Y \equiv Y(t)/[Z(t)P(t)] = \Phi \tilde K^\phi \tilde N^{1 - \phi} $
and
 $\tilde I \equiv I(t)/[Z(t)P(t)] = (\delta _K + n_P + n_Z)\tilde K$
. If so, then we have found the steady state. If not, then we change the level of accidental bequests and one of the parameters of the pension system using the respective balanced budget conditions. In addition we partially update the guess for the factor supplies in the direction of satisfying the capital market equilibrium condition
 $\tilde K = \tilde A$
and the labour market equilibrium condition
 $\tilde N = \tilde L$
.